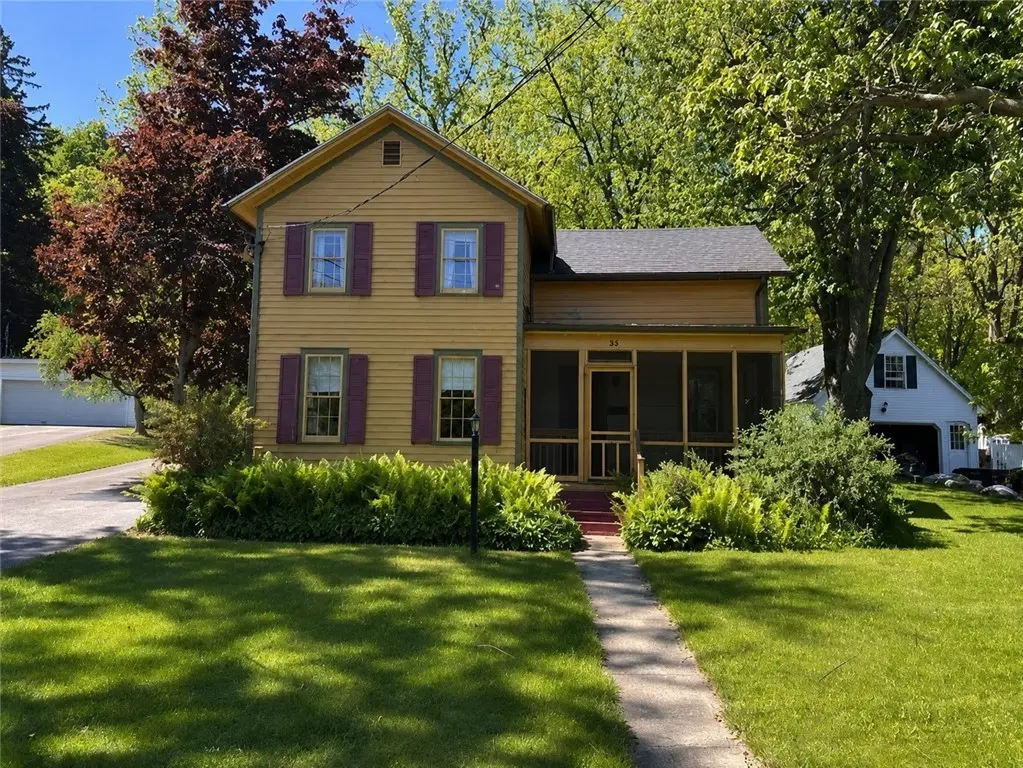
84 E Church St · Fairport, NY
Flood risk 4/10 · Minor
- FEMA flood zone
- X (unshaded)
- Chance of flooding over 30 yrs
- 0.2%
- Est. flood insurance / yr
- $473 – $860
Fire risk 3/10 · Minor
- Est. fire insurance / yr
- $691 – $1,283
Heat risk 2/10 · Minimal
- Hot days now (above 95°F)
- 7 days/yr
- Hot days in 30 yrs
- 16 days/yr
Wind risk 1/10 · Minimal
- Chance of severe wind over 30 yrs
- —
Air-quality risk 2/10 · Minimal
- Unhealthy air days now
- 1 days/yr
- Unhealthy air days in 30 yrs
- 1 days/yr
Risk factors via First Street. Map © Google.
Why this score? — see what drove the C- grade
The composite is a weighted blend of 9 inputs, each scored 0–100. Each bar is that input's sub-score; the figure is the points it added to the 100-point composite (weight × sub-score).
- Cash flow +19.0/30.0
- 1% rule +7.9/10.0
- ARV discount +7.5/15.0
- DSCR +6.0/10.0
- Schools +5.4/10.0
- Livability +3.7/5.0
- Condition / age +2.5/5.0
- Rent growth +2.3/5.0
- Appreciation +0.0/10.0
$185,900
🖨 Deal sheet (PDF) 📄 Offer letter ✓ Due diligence
Listing remarks
Step back in time and discover the charm, character, and potential of this beautiful 1860s Fairport Village home. Offering 1,904 square feet, this 3-bedroom, 2-full-bath home is filled with historic personality and timeless appeal. From the inviting enclosed front porch to the charming back porch, this property offers welcoming spaces to relax, gather, and imagine the possibilities. First floor fully Fairport Electric baseboard heat (with gas hookup in the basement for a furnace/air conditioner -no furnace provided) This home also offers a view of the Erie Canal and is just a short walking distance to the heart of Fairport Village, where you can enjoy local shops, restaurants, cafés,
Key facts
- Back porch
- 3 year old roof
- Enclosed front porch
Tags
Property features AI
Exterior
- Parking: No garage
- Utilities: Electricity connected; Public water connected; Sewer connected
- Home design: 2 stories; Existing (resale) property
- Construction: Wood siding; Shingle roof; Block and slab foundation; Built previously (existing)
- Exterior features: Blacktop driveway; Enclosed porch; Porch; Screened porch
Interior
- Kitchen: Electric oven; Electric range; Refrigerator
- Bedrooms: Total rooms: 7; Has basement (partial)
- Flooring: Ceramic tile; Hardwood; Laminate; Tile; Varies
- Bathrooms: 2 full bathrooms; 1 main-level bathroom
- Heating & cooling: Electric baseboard heating; Heating present
- Interior features: Separate/formal dining room; Storage
- Laundry & utility: Main-level laundry; Electric water heater
Neighborhood map
What this means for you Summary
Snapshot
- This is a 3-bed/2.0-bath single-family listed at $186k.
Deal economics
- At list price, monthly cash flow is $193 ($2k/yr) — positive.
- The deal already cash-flows at list — no discount required.
- Meets the 1% rule at list price ($2k rent vs $186k).
- Cap rate 7.5% vs local median 3.4% in Fairport — top-decile yield for the area; either an underpriced asset or a hidden risk that comps aren't pricing in. Stress-test before assuming the spread holds.
Location & tenants
- Location reads 74/100 on livability (#301 in NY, #4,847 nationally) — a middle-class / working-renter tenant base. Strengths: housing A+, health & safety A+, schools A; Watch: commute F.
- Fairport Central School District (suburban): math 55% / reading 66% proficiency, ranked #199 of 590 in NY (top 34%) — acceptable for families but not a draw, mixed tenant base, ~2y average lease; only 14% free/reduced lunch — higher-income household profile.
- Market conditions: Rents soft (-0.8%/yr); 188 active listings in the ZIP; 8 comparable units currently listed for rent nearby; rentals at typical pace (median 25d on market — plan ~3-4 weeks tenant-placement turnaround); solid renter incomes; 1,169 units permitted in Monroe County in 2024 (591 in 5+ unit buildings).
Forward outlook
- Local home prices are declining (-3.0%/yr); year-one equity from $1k of loan paydown is wiped out by about $6k of value loss. Plan a longer hold.
- Monroe County population projected to shrink 6% by 2050 — rents likely to lag national; underwrite the cash flow, not the appreciation.
Negotiation context
- Only 10 days on market — expect competitive offers; lowballing is unlikely to land.
Risks & watch-outs
- Watch-outs: property tax is 4.2% of price; built in 1860 — expect roof / HVAC / electrical / plumbing capex.
Questions for the listing agent
- Built in 1860 — when were the roof, HVAC, electrical panel, plumbing, and water heater last replaced?
- Property tax is high relative to price — has the assessment been appealed recently, and will the sale trigger a re-assessment?
- Is there a deadline driving the sale (1031 exchange, divorce, estate, relocation)? That informs how much negotiation room exists.
- Schools are A-rated — typically a magnet for longer-tenancy family renters. What's the average tenant stay here, and is there a school-zone premium baked into asking?
- What's the average days-on-market for RENTAL listings here right now (not sales)? A rising rental-DOM trend means longer vacancies and softer asking-rent achievability than the comps imply.
- What's the recent tenant-quality profile in this submarket — average credit score on applications, eviction rate, late-payment / NSF rate, and stable-employment percentage? A property-management company in the area should have these aggregated.
- How much new for-sale + rental construction is in the pipeline within 1–3 miles? Heavy new supply typically softens prices + rents 12–24 months out; constrained supply supports both.
Investment metrics
- 1% rule
- 1.29% ✓
- Cap rate
- 7.54%
- Cash-on-cash
- 4.44%
- DSCR
- 1.20
- GRM
- 6.4
CMA / ARV
- ARV (on-the-fly)
- $456,960
- Comps found
- 12
Show comp detail 12 sales within ~0.75 mi
| Address | Dist | Beds/Ba | Sqft | Sold | Price | $/sf | Match |
|---|---|---|---|---|---|---|---|
| 95 Summit St | 0.25mi | 4/2.0 (+1) | 1,956 (+3%) | 2mo | $350,000 | $179 | 77 |
| 27 South Ave | 0.41mi | 3/1.5 | 1,884 (-1%) | 1mo | $385,000 | $204 | 76 |
| 85 E Pointe | 0.46mi | 3/2.5 | 1,982 (+4%) | 2mo | $551,500 | $278 | 68 |
| 6 Silver Birch Cir | 0.39mi | 3/1.5 | 1,817 (-5%) | 10mo | $310,000 | $171 | 64 |
| 28 Misty Pine Rd | 0.52mi | 4/2.5 (+1) | 1,836 (-4%) | 4mo | $458,280 | $250 | 59 |
| 7 Woodlawn Ave | 0.63mi | 4/2.0 (+1) | 1,906 (+0%) | 11mo | $568,000 | $298 | 57 |
| 3 Freshfield | 0.60mi | 3/2.5 | 2,044 (+7%) | 2mo | $490,000 | $240 | 56 |
| 17 Freshfield Rise | 0.54mi | 4/2.5 (+1) | 2,054 (+8%) | 3mo | $503,000 | $245 | 53 |
| 51 Williamsburg Dr | 0.69mi | 3/1.5 | 1,800 (-6%) | 12mo | $387,900 | $216 | 47 |
| 19 Williamsburg Dr | 0.67mi | 3/2.0 | 1,632 (-14%) | 3mo | $340,000 | $208 | 42 |
| 25 E Pointe | 0.66mi | 3/2.5 | 2,144 (+13%) | 9mo | $355,000 | $166 | 38 |
| 24 Dewey Ave | 0.65mi | 4/2.0 (+1) | 2,170 (+14%) | 10mo | $552,000 | $254 | 33 |
Match score weights: distance 35% · size 25% · config 20% · recency 20%. Top-matched comps best support the ARV.
Projected returns pro-forma
-3.0% appreciation · 0.0% rent growth · sell at horizon
- IRR
- -13.7%
- Equity multiple
- 0.53×
- Total profit
- $-24,591
- Equity at exit
- $27,718
- IRR
- -12.5%
- Equity multiple
- 0.39×
- Total profit
- $-31,614
- Equity at exit
- $16,073
Cash invested: $52,052 (down + closing). Projections, not guarantees.
Landlord ↔ Tenant lean methodology
- Overall (STATE)
- 15 Strongly Tenant-Friendly
- State New York
- 15 Strongly Tenant-Friendly · D+10
- County
- — inherits STATE
- City
- — inherits STATE
ZIP-level market 14450
- Rents YoY
- -0.8%
- Active inventory
- 188
- Price-to-rent
- 6.4×
Monthly cashflow live
- Estimated rent
- $2,402 high interval (Pro) →
- Mortgage (P&I)
- −$975
- Tax from tax record
- −$653 /mo · $7,831/yr
- Insurance
- −$77
- HOA
- −$0
- Vacancy / Maint / Mgmt
- −$504
- Net cashflow
- $193
Break-even live
Sensitivity live
| Price | -10% $298 | -5% $245 | +0% $193 | +5% $140 | +10% $88 |
|---|---|---|---|---|---|
| Rent | -10% $3 | -5% $98 | +0% $193 | +5% $288 | +10% $383 |
| Rate | -1.0pp $286 | -0.5pp $240 | base $193 | +0.5pp $145 | +1.0pp $96 |
UW: 25.0% down · 7.5% · 30yr · 1.5% tax · 5.0% vac · 8.0% maint · 8.0% mgmt
Financing live
Cash to close
- Down payment
- $46,475
- Closing costs
- $5,577
- Reserves months
- —
- Total cash needed
- —
Loan-product check · same deal, 3 products live
Conventional
25% down · 7.5% · 30yr
- Down + closing
- —
- Monthly P&I
- —
- Monthly cashflow
- —
- DSCR
- —
- Eligible?
- —
Personal DTI + credit; lowest rate.
DSCR
20% down · 8.5% · 30yr
- Down + closing
- —
- Monthly P&I
- —
- Monthly cashflow
- —
- DSCR
- —
- Eligible?
- —
No personal income docs; deal must DSCR.
Hard money
10% down · 12.0% · 12mo
- Down + closing
- —
- Monthly P&I
- —
- Monthly cashflow
- —
- DSCR
- —
- Eligible?
- —
Short-term bridge; refi at stabilization.
Rent comps 8 comps
| Address | Beds | Baths | Sqft | Rent | $/sqft | DOM | Units | Dist |
|---|---|---|---|---|---|---|---|---|
| 11 Pleasant St Unit 3 Fairport, NY | 3.0 | 1.0 | 2400 | $3,150 | $1.31 | 45d | 1 | 0.28mi |
| 166 High St Unit A Fairport, NY | 2.0 | 2.0 | 1600 | $2,300 | $1.44 | 45d | 1 | 0.37mi |
| 166 High St Unit B Fairport, NY | 2.0 | 1.5 | 1300 | $2,000 | $1.54 | 24d | 1 | 0.37mi |
| 113 High St Unit A Fairport, NY | 3.0 | 1.0 | 2412 | $2,100 | $0.87 | 24d | 1 | 0.43mi |
| 100 Ezra Xing Fairport, NY | 2.0 | 2.0 | 1200 | $2,868 | $2.39 | 4d | 1 | 1.06mi |
| 1555 Whitney Rd E Fairport, NY | 4.0 | 2.0 | 2100 | $2,450 | $1.17 | 4d | 1 | 1.28mi |
| 4395 Nine Mile Point Rd Fairport, NY | 2.0 | 1.0 | 2474 | $1,495 | $0.60 | 4d | 1 | 1.42mi |
| 1253 Fairport Rd Fairport, NY | 3.0 | 2.0 | 2194 | $2,500 | $1.14 | 4d | 1 | 1.46mi |
Listing history 9 events
-
2026-06-19status $185,900 Pending 10 DOM
-
2026-06-18days on market $185,900 Active Under Contract 10 DOM
-
2026-06-17status $185,900 Active Under Contract 9 DOM
-
2026-06-17days on market $185,900 Active 9 DOM
-
2026-06-16days on market $185,900 Active 8 DOM
-
2026-06-15days on market $185,900 Active 7 DOM
-
2026-06-13days on market $185,900 Active 5 DOM
-
2026-06-10remarks 692-char remark
-
2026-06-10$185,900 Active 2 DOM
ⓘ Source: listings_history table (triggers on properties + properties_extension) + one-shot
backfill from property_details.listing_events for pre-trigger history.
Tax reassessment forecast NY · Partial reset (capped growth)
- Current annual tax
- $7,831 · $653/mo
- Projected year-2 tax
- $7,831 · $653/mo
- Expected delta
- $0/yr ($0/mo · 0.0%)
ⓘ Screening estimate from a state-policy table — verify with the county assessor before closing.
Climate risk First Street
- Flood 4/10 Moderate FEMA zone X (unshaded) · 20% chance over 30 yrs
- Wildfire 3/10 Moderate
- Heat 2/10 Low 7 d/yr ≥95°F today · 16 d/yr by 30 yrs out
- Wind 1/10 Low
- Air quality 2/10 Low 1 unhealthy d/yr today · 1 by 30 yrs out
Nearby sold comps map
Loading sold comps map…
Walkable amenities ~0.75 mi
Loading nearby amenities…
Taxation est. · year 1
- Rental income
- $28,826
- − Mortgage interest
- −$10,413
- − Property taxes
- −$7,831
- − Insurance
- −$930
- − Repairs & maintenance
- −$2,306
- − Management
- −$2,306
- − Depreciation
- −$5,408
- Taxable loss
- −$368
- Est. tax savings @ 24.0%
- +$88
- After-tax cash flow
- $2,402/yr
For passive investors: Depreciation is non-cash, so a rental often shows a tax loss while cash-flowing — sheltering income. Rental losses are passive: they offset passive income freely, and up to $25,000/yr can offset ordinary (W-2) income if you actively participate and your MAGI is under $100k (phasing out to $0 by $150k); unused losses carry forward. On sale, claimed depreciation is recaptured at up to 25%, and gains may owe capital-gains tax (a 1031 exchange can defer both). Figures are a year-1 estimate at your 24.0% rate — not tax advice; consult a CPA.
Schools (NCES district)
- District
- Fairport Central School District
- NCES district ID
- 3610890
- Math proficiency
- 55% ▼ -16.00%
- Reading proficiency
- 66% ▲ 3.00%
- Median HH income
- $74,981
- Composite
- 53.84/100
- National rank
- #1409
- State rank
- #199 of 590 in NY
Livability — Fairport
- Score
- 74/100
- State rank
- #301
- US rank
- #4847
Category grades
Schools grade is shown separately in the Schools card above.
Census & demographics
- Census place
- Fairport, NY
- County
- Monroe County · 674,131 people
- City population
- 42,750
- Metro
- Rochester, NY
- Population (ZIP)
- 42,750
- Household income
- $109,466
- Rent vs Own
- Severe rent burden
- 843.0
Population outlook (Monroe County) Hauer SSP2
- Today (2025)
- 759,460 people
- By 2030
- 757,154 · -0.3%
- By 2040
- 740,644 · -2.5%
- By 2050
- 714,443 · -5.9%
- By 2075
- 645,883 · -15.0%
- By 2100
- 547,084 · -28.0%
Race, ethnicity, and origin ACS 2023
- Neighborhood character
- Predominantly White (89%)
- Race & ethnicity
- White 89% Two or more races 5% Hispanic / Latino 3% Asian 2% Black 2%
- Common ancestry
- Romanian 6% Lithuanian 2% Iranian 2%
- Foreign-born
- 6% · Canada, China, South Korea
- Languages at home
- 94% English-only · Other Indo-European 1% Spanish 1% Other Asian/Pacific 1%
Political lean MEDSL · Monroe
- 2024 margin
- D (+19.1) · D 59.5% · R 40.5%
- 2008→2024 swing
- +1.4pp toward D · 2008: 17.7pp · 2024: 19.1pp
- All cycles
- 2024: D+19.1 2020: D+21.0 2016: D+14.1 2012: D+17.4 2008: D+17.7
Not yet ingested
- Civics
- —
Market trends
- HPI YoY
- ▼ -189.56%
- Current HPI
- 270.7329
- Rent YoY
- ▼ -0.84%
- Metro
- Rochester, NY
- State GDP YoY
- ▲ 2.60%
- F500 in state
- 92
Industry mix (Fortune 500 HQ in NY)
| Industry | F500 HQs | Revenue |
|---|---|---|
| Financial Services | 10 | $950B |
|
||
| Consumer Goods | 9 | $162B |
|
||
| Insurance | 4 | $225B |
|
||
| Telecommunications | 2 | $144B |
|
||
| Pharmaceuticals | 2 | $112B |
|
||
| Media / Entertainment | 2 | $69B |
|
||
Price history
1 event — show timeline
- 2026-06-08 Listed $185,900 UNYREIS
Property tax history
+4.4%/yrLatest (2025): $7,831 · +27.6% YoY. Source: county tax records.
Cash-flow waterfall
monthlySold comps — $/sqft
last 12 mo · ≤1 miLoading sold comps…