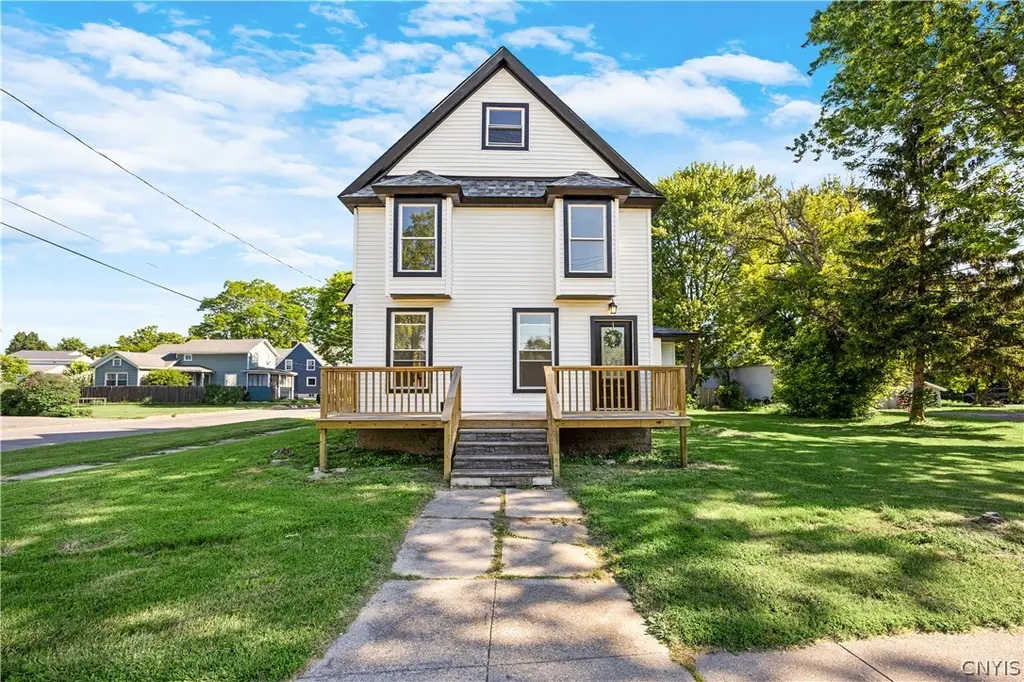
300 E North Canal St · Canastota, NY
Flood risk 1/10 · Minimal
- FEMA flood zone
- X
- Chance of flooding over 30 yrs
- 0.0%
- Est. flood insurance / yr
- $473 – $860
Fire risk 1/10 · Minimal
- Est. fire insurance / yr
- $691 – $1,283
Heat risk 3/10 · Minor
- Hot days now (above 94°F)
- 7 days/yr
- Hot days in 30 yrs
- 16 days/yr
Wind risk 1/10 · Minimal
- Chance of severe wind over 30 yrs
- —
Air-quality risk 2/10 · Minimal
- Unhealthy air days now
- 0 days/yr
- Unhealthy air days in 30 yrs
- 1 days/yr
Risk factors via First Street. Map © Google.
Why this score? — see what drove the D- grade
The composite is a weighted blend of 9 inputs, each scored 0–100. Each bar is that input's sub-score; the figure is the points it added to the 100-point composite (weight × sub-score).
- Appreciation +10.0/10.0
- Cash flow +7.9/30.0
- ARV discount +3.7/15.0
- Schools +3.7/10.0
- Livability +3.7/5.0
- 1% rule +2.9/10.0
- Rent growth +2.5/5.0
- Condition / age +2.5/5.0
- DSCR +2.0/10.0
$225,000
🖨 Deal sheet 📄 Offer letter ✓ Due diligence
Listing remarks
If you've been searching for space, this one is worth a look! Offering over 2,000 square feet, this completely renovated Village of Canastota home features a spacious, open floor plan with room for everyone. The first floor has 9-foot ceilings, an open and spacious living area, two bedrooms, a full bath, and a large mudroom that adds everyday convenience. Upstairs, you'll find two additional bedrooms, a second full bath, a bonus room that could serve as a home office or potential fifth bedroom, and a second living room—perfect for a rec room, playroom, or additional gathering space. Recent improvements include a new roof, flooring, kitchen, bathrooms, windows, furnace, and electrical,
Key facts
- Open floor plan
- New front porch
- Large mudroom
Tags
Property features AI
Exterior
- Parking: Attached garage with 1 space
- Utilities: Public water connected; Sewer connected
- Home design: 2-story single-family home; Existing construction; Vinyl siding; Stone foundation
- Construction: Vinyl siding exterior; Stone foundation
- Exterior features: Blacktop driveway; Corner lot; Rectangular residential lot; City street frontage
Interior
- Kitchen: Dishwasher; Gas oven; Gas range; Refrigerator; Pantry
- Bedrooms: 2 bedrooms on the main level
- Flooring: Laminate; Luxury vinyl; Varies
- Bathrooms: 2 full bathrooms (1 on the main level)
- Heating & cooling: Forced air gas heating; Central air conditioning
- Interior features: Den; Entrance foyer; Separate/formal living room; Great room; Country kitchen; Combined living/dining room; Pantry; Bedroom on main level; Full basement
- Laundry & utility: Laundry in basement; Gas water heater
Neighborhood map
What this means for you Summary
Snapshot
- This is a 4-bed/2.0-bath single-family listed at $225k.
Deal economics
- At list price, monthly cash flow is $-240 ($-3k/yr) — negative.
- To cash-flow at today's rent, offer at most $183k (18.9% below list).
- To meet the 1% rule (rent ≥ 1% of price), the offer needs to be $177k (21.5% below list).
- Recommended offer: $177k (21.5% below list) — sets the bar for 1% rule.
- Cap rate 5.0% vs local median 3.5% in Canastota — top-decile yield for the area; either an underpriced asset or a hidden risk that comps aren't pricing in. Stress-test before assuming the spread holds.
Location & tenants
- Location reads 73/100 on livability (#332 in NY) — a middle-class / working-renter tenant base. Strengths: housing A+, health & safety A+, cost of living A; Watch: employment D+, amenities F, commute F.
- Canastota Central School District (town): math 39% / reading 48% proficiency, ranked #473 of 590 in NY (top 80%) — families likely to look elsewhere, expect single-tenant / working-renter base with shorter leases.
- Market conditions: 53 active listings in the ZIP; 137 units permitted in Madison County in 2024 (46 in 5+ unit buildings).
Forward outlook
- In year one you build about $24k of equity ($2k loan paydown + $22k appreciation (10.0% local appreciation)).
- Madison County population projected at -24% by 2050 — secular population decline; favor cash flow + early exit over multi-decade hold.
- By year 2, paydown + projected appreciation supports a ~$39k cash-out refi (75% LTV) — recoverable capital for the next deal without selling this one.
Negotiation context
- Only 6 days on market — expect competitive offers; lowballing is unlikely to land.
- Current owner paid $79k; list at $225k implies a 185% gain — meaningful room to come down on a strong offer.
Risks & watch-outs
- Watch-outs: built in 1890 — expect roof / HVAC / electrical / plumbing capex.
Questions for the listing agent
- What do current leases actually rent for vs. the listed asking? Can we see a recent rent roll and the last 12 months of T-12 income?
- Built in 1890 — when were the roof, HVAC, electrical panel, plumbing, and water heater last replaced?
- Is there a deadline driving the sale (1031 exchange, divorce, estate, relocation)? That informs how much negotiation room exists.
- The area grade is low — what's the realistic commute time and amenity access for the typical tenant pool here? Any planned neighborhood developments (good or bad) we should know about?
- What's the average days-on-market for RENTAL listings here right now (not sales)? A rising rental-DOM trend means longer vacancies and softer asking-rent achievability than the comps imply.
- What's the recent tenant-quality profile in this submarket — average credit score on applications, eviction rate, late-payment / NSF rate, and stable-employment percentage? A property-management company in the area should have these aggregated.
- How much new for-sale + rental construction is in the pipeline within 1–3 miles? Heavy new supply typically softens prices + rents 12–24 months out; constrained supply supports both.
Investment metrics
- 1% rule
- 0.79% ✗
- Cap rate
- 5.01%
- Cash-on-cash
- -4.58%
- DSCR
- 0.80
- GRM
- 10.6
CMA / ARV
- ARV (on-the-fly)
- $207,646
- Comps found
- 9
Show comp detail 9 sales within ~0.75 mi
| Address | Dist | Beds/Ba | Sqft | Sold | Price | $/sf | Match |
|---|---|---|---|---|---|---|---|
| 509 N Main St | 0.58mi | 4/2.0 | 2,206 (-0%) | 2mo | $139,050 | $63 | 72 |
| 316 S Peterboro St | 0.43mi | 3/2.0 (-1) | 2,232 (+1%) | 6mo | $210,000 | $94 | 68 |
| 108 West Ave | 0.63mi | 4/2.0 | 2,220 (+0%) | 14mo | $207,000 | $93 | 58 |
| 115 S Main St | 0.31mi | 4/2.0 | 1,928 (-13%) | 15mo | $170,000 | $88 | 52 |
| 205 N Main St | 0.32mi | 4/1.5 | 2,488 (+13%) | 14mo | $230,000 | $92 | 51 |
| 312 Lewis St | 0.42mi | 3/1.5 (-1) | 2,122 (-4%) | 22mo | $205,000 | $97 | 48 |
| 214 Prospect St | 0.53mi | 3/1.5 (-1) | 2,112 (-4%) | 17mo | $229,000 | $108 | 47 |
| 330 N Peterboro St | 0.36mi | 4/1.0 | 2,456 (+11%) | 19mo | $275,000 | $112 | 44 |
| 109 3rd St | 0.50mi | 3/1.5 (-1) | 1,937 (-12%) | 11mo | $281,500 | $145 | 40 |
Match score weights: distance 35% · size 25% · config 20% · recency 20%. Top-matched comps best support the ARV.
Projected returns pro-forma
10.0% appreciation · 3.0% rent growth · sell at horizon
- IRR
- 21.0%
- Equity multiple
- 2.70×
- Total profit
- $107,308
- Equity at exit
- $202,698
- IRR
- 19.1%
- Equity multiple
- 6.21×
- Total profit
- $328,196
- Equity at exit
- $437,126
Cash invested: $63,000 (down + closing). Projections, not guarantees.
Landlord ↔ Tenant lean methodology
- Overall (STATE)
- 15 Strongly Tenant-Friendly
- State New York
- 15 Strongly Tenant-Friendly · D+10
- County
- — inherits STATE
- City
- — inherits STATE
ZIP-level market 13032
- Home prices YoY
- 5.7%
- Active inventory
- 53
- Price-to-rent
- 10.6×
Monthly cashflow live
- Estimated rent
- $1,766 medium interval (Pro) →
- Mortgage (P&I)
- −$1,180
- Tax from tax record
- −$362 /mo · $4,345/yr
- Insurance
- −$94
- HOA
- −$0
- Vacancy / Maint / Mgmt
- −$371
- Net cashflow
- $-240
Break-even live
UW: 25.0% down · 7.5% · 30yr · 1.5% tax · 5.0% vac · 8.0% maint · 8.0% mgmt
Financing live
Cash to close
- Down payment
- $56,250
- Closing costs
- $6,750
- Reserves months
- —
- Total cash needed
- —
Loan-product check · same deal, 3 products live
Conventional
25% down · 7.5% · 30yr
- Down + closing
- —
- Monthly P&I
- —
- Monthly cashflow
- —
- DSCR
- —
- Eligible?
- —
Personal DTI + credit; lowest rate.
DSCR
20% down · 8.5% · 30yr
- Down + closing
- —
- Monthly P&I
- —
- Monthly cashflow
- —
- DSCR
- —
- Eligible?
- —
No personal income docs; deal must DSCR.
Hard money
10% down · 12.0% · 12mo
- Down + closing
- —
- Monthly P&I
- —
- Monthly cashflow
- —
- DSCR
- —
- Eligible?
- —
Short-term bridge; refi at stabilization.
Listing history 6 events
-
2026-06-17status $225,000 Pending 6 DOM
-
2026-06-16days on market $225,000 Active 6 DOM
-
2026-06-15days on market $225,000 Active 5 DOM
-
2026-06-13days on market $225,000 Active 3 DOM
-
2026-06-12remarks 693-char remark
-
2026-06-12$225,000 Active 2 DOM
ⓘ Source: listings_history table (triggers on properties + properties_extension) + one-shot
backfill from property_details.listing_events for pre-trigger history.
Tax reassessment forecast NY · Partial reset (capped growth)
- Current annual tax
- $4,345 · $362/mo
- Projected year-2 tax
- $4,345 · $362/mo
- Expected delta
- $0/yr ($0/mo · 0.0%)
ⓘ Screening estimate from a state-policy table — verify with the county assessor before closing.
Climate risk First Street
- Flood 1/10 Low FEMA zone X · 0% chance over 30 yrs
- Wildfire 1/10 Low
- Heat 3/10 Moderate 7 d/yr ≥94°F today · 16 d/yr by 30 yrs out
- Wind 1/10 Low
- Air quality 2/10 Low 0 unhealthy d/yr today · 1 by 30 yrs out
Nearby sold comps map
Loading sold comps map…
Walkable amenities ~0.75 mi
Loading nearby amenities…
Taxation est. · year 1
- Rental income
- $21,196
- − Mortgage interest
- −$12,603
- − Property taxes
- −$4,345
- − Insurance
- −$1,125
- − Repairs & maintenance
- −$1,696
- − Management
- −$1,696
- − Depreciation
- −$6,545
- Taxable loss
- −$6,814
- Est. tax savings @ 24.0%
- +$1,635
- After-tax cash flow
- $-1,249/yr
For passive investors: Depreciation is non-cash, so a rental often shows a tax loss while cash-flowing — sheltering income. Rental losses are passive: they offset passive income freely, and up to $25,000/yr can offset ordinary (W-2) income if you actively participate and your MAGI is under $100k (phasing out to $0 by $150k); unused losses carry forward. On sale, claimed depreciation is recaptured at up to 25%, and gains may owe capital-gains tax (a 1031 exchange can defer both). Figures are a year-1 estimate at your 24.0% rate — not tax advice; consult a CPA.
Schools (NCES district)
- District
- Canastota Central School District
- NCES district ID
- 3606390
- Math proficiency
- 39% ▼ -6.00%
- Reading proficiency
- 48% ▲ 8.00%
- Median HH income
- $50,825
- Composite
- 37.44/100
- National rank
- #4413
- State rank
- #473 of 590 in NY
Livability — Canastota
- Score
- 73/100
- State rank
- #332
- US rank
- #5485
Category grades
Schools grade is shown separately in the Schools card above.
Census & demographics
- Census place
- Canastota, NY
- City population
- 12,964
- Population (ZIP)
- 12,964
Population outlook (Madison County) Hauer SSP2
- Today (2025)
- 69,528 people
- By 2030
- 66,599 · -4.2%
- By 2040
- 59,814 · -14.0%
- By 2050
- 52,842 · -24.0%
- By 2075
- 39,167 · -43.7%
- By 2100
- 28,442 · -59.1%
Race, ethnicity, and origin ACS 2023
- Neighborhood character
- Predominantly White (89%)
- Race & ethnicity
- White 89% Two or more races 8% Hispanic / Latino 2% Black 2%
- Common ancestry
- Romanian 5% Iranian 5% Lithuanian 4%
- Foreign-born
- 2% · Canada
- Languages at home
- 95% English-only · Russian/Polish/Slavic 2% French/Haitian/Cajun 1% Spanish 1%
Political lean MEDSL · Madison
- 2024 margin
- R (+13.1) · D 43.5% · R 56.5%
- 2008→2024 swing
- -13.9pp toward R · 2008: 0.9pp · 2024: -13.1pp
- All cycles
- 2024: R+13.1 2020: R+10.6 2016: R+15.9 2012: D+0.3 2008: D+0.9
Not yet ingested
- Civics
- —
Market trends
- HPI YoY
- ▲ 13.44%
- Current HPI
- 251.5471
- Rent YoY
- —
- Metro
- —
- State GDP YoY
- ▲ 2.60%
- F500 in state
- 92
Industry mix (Fortune 500 HQ in NY)
| Industry | F500 HQs | Revenue |
|---|---|---|
| Financial Services | 10 | $950B |
|
||
| Consumer Goods | 9 | $162B |
|
||
| Insurance | 4 | $225B |
|
||
| Telecommunications | 2 | $144B |
|
||
| Pharmaceuticals | 2 | $112B |
|
||
| Media / Entertainment | 2 | $69B |
|
||
Price history
+184.8% since first listed2 events — show timeline
- 2026-06-10 Listed $225,000 CNYIS
- 1994-06-09 Sold (Public Records) $79,000 Public Records
Property tax history
+1.6%/yrLatest (2025): $4,345 · +1.7% YoY. Source: county tax records.
Cash-flow waterfall
monthlySold comps — $/sqft
last 12 mo · ≤1 miLoading sold comps…