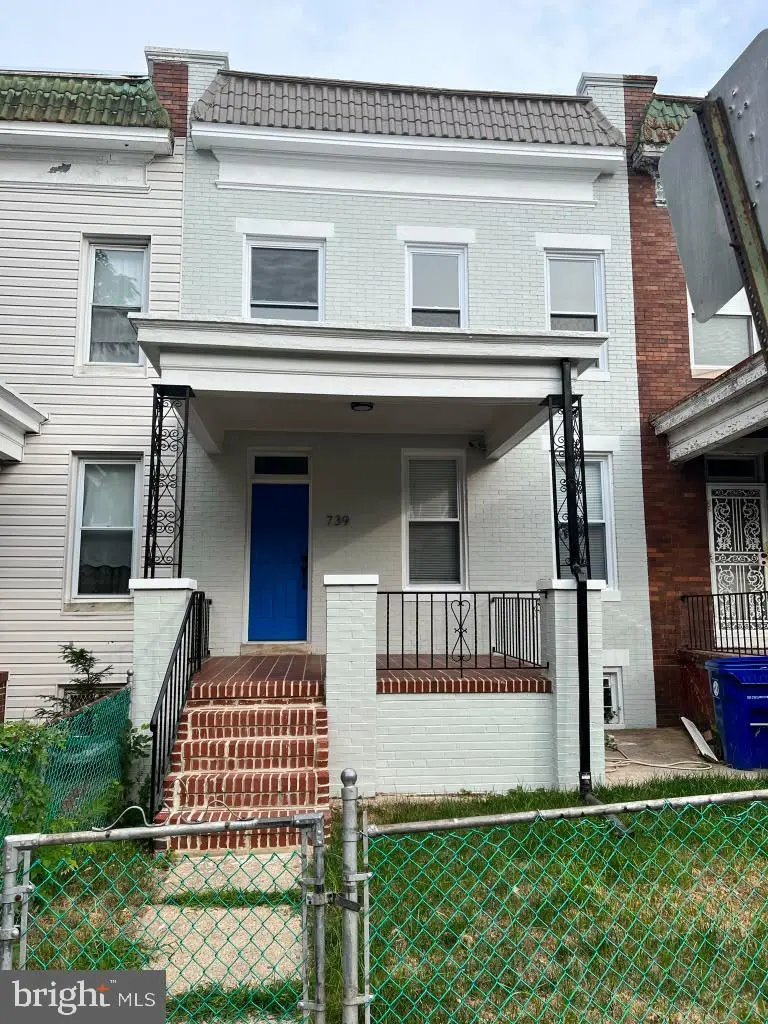
739 Linnard St · Baltimore, MD
Flood risk 1/10 · Minimal
- FEMA flood zone
- X (unshaded)
- Chance of flooding over 30 yrs
- 0.0%
- Est. flood insurance / yr
- $473 – $860
Fire risk 1/10 · Minimal
- Est. fire insurance / yr
- $755 – $1,403
Heat risk 7/10 · Major
- Hot days now (above 103°F)
- 7 days/yr
- Hot days in 30 yrs
- 15 days/yr
Wind risk 5/10 · Moderate
- Chance of severe wind over 30 yrs
- 24.0%
Air-quality risk 3/10 · Minor
- Unhealthy air days now
- 3 days/yr
- Unhealthy air days in 30 yrs
- 4 days/yr
Risk factors via First Street. Map © Google.
Why this score? — see what drove the D- grade
The composite is a weighted blend of 9 inputs, each scored 0–100. Each bar is that input's sub-score; the figure is the points it added to the 100-point composite (weight × sub-score).
- Cash flow +16.5/30.0
- DSCR +5.1/10.0
- 1% rule +4.3/10.0
- Rent growth +3.8/5.0
- Livability +3.8/5.0
- ARV discount +2.8/15.0
- Condition / age +2.5/5.0
- Schools +1.0/10.0
- Appreciation +0.0/10.0
$235,000
🖨 Deal sheet (PDF) 📄 Offer letter ✓ Due diligence
Listing remarks
Welcome to 739 Linnard St!!! This 4 bedroom 2 bath townhome spares no expense. The property was renovated and currently tenant occupied (rented). The moment you walk into the property you will see the attention to details. The main level flows seamlessly into a stylish kitchen featuring soft-close cabinetry, sleek countertops, and stainless steel appliances. Right off the kitchen you can access your private gated-in backyard. Buyers may apply these funds toward closing costs or work with our preferred lender to access a reduced interest rate!!! 739 Linnard St is ready to serve as your investment “ CAPRATE 10.213” or your next home. Reach out to schedule your private tour today!
Key facts
- Stylish kitchen
- Soft-close cabinetry
- Built 1923
Tags
Property features AI
Finance
- Other: Fee simple ownership
Exterior
- Parking: On-street parking
- Utilities: Public water; Public sewer; Natural gas for heating; Electric cooling; 60+ gallon hot water tank
- Home design: Interior townhouse/rowhouse; Above-grade and below-grade finished areas
- Construction: Brick construction; Brick/mortar foundation; Built year recorded by assessor
- Exterior features: Located within city limits; Ground rent paid annually
Interior
- Kitchen: Kitchen (appliances not specified)
- Bedrooms: Four bedrooms on the first upper level
- Bathrooms: Two full bathrooms (one on the first upper level and one on the first lower level)
- Heating & cooling: Central heating; Central air conditioning
- Interior features: Fully finished basement; Living room, Dining room, Kitchen
Neighborhood map
What this means for you Summary
Snapshot
- This is a 4-bed/2.0-bath townhouse listed at $235k.
Deal economics
- At list price, monthly cash flow is $139 ($2k/yr) — positive.
- The deal already cash-flows at list — no discount required.
- To meet the 1% rule (rent ≥ 1% of price), the offer needs to be $219k (7.0% below list).
- Recommended offer: $219k (7.0% below list) — sets the bar for 1% rule.
Location & tenants
- Location reads 76/100 on livability (#90 in MD, #3,396 nationally) — a middle-class / working-renter tenant base. Strengths: amenities A+, commute A+, housing A+; Watch: crime F.
- Baltimore City Public Schools (urban): math 7% / reading 16% proficiency, ranked #24 of 24 in MD (top 100%) — low school quality limits family demand, transient renter base, plan for 1-2y turnover; 79% free/reduced lunch — lower-income household profile, screen leases tightly.
- Zoned schools: Elmer A. Henderson: A Johns Hopkins Partnership (math 2% / reading 16%, grade F, #650 of 860 statewide, top 77%, 642 students, 80% FRL); Vanguard Collegiate Middle (math 3% / reading 15%, grade F, #212 of 225 statewide, top 95%, 343 students, 84% FRL); Baltimore Polytechnic Institute (math 71% / reading 84%, grade A-, #22 of 222 statewide, top 10%, 1,555 students, 43% FRL).
- Zoned-school proficiency averages 32% at this address vs 12% district-wide (+20 pts) — the actual schools serving this property are materially stronger than the Baltimore City Public Schools average implies; a family-tenant draw the district grade alone would hide.
- Market conditions: Rents rising fast (+5.4%/yr); 256 active listings in the ZIP; 31 comparable units currently listed for rent nearby; rentals at typical pace (median 26d on market — plan ~3-4 weeks tenant-placement turnaround); 1,273 units permitted in Baltimore city in 2024 (1,104 in 5+ unit buildings).
- This rent runs 44% of the median local income ($60k/yr) — at the standard rent-burdened threshold; future hikes will face affordability resistance.
Forward outlook
- Local home prices are declining (-3.0%/yr); year-one equity from $2k of loan paydown is wiped out by about $7k of value loss. Plan a longer hold.
- Baltimore County population projected to shrink 4% by 2050 — rents likely to lag national; underwrite the cash flow, not the appreciation.
Negotiation context
- Only 14 days on market — expect competitive offers; lowballing is unlikely to land.
- 10 sale attempts since 24y ago with the ask held roughly flat each time — persistent listings suggest the price (not the market) is what's stuck; bring a comps-based counter.
- Current owner paid $72k; list at $235k implies a 226% gain — meaningful room to come down on a strong offer.
Risks & watch-outs
- Watch-outs: built in 1923 — expect roof / HVAC / electrical / plumbing capex.
- Climate carrying-cost: moderate wind risk, 24% chance of damaging wind over 30y; extreme-heat days projected 7→15/yr by 2055 (HVAC capex compounding) — expect insurance premiums to compound above CPI over the hold.
Questions for the listing agent
- Built in 1923 — when were the roof, HVAC, electrical panel, plumbing, and water heater last replaced?
- Is there a deadline driving the sale (1031 exchange, divorce, estate, relocation)? That informs how much negotiation room exists.
- Schools are D-rated, which usually means shorter tenancies and higher turnover. Who's the typical renter profile here, and what's been the actual vacancy rate?
- Crime grade is F in this area — have there been break-ins, vandalism, or insurance claims at this property in the last 3 years? What carrier currently insures it and at what premium?
- The area grade is low — what's the realistic commute time and amenity access for the typical tenant pool here? Any planned neighborhood developments (good or bad) we should know about?
- What's the average days-on-market for RENTAL listings here right now (not sales)? A rising rental-DOM trend means longer vacancies and softer asking-rent achievability than the comps imply.
- What's the recent tenant-quality profile in this submarket — average credit score on applications, eviction rate, late-payment / NSF rate, and stable-employment percentage? A property-management company in the area should have these aggregated.
- How much new for-sale + rental construction is in the pipeline within 1–3 miles? Heavy new supply typically softens prices + rents 12–24 months out; constrained supply supports both.
Investment metrics
- 1% rule
- 0.93% ✗
- Cap rate
- 7.00%
- Cash-on-cash
- 2.54%
- DSCR
- 1.11
- GRM
- 9.0
CMA / ARV
- ARV (on-the-fly)
- $212,730
- Comps found
- 12
Show comp detail 12 sales within ~0.75 mi
| Address | Dist | Beds/Ba | Sqft | Sold | Price | $/sf | Match |
|---|---|---|---|---|---|---|---|
| 704 Mount Holly St | 0.27mi | 4/3.0 | 2,040 (+1%) | 3mo | $230,000 | $113 | 80 |
| 3410 W Franklin St | 0.23mi | 3/3.0 (-1) | 2,040 (+1%) | 2mo | $213,580 | $105 | 78 |
| 513 Normandy Ave | 0.40mi | 4/2.0 | 2,160 (+7%) | 1mo | $257,000 | $119 | 70 |
| 414 Normandy Ave | 0.45mi | 4/3.5 | 1,976 (-2%) | 1mo | $255,000 | $129 | 68 |
| 405 N Loudon Ave | 0.48mi | 5/2.0 (+1) | 1,896 (-6%) | 2mo | $175,000 | $92 | 60 |
| 635 N Rosedale St | 0.36mi | 3/3.5 (-1) | 1,867 (-8%) | 3mo | $230,000 | $123 | 56 |
| 3304 Brighton St | 0.63mi | 3/1.5 (-1) | 1,908 (-6%) | 2mo | $155,000 | $81 | 52 |
| 900 N Franklintown Rd | 0.42mi | 3/2.0 (-1) | 1,764 (-13%) | 3mo | $80,000 | $45 | 52 |
| 120 Allendale St | 0.47mi | 3/2.0 (-1) | 1,728 (-15%) | 2mo | $225,000 | $130 | 47 |
| 3118 Normount Ave | 0.53mi | 3/2.0 (-1) | 1,725 (-15%) | 1mo | $174,990 | $101 | 45 |
| 2738 W Mosher St | 0.70mi | 3/1.0 (-1) | 1,765 (-13%) | 1mo | $37,000 | $21 | 36 |
| 2732 Riggs Ave | 0.73mi | 3/1.0 (-1) | 1,730 (-15%) | 2mo | $135,000 | $78 | 31 |
Match score weights: distance 35% · size 25% · config 20% · recency 20%. Top-matched comps best support the ARV.
Projected returns pro-forma
-3.0% appreciation · 5.38% rent growth · sell at horizon
- IRR
- -9.7%
- Equity multiple
- 0.64×
- Total profit
- $-23,832
- Equity at exit
- $35,039
- IRR
- 2.6%
- Equity multiple
- 1.21×
- Total profit
- $13,815
- Equity at exit
- $20,319
Cash invested: $65,800 (down + closing). Projections, not guarantees.
Landlord ↔ Tenant lean methodology
- Overall (CITY)
- 12 Strongly Tenant-Friendly
- State Maryland
- 27 Tenant-Leaning · D+14
- County
- — inherits STATE
- City Baltimore
- 12 Strongly Tenant-Friendly · D+58
ZIP-level market 21229
- Rents YoY
- 5.4%
- Active inventory
- 256
- Price-to-rent
- 9.0×
Monthly cashflow live
- Estimated rent
- $2,186 high interval (Pro) →
- Mortgage (P&I)
- −$1,232
- Tax from tax record
- −$257 /mo · $3,089/yr
- Insurance
- −$98
- HOA
- −$0
- Vacancy / Maint / Mgmt
- −$459
- Net cashflow
- $139
Break-even live
Sensitivity live
| Price | -10% $272 | -5% $206 | +0% $139 | +5% $73 | +10% $6 |
|---|---|---|---|---|---|
| Rent | -10% $-33 | -5% $53 | +0% $139 | +5% $226 | +10% $312 |
| Rate | -1.0pp $258 | -0.5pp $199 | base $139 | +0.5pp $79 | +1.0pp $17 |
UW: 25.0% down · 7.5% · 30yr · 1.5% tax · 5.0% vac · 8.0% maint · 8.0% mgmt
Financing live
Cash to close
- Down payment
- $58,750
- Closing costs
- $7,050
- Reserves months
- —
- Total cash needed
- —
Loan-product check · same deal, 3 products live
Conventional
25% down · 7.5% · 30yr
- Down + closing
- —
- Monthly P&I
- —
- Monthly cashflow
- —
- DSCR
- —
- Eligible?
- —
Personal DTI + credit; lowest rate.
DSCR
20% down · 8.5% · 30yr
- Down + closing
- —
- Monthly P&I
- —
- Monthly cashflow
- —
- DSCR
- —
- Eligible?
- —
No personal income docs; deal must DSCR.
Hard money
10% down · 12.0% · 12mo
- Down + closing
- —
- Monthly P&I
- —
- Monthly cashflow
- —
- DSCR
- —
- Eligible?
- —
Short-term bridge; refi at stabilization.
Rent comps 31 comps
| Address | Beds | Baths | Sqft | Rent | $/sqft | DOM | Units | Dist |
|---|---|---|---|---|---|---|---|---|
| 3324 Edmondson Ave Baltimore, MD | 3.0 | 2.5 | 2300 | $1,995 | $0.87 | 23d | 1 | 0.14mi |
| 3507 Edmondson Ave Baltimore, MD | 4.0 | 2.0 | 1428 | $2,300 | $1.61 | 45d | 1 | 0.16mi |
| 3619 Edmondson Ave Baltimore, MD | 4.0 | 3.5 | 1962 | $2,800 | $1.43 | 45d | 1 | 0.22mi |
| 3700 Woodridge Rd Baltimore, MD | 3.0 | 1.5 | 1955 | $1,950 | $1.00 | 45d | 1 | 0.24mi |
| 405 N Edgewood St Baltimore, MD | 4.0 | 2.0 | 1408 | $2,750 | $1.95 | 0d | 1 | 0.27mi |
| 715 N Rosedale St Baltimore, MD | 5.0 | 3.0 | 1542 | $2,550 | $1.65 | 45d | 1 | 0.37mi |
| 202 N Edgewood St Baltimore, MD | 3.0 | 2.0 | 1710 | $2,250 | $1.32 | 25d | 1 | 0.38mi |
| 409 Normandy Ave Baltimore, MD | 4.0 | 1.0 | 1640 | $1,500 | $0.91 | 25d | 1 | 0.43mi |
| 2922 Edmondson Ave Baltimore, MD | 3.0 | 2.0 | 1620 | $1,900 | $1.17 | 45d | 1 | 0.51mi |
| 4113 Mountwood Rd Baltimore, MD | 3.0 | 1.0 | 1520 | $1,795 | $1.18 | 45d | 1 | 0.61mi |
| 1513 N Ellamont St Baltimore, MD | 3.0 | 1.0 | 1700 | $1,700 | $1.00 | 25d | 1 | 0.66mi |
| 2806 Riggs Ave Baltimore, MD | 3.0 | 2.5 | 1412 | $1,900 | $1.35 | 5d | 1 | 0.68mi |
| 2744 W Mosher St Baltimore, MD | 4.0 | 2.0 | 1412 | $2,100 | $1.49 | 25d | 1 | 0.69mi |
| 1530 N Rosedale St Baltimore, MD | 3.0 | 2.0 | 1641 | $1,795 | $1.09 | 0d | 1 | 0.72mi |
| 1402 Poplar Grove St Baltimore, MD | 4.0 | 1.5 | 1540 | $800 | $0.52 | 45d | 1 | 0.73mi |
| 2732 Riggs Ave Baltimore, MD | 3.0 | 1.0 | 1730 | $1,700 | $0.98 | 0d | 1 | 0.73mi |
| 1633 N Hilton St Baltimore, MD | 4.0 | 2.5 | 1920 | $2,600 | $1.35 | 19d | 1 | 0.76mi |
| 2800 Presstman St Baltimore, MD | 3.0 | 2.5 | 1460 | $1,799 | $1.23 | 25d | 1 | 0.85mi |
| 117 Collins Ave Baltimore, MD | 3.0 | 3.0 | 1617 | $2,350 | $1.45 | 45d | 1 | 0.90mi |
| 2103 Chelsea Ter Unit 2 Baltimore, MD | 3.0 | 1.5 | 1500 | $2,100 | $1.40 | 16d | 1 | 1.10mi |
| 2917 Clifton Ave Baltimore, MD | 4.0 | 4.0 | 1700 | $2,150 | $1.26 | 25d | 1 | 1.13mi |
| 918 N Bentalou St Baltimore, MD | 3.0 | 1.5 | 1485 | $1,750 | $1.18 | 45d | 1 | 1.16mi |
| 3030 Windsor Ave Baltimore, MD | 4.0 | 1.5 | 2124 | $1,995 | $0.94 | 6d | 1 | 1.18mi |
| 2812 Clifton Ave Baltimore, MD | 3.0 | 1.5 | 1650 | $1,850 | $1.12 | 45d | 1 | 1.21mi |
| 39 N Bentalou St Baltimore, MD | 3.0 | 2.5 | 1844 | $1,700 | $0.92 | 4d | 1 | 1.29mi |
| 3904 Gwynns Falls Pkwy Baltimore, MD | 3.0 | 2.0 | 1772 | $2,600 | $1.47 | 45d | 1 | 1.31mi |
| 2405 W North Ave Baltimore, MD | 4.0 | 3.0 | 1826 | $1,900 | $1.04 | 6d | 1 | 1.36mi |
| 2401 W North Ave Baltimore, MD | 5.0 | 2.0 | 2037 | $1,800 | $0.88 | 6d | 1 | 1.36mi |
| 2 S Tremont Rd Baltimore, MD | 3.0 | 2.0 | 1450 | $1,800 | $1.24 | 12d | 1 | 1.39mi |
| 2 S Tremont Rd Baltimore, MD | 3.0 | 2.0 | 1450 | $1,800 | $1.24 | 25d | 1 | 1.39mi |
| 3414 Alto Rd Unit 2ND Baltimore, MD | 3.0 | 1.0 | 2824 | $2,000 | $0.71 | 25d | 1 | 1.48mi |
Listing history 9 events
-
2026-06-21days on market $235,000 Active 14 DOM
-
2026-06-18days on market $235,000 Active 11 DOM
-
2026-06-17days on market $235,000 Active 10 DOM
-
2026-06-16days on market $235,000 Active 9 DOM
-
2026-06-15days on market $235,000 Active 8 DOM
-
2026-06-13days on market $235,000 Active 6 DOM
-
2026-06-09days on market $235,000 Active 2 DOM
-
2026-06-08remarks 686-char remark
-
2026-06-08$235,000 Active 1 DOM
ⓘ Source: listings_history table (triggers on properties + properties_extension) + one-shot
backfill from property_details.listing_events for pre-trigger history.
Tax reassessment forecast MD · Partial reset (capped growth)
- Current annual tax
- $3,089 · $257/mo
- Projected year-2 tax
- $3,089 · $257/mo
- Expected delta
- $0/yr ($0/mo · 0.0%)
ⓘ Screening estimate from a state-policy table — verify with the county assessor before closing.
Climate risk First Street
- Flood 1/10 Low FEMA zone X (unshaded) · 0% chance over 30 yrs
- Wildfire 1/10 Low
- Heat 7/10 Severe 7 d/yr ≥103°F today · 15 d/yr by 30 yrs out
- Wind 5/10 Major 24% chance of damaging wind over 30 yrs
- Air quality 3/10 Moderate 3 unhealthy d/yr today · 4 by 30 yrs out
Nearby sold comps map
Loading sold comps map…
Walkable amenities ~0.75 mi
Loading nearby amenities…
Taxation est. · year 1
- Rental income
- $26,234
- − Mortgage interest
- −$13,164
- − Property taxes
- −$3,089
- − Insurance
- −$1,175
- − Repairs & maintenance
- −$2,099
- − Management
- −$2,099
- − Depreciation
- −$6,836
- Taxable loss
- −$2,227
- Est. tax savings @ 24.0%
- +$535
- After-tax cash flow
- $2,207/yr
For passive investors: Depreciation is non-cash, so a rental often shows a tax loss while cash-flowing — sheltering income. Rental losses are passive: they offset passive income freely, and up to $25,000/yr can offset ordinary (W-2) income if you actively participate and your MAGI is under $100k (phasing out to $0 by $150k); unused losses carry forward. On sale, claimed depreciation is recaptured at up to 25%, and gains may owe capital-gains tax (a 1031 exchange can defer both). Figures are a year-1 estimate at your 24.0% rate — not tax advice; consult a CPA.
Schools (NCES district)
- District
- Baltimore City Public Schools
- NCES district ID
- 2400090
- Math proficiency
- 7% ▼ -9.00%
- Reading proficiency
- 16% ▼ -5.00%
- Median HH income
- $42,108
- Composite
- 10.08/100
- National rank
- #9805
- State rank
- #24 of 24 in MD
Livability — Baltimore
- Score
- 76/100
- State rank
- #90
- US rank
- #3396
Category grades
Schools grade is shown separately in the Schools card above.
Census & demographics
- Census place
- Baltimore, MD
- County
- Baltimore City · 558,601 people
- City population
- 588,727
- Metro
- Baltimore-Columbia-Towson, MD
- Population (ZIP)
- 46,679
- Household income
- $60,047
- Rent vs Own
- Severe rent burden
- 2776.0
Population outlook (Baltimore County) Hauer SSP2
- Today (2025)
- 624,249 people
- By 2030
- 621,541 · -0.4%
- By 2040
- 609,756 · -2.3%
- By 2050
- 597,249 · -4.3%
- By 2075
- 552,236 · -11.5%
- By 2100
- 513,934 · -17.7%
Race, ethnicity, and origin ACS 2023
- Neighborhood character
- Predominantly Black (73%)
- Race & ethnicity
- Black 73% White 15% Hispanic / Latino 6% Two or more races 4% Asian 3%
- Hispanic origin (detail)
- Common ancestry
- Lithuanian 1% Romanian 1% Serbian 1%
- Foreign-born
- 5% · Canada, Philippines
- Languages at home
- 91% English-only · Spanish 4% Other Indo-European 2% Other Asian/Pacific 1%
Political lean MEDSL · Baltimore
- 2024 margin
- Solid D (+73.0) · D 85.2% · R 12.2% · Other 2.6%
- 2008→2024 swing
- -2.5pp toward R · 2008: 75.5pp · 2024: 73.0pp
- All cycles
- 2024: D+73.0 2020: D+76.6 2016: D+74.6 2012: D+76.4 2008: D+75.5
Not yet ingested
- Civics
- —
Market trends
- HPI YoY
- ▼ -259.07%
- Current HPI
- 226.896
- Rent YoY
- ▲ 5.38%
- Metro
- Baltimore-Columbia-Towson, MD
- State GDP YoY
- ▲ 2.97%
- F500 in state
- 12
Industry mix (Fortune 500 HQ in MD)
| Industry | F500 HQs | Revenue |
|---|---|---|
| Aerospace / Defense | 1 | $71B |
|
||
| Utilities | 1 | $25B |
|
||
| Hotels | 1 | $24B |
|
||
| Consumer Goods | 1 | $7B |
|
||
| Real Estate | 1 | $6B |
|
||
| Chemicals | 1 | $2B |
|
||
Price history
+422.2% since first listed23 events — show timeline
- 2026-06-07 Listed $235,000 BRIGHT MLS
- 2025-12-05 Listing Removed — BRIGHT MLS
- 2025-11-22 Rental Removed $2,000 BRIGHTMLS
- 2025-10-31 Listed for Rent $2,000 BRIGHTMLS
- 2025-08-25 Listed $220,000 BRIGHT MLS
- 2024-04-11 Listing Removed — BRIGHT MLS
- 2024-01-24 Price Changed $220,000 BRIGHT MLS
- 2024-01-24 Relisted — BRIGHT MLS
- 2023-11-28 Listing Removed — BRIGHT MLS
- 2023-11-06 Listed $230,000 BRIGHT MLS
- 2022-10-21 Listing Removed — BRIGHT MLS
- 2022-07-16 Listed $230,000 BRIGHT MLS
- 2022-02-25 Sold (Public Records) $72,000 Public Records
- 2021-09-29 Listing Removed — BRIGHT MLS
- 2021-09-01 Listed $84,500 BRIGHT MLS
- 2005-11-17 Delisted — MRIS
- 2005-11-11 Listed — MRIS
- 2004-09-04 Delisted — MRIS
- 2004-04-26 Listed — MRIS
- 2002-12-06 Sold (Public Records) $44,000 Public Records
- 2002-10-24 Sold (MLS) $44,000 MRIS
- 2002-07-10 Listed $45,000 MRIS
- 2002-07-10 Delisted — MRIS
Property tax history
+3.9%/yrLatest (2025): $3,089 · +17.8% YoY. Source: county tax records.
Cash-flow waterfall
monthlySold comps — $/sqft
last 12 mo · ≤1 miLoading sold comps…