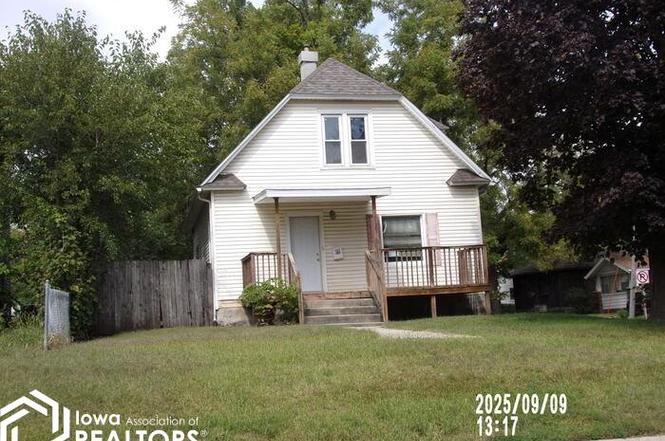
1930 2nd Ave N · Fort Dodge, IA
Flood risk 1/10 · Minimal
- FEMA flood zone
- X (unshaded)
- Chance of flooding over 30 yrs
- 0.0%
- Est. flood insurance / yr
- $473 – $860
Fire risk 3/10 · Minor
- Est. fire insurance / yr
- $902 – $1,676
Heat risk 2/10 · Minimal
- Hot days now (above 101°F)
- 7 days/yr
- Hot days in 30 yrs
- 16 days/yr
Wind risk 2/10 · Minimal
- Chance of severe wind over 30 yrs
- —
Air-quality risk 1/10 · Minimal
- Unhealthy air days now
- 0 days/yr
- Unhealthy air days in 30 yrs
- 0 days/yr
Risk factors via First Street. Map © Google.
Why this score? — see what drove the B grade
The composite is a weighted blend of 9 inputs, each scored 0–100. Each bar is that input's sub-score; the figure is the points it added to the 100-point composite (weight × sub-score).
- Cash flow +30.0/30.0
- 1% rule +10.0/10.0
- DSCR +10.0/10.0
- ARV discount +7.5/15.0
- Schools +4.1/10.0
- Livability +3.6/5.0
- Rent growth +2.5/5.0
- Condition / age +2.5/5.0
- Appreciation +0.0/10.0
$52,900
🖨 Deal sheet 📄 Offer letter ✓ Due diligence
Listing remarks
This 3 bedroom 2 bath home is located on a corner lot with a fenced in rear yard. The home includes a new roof as well as all new flooring and ready for your finishing touches! This property is now active in an online auction. All offers must be submitted through the property’s listing page on www. auction.com. The sale will be subject to a 5% buyer’s premium pursuant to the Auction Terms and Conditions (minimums may apply). All auction bids will be processed subject to seller approval. Online bidding will begin on 4/19/2026
Key facts
- New flooring
- Fenced in rear yard
- Corner lot
Tags
Property features AI
Exterior
- Parking: Carport
- Utilities: Public water; Public sewer
- Home design: Single-family residential property
- Construction: Vinyl siding
- Exterior features: Lot dimensions roughly 46 x 141 (0.15 acres); Corner lot
Interior
- Bathrooms: 2 full bathrooms
- Heating & cooling: Central air conditioning; Forced air heating
- Interior features: Basement
Neighborhood map
What this means for you Summary
Snapshot
- This is a 3-bed/1.0-bath single-family listed at $53k.
Deal economics
- At list price, monthly cash flow is $304 ($4k/yr) — positive.
- The deal already cash-flows at list — no discount required.
- Meets the 1% rule at list price ($895 rent vs $53k).
- Recommended offer: $47k (12.0% below list) — sets the bar for market timing.
Location & tenants
- Location reads 71/100 on livability (#348 in IA) — a middle-class / working-renter tenant base. Strengths: cost of living A+, housing A+, health & safety A+; Watch: employment D+, crime F, amenities D-.
- Fort Dodge Community School District (town): math 44% / reading 53% proficiency, ranked #285 of 289 in IA (top 99%) — families likely to look elsewhere, expect single-tenant / working-renter base with shorter leases.
- Market conditions: 36 active listings in the ZIP; 6 comparable units currently listed for rent nearby; rentals lingering (median 44d on market — plan ~5-8 weeks vacancy on turnover, expect pricing pressure); 100% of comp listings sitting > 30 days — soft ceiling on asking rent; 25 units permitted in Webster County in 2024 (0 in 5+ unit buildings).
- This rent is only 16% of the median local income ($67k/yr) — well below the 30% rent-burden line; pricing power to push rent on renewal without tenant pushback.
Forward outlook
- Local home prices are declining (-3.0%/yr); year-one equity from $366 of loan paydown is wiped out by about $2k of value loss. Plan a longer hold.
- Webster County population projected to shrink 7% by 2050 — rents likely to lag national; underwrite the cash flow, not the appreciation.
- At projected returns (-3.0% appreciation + 3.0% rent growth), your $15k cash investment doubles in ~5 years — after that, you're playing with house money.
Negotiation context
- It's been on market 200 days — a 12% lower offer ($47k) is reasonable based on typical stale-listing flexibility.
Risks & watch-outs
- Watch-outs: built in 1910 — expect roof / HVAC / electrical / plumbing capex.
Questions for the listing agent
- It's been on market 200 days. Have you received any prior offers? Is the seller open to a 12% concession, seller financing, or rate buy-down credit?
- Built in 1910 — when were the roof, HVAC, electrical panel, plumbing, and water heater last replaced?
- Why hasn't it sold? Are there any deal-killer items the seller is aware of (foundation, flood, title, zoning, code violations)?
- Is there a deadline driving the sale (1031 exchange, divorce, estate, relocation)? That informs how much negotiation room exists.
- Schools are B-rated — typically a magnet for longer-tenancy family renters. What's the average tenant stay here, and is there a school-zone premium baked into asking?
- Crime grade is F in this area — have there been break-ins, vandalism, or insurance claims at this property in the last 3 years? What carrier currently insures it and at what premium?
- What's the average days-on-market for RENTAL listings here right now (not sales)? A rising rental-DOM trend means longer vacancies and softer asking-rent achievability than the comps imply.
- What's the recent tenant-quality profile in this submarket — average credit score on applications, eviction rate, late-payment / NSF rate, and stable-employment percentage? A property-management company in the area should have these aggregated.
- How much new for-sale + rental construction is in the pipeline within 1–3 miles? Heavy new supply typically softens prices + rents 12–24 months out; constrained supply supports both.
Investment metrics
- 1% rule
- 1.69% ✓
- Cap rate
- 13.20%
- Cash-on-cash
- 24.66%
- DSCR
- 2.10
- GRM
- 4.9
CMA / ARV
- ARV (on-the-fly)
- $153,870
- Comps found
- 2
Show comp detail 2 sales within ~0.75 mi
| Address | Dist | Beds/Ba | Sqft | Sold | Price | $/sf | Match |
|---|---|---|---|---|---|---|---|
| 2009 6th Ave N | 0.23mi | 3/1.0 | 1,114 (-0%) | 19mo | $89,900 | $81 | 73 |
| 1655 Elmhurst Avenue Ave | 0.60mi | 3/2.0 | 1,267 (+14%) | 2mo | $174,900 | $138 | 44 |
Match score weights: distance 35% · size 25% · config 20% · recency 20%. Top-matched comps best support the ARV.
Projected returns pro-forma
-3.0% appreciation · 3.0% rent growth · sell at horizon
- IRR
- 18.1%
- Equity multiple
- 1.73×
- Total profit
- $10,848
- Equity at exit
- $7,888
- IRR
- 26.5%
- Equity multiple
- 3.33×
- Total profit
- $34,554
- Equity at exit
- $4,574
Cash invested: $14,812 (down + closing). Projections, not guarantees.
Landlord ↔ Tenant lean methodology
- Overall (STATE)
- 83 Strongly Landlord-Friendly
- State Iowa
- 83 Strongly Landlord-Friendly · R+6
- County
- — inherits STATE
- City
- — inherits STATE
ZIP-level market 50501
- Home prices YoY
- -33.1%
- Active inventory
- 36
- Price-to-rent
- 4.9×
Monthly cashflow live
- Estimated rent
- $895 high interval (Pro) →
- Mortgage (P&I)
- −$277
- Tax from tax record
- −$103 /mo · $1,241/yr
- Insurance
- −$22
- HOA
- −$0
- Vacancy / Maint / Mgmt
- −$188
- Net cashflow
- $304
Break-even live
UW: 25.0% down · 7.5% · 30yr · 1.5% tax · 5.0% vac · 8.0% maint · 8.0% mgmt
Financing live
Cash to close
- Down payment
- $13,225
- Closing costs
- $1,587
- Reserves months
- —
- Total cash needed
- —
Loan-product check · same deal, 3 products live
Conventional
25% down · 7.5% · 30yr
- Down + closing
- —
- Monthly P&I
- —
- Monthly cashflow
- —
- DSCR
- —
- Eligible?
- —
Personal DTI + credit; lowest rate.
DSCR
20% down · 8.5% · 30yr
- Down + closing
- —
- Monthly P&I
- —
- Monthly cashflow
- —
- DSCR
- —
- Eligible?
- —
No personal income docs; deal must DSCR.
Hard money
10% down · 12.0% · 12mo
- Down + closing
- —
- Monthly P&I
- —
- Monthly cashflow
- —
- DSCR
- —
- Eligible?
- —
Short-term bridge; refi at stabilization.
Rent comps 6 comps
| Address | Beds | Baths | Sqft | Rent | $/sqft | DOM | Units | Dist |
|---|---|---|---|---|---|---|---|---|
| 2026 2nd Ave N Fort Dodge, IA | 2.0 | 1.0 | 804 | $875 | $1.09 | 44d | 1 | 0.06mi |
| 1626 4th Ave S Fort Dodge, IA | 2.0 | 1.0 | 960 | $825 | $0.86 | 44d | 1 | 0.51mi |
| 436 N 27th St Unit 436-3 Fort Dodge, IA | 2.0 | 1.0 | 700 | $625 | $0.89 | 44d | 1 | 0.53mi |
| 1020 Central Ave Unit 1020-06 Fort Dodge, IA | 2.0 | 1.0 | 900 | $625 | $0.69 | 44d | 1 | 0.71mi |
| 3039 Dodger Dr Unit 2905-411 Fort Dodge, IA | 2.0 | 1.0 | 1035 | $1,175 | $1.14 | 44d | 1 | 0.84mi |
| 516 Central Ave Unit 516 Fort Dodge, IA | 2.0 | 1.0 | 900 | $675 | $0.75 | 44d | 1 | 1.04mi |
Listing history 10 events
-
2026-04-14status Pending
-
2026-03-09price $52,900
-
2026-02-12price $57,900
-
2026-01-12price $62,900
-
2025-12-11price $67,900
-
2025-11-10price $74,900
-
2025-09-26$82,500 Active
-
2019-08-30soldstatus $53,000
-
2019-08-30soldstatus $53,000
-
2014-01-23soldstatus $55,000
ⓘ Source: listings_history table (triggers on properties + properties_extension) + one-shot
backfill from property_details.listing_events for pre-trigger history.
Tax reassessment forecast IA · Partial reset (capped growth)
- Current annual tax
- $1,241 · $103/mo
- Projected year-2 tax
- $1,241 · $103/mo
- Expected delta
- $0/yr ($0/mo · 0.0%)
ⓘ Screening estimate from a state-policy table — verify with the county assessor before closing.
Climate risk First Street
- Flood 1/10 Low FEMA zone X (unshaded) · 0% chance over 30 yrs
- Wildfire 3/10 Moderate
- Heat 2/10 Low 7 d/yr ≥101°F today · 16 d/yr by 30 yrs out
- Wind 2/10 Low
- Air quality 1/10 Low 0 unhealthy d/yr today · 0 by 30 yrs out
Nearby sold comps map
Loading sold comps map…
Walkable amenities ~0.75 mi
Loading nearby amenities…
Taxation est. · year 1
- Rental income
- $10,743
- − Mortgage interest
- −$2,963
- − Property taxes
- −$1,241
- − Insurance
- −$264
- − Repairs & maintenance
- −$859
- − Management
- −$859
- − Depreciation
- −$1,539
- Taxable income
- $3,016
- Est. tax owed @ 24.0%
- −$724
- After-tax cash flow
- $2,928/yr
For passive investors: Depreciation is non-cash, so a rental often shows a tax loss while cash-flowing — sheltering income. Rental losses are passive: they offset passive income freely, and up to $25,000/yr can offset ordinary (W-2) income if you actively participate and your MAGI is under $100k (phasing out to $0 by $150k); unused losses carry forward. On sale, claimed depreciation is recaptured at up to 25%, and gains may owe capital-gains tax (a 1031 exchange can defer both). Figures are a year-1 estimate at your 24.0% rate — not tax advice; consult a CPA.
Schools (NCES district)
- District
- Fort Dodge Community School District
- NCES district ID
- 1911820
- Math proficiency
- 44% ▼ -3.00%
- Reading proficiency
- 53% ▼ -2.00%
- Median HH income
- $39,807
- Composite
- 40.54/100
- National rank
- #3700
- State rank
- #285 of 289 in IA
Livability — Fort Dodge
- Score
- 71/100
- State rank
- #348
- US rank
- #7116
Category grades
Schools grade is shown separately in the Schools card above.
Census & demographics
- Census place
- Fort Dodge, IA
- County
- Webster County · 28,823 people
- City population
- 28,823
- Metro
- Fort Dodge, IA
- Population (ZIP)
- 28,823
- Household income
- $66,888
- Rent vs Own
- Severe rent burden
- 673.0
Population outlook (Webster County) Hauer SSP2
- Today (2025)
- 35,895 people
- By 2030
- 35,334 · -1.6%
- By 2040
- 34,073 · -5.1%
- By 2050
- 33,264 · -7.3%
- By 2075
- 32,560 · -9.3%
- By 2100
- 30,786 · -14.2%
Race, ethnicity, and origin ACS 2023
- Neighborhood character
- Predominantly White (82%)
- Race & ethnicity
- White 82% Two or more races 8% Hispanic / Latino 7% Black 4% Asian 1%
- Hispanic origin (detail)
- Mexican 4%
- Common ancestry
- Portuguese 7% Slovak 2% Iranian 1%
- Foreign-born
- 4% · Canada, South Korea, China
- Languages at home
- 93% English-only · Spanish 4% German/W. Germanic 1% French/Haitian/Cajun 0%
Political lean MEDSL · Webster
- 2024 margin
- Solid R (+31.2) · D 33.8% · R 65.0% · Other 1.3%
- 2008→2024 swing
- -39.7pp toward R · 2008: 8.5pp · 2024: -31.2pp
- All cycles
- 2024: R+31.2 2020: R+24.3 2016: R+21.8 2012: D+5.5 2008: D+8.5
Not yet ingested
- Civics
- —
Market trends
- HPI YoY
- ▼ -95.63%
- Current HPI
- 193.5846
- Rent YoY
- —
- Metro
- Fort Dodge, IA
- State GDP YoY
- ▲ 2.48%
- F500 in state
- 4
Industry mix (Fortune 500 HQ in IA)
| Industry | F500 HQs | Revenue |
|---|---|---|
| Financial Services | 1 | $16B |
|
||
| Retail / Convenience | 1 | $15B |
|
||
Price history
-3.8% since first listed10 events — show timeline
- 2026-04-14 Pending — IAR
- 2026-03-09 Price Changed $52,900 IAR
- 2026-02-12 Price Changed $57,900 IAR
- 2026-01-12 Price Changed $62,900 IAR
- 2025-12-11 Price Changed $67,900 IAR
- 2025-11-10 Price Changed $74,900 IAR
- 2025-09-26 Listed $82,500 IAR
- 2019-08-30 Sold (Public Records) $53,000 Public Records
- 2019-08-30 Sold (Public Records) $53,000 Public Records
- 2014-01-23 Sold (Public Records) $55,000 Public Records
Property tax history
+4.4%/yrLatest (2025): $1,241 · +8.7% YoY. Source: county tax records.
Cash-flow waterfall
monthlySold comps — $/sqft
last 12 mo · ≤1 miLoading sold comps…