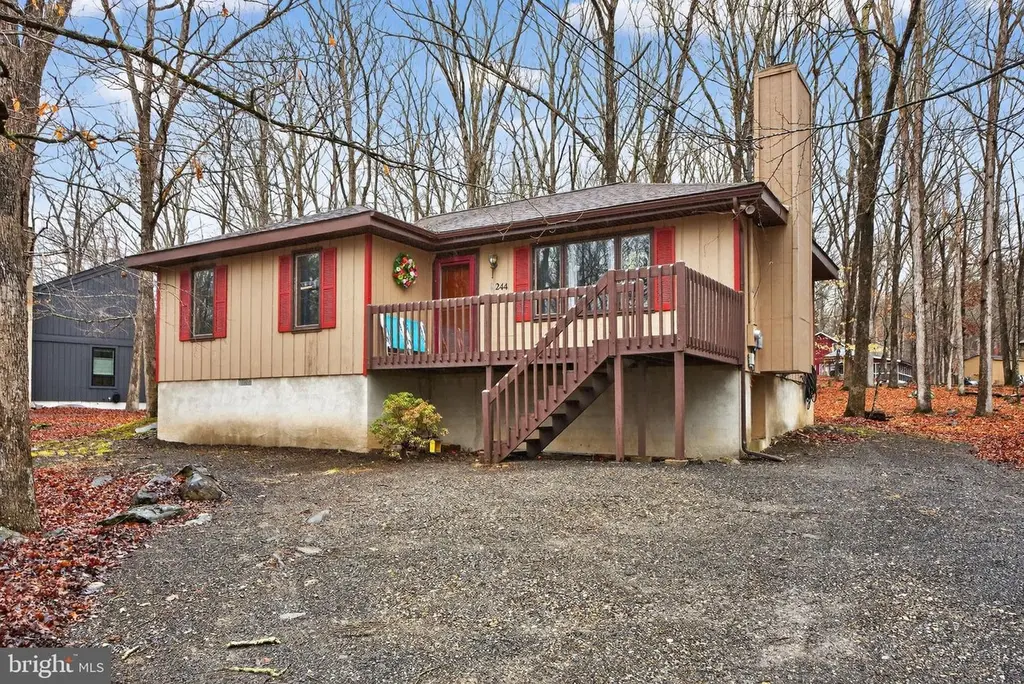
244 Canterbury Rd · Saw Creek, PA
Flood risk 1/10 · Minimal
- FEMA flood zone
- X (unshaded)
- Chance of flooding over 30 yrs
- 0.0%
- Est. flood insurance / yr
- $473 – $860
Fire risk 4/10 · Minor
- Est. fire insurance / yr
- $511 – $949
Heat risk 3/10 · Minor
- Hot days now (above 95°F)
- 7 days/yr
- Hot days in 30 yrs
- 15 days/yr
Wind risk 4/10 · Minor
- Chance of severe wind over 30 yrs
- 8.0%
Air-quality risk 2/10 · Minimal
- Unhealthy air days now
- 1 days/yr
- Unhealthy air days in 30 yrs
- 2 days/yr
Risk factors via First Street. Map © Google.
Why this score? — see what drove the D+ grade
The composite is a weighted blend of 9 inputs, each scored 0–100. Each bar is that input's sub-score; the figure is the points it added to the 100-point composite (weight × sub-score).
- Cash flow +17.3/30.0
- Appreciation +6.8/10.0
- 1% rule +6.1/10.0
- DSCR +5.4/10.0
- Schools +3.0/10.0
- Livability +3.0/5.0
- Rent growth +2.5/5.0
- Condition / age +2.5/5.0
- ARV discount +2.2/15.0
$199,000
🖨 Deal sheet (PDF) 📄 Offer letter ✓ Due diligence
Listing remarks
Tranquil 3-Bedroom Retreat in Saw Creek Estates – Your Pocono Escape Welcome to this charming 3-bedroom, 1-bath raised ranch nestled in the heart of the scenic Saw Creek Estates community in the Pocono Mountains. Situated on a large, flat lot, this home offers the perfect blend of modern updates, comfort, and natural surroundings. Recent improvements provide added peace of mind, including a newer roof (2021) and a brand-new hot water heater (2024). The freshly painted decks (2025) create an inviting outdoor space—perfect for relaxing, entertaining, or simply enjoying the peaceful wooded setting. This home is being sold partially furnished, making it an easy move-in or turnkey ge
Key facts
- 0.33 acre lot
- Community pool
- Built 1989
Property features AI
Finance
- HOA & community: HOA fee approximately $1,972 annually; Property managed by a property manager
Exterior
- Parking: Driveway
- Utilities: Public water; Private sewer; Electric hot water
- Home design: Detached structure; Above-grade living space (approximately 1,000 finished)
- Construction: Stick-built construction; Block foundation; Architectural shingle roof
- Exterior features: Deck(s); Community pool; No tidal water
Interior
- Bedrooms: Three bedrooms on the main level
- Bathrooms: One full bathroom on the main level
- Heating & cooling: Electric baseboard heating; Ceiling fans; Window air conditioning units
- Interior features: Estimated living area; Main-floor laundry; Wood-burning fireplace
- Laundry & utility: Main-floor laundry
Neighborhood map
What this means for you Summary
Snapshot
- This is a 3-bed/1.0-bath single-family listed at $199k.
Deal economics
- At list price, monthly cash flow is $147 ($2k/yr) — positive.
- The deal already cash-flows at list — no discount required.
- Meets the 1% rule at list price ($2k rent vs $199k).
- Recommended offer: $196k (1.5% below list) — sets the bar for market timing.
- Cap rate 7.2% vs local median 4.5% in Saw Creek — top-decile yield for the area; either an underpriced asset or a hidden risk that comps aren't pricing in. Stress-test before assuming the spread holds.
Location & tenants
- Location reads 59/100 on livability (#1,538 in PA) — a working-class tenant base; expect higher turnover. Strengths: crime A+, cost of living A+, housing A+; Watch: employment C-, health & safety D, amenities F.
- East Stroudsburg Area SD (rural): math 25% / reading 43% proficiency, ranked #413 of 539 in PA (top 77%) — families likely to look elsewhere, expect single-tenant / working-renter base with shorter leases.
- Zoned schools: Middle Smithfield El Sch (math 22% / reading 47%, grade F, #1,049 of 1,518 statewide, top 71%, 429 students, 66% FRL); Lehman Intermediate Sch (math 11% / reading 44%, grade F, #399 of 512 statewide, top 79%, 603 students, 59% FRL); East Stroudsburg Shs North (math 29% / reading 24%, grade F, #371 of 437 statewide, top 85%, 940 students, 54% FRL) — zoned schools average 60% FRL vs 42% district-wide (18 pts higher); higher-poverty schools than district average — tighter screening recommended.
- Market conditions: 293 active listings in the ZIP; 1 comparable units currently listed for rent nearby; 213 units permitted in Pike County in 2024 (0 in 5+ unit buildings).
Forward outlook
- In year one you build about $8k of equity ($1k loan paydown + $7k appreciation (3.5% local appreciation)).
- Pike County population projected at -25% by 2050 — secular population decline; favor cash flow + early exit over multi-decade hold.
- At projected returns (3.5% appreciation + 3.0% rent growth), your $56k cash investment doubles in ~5 years — after that, you're playing with house money.
- By year 5, paydown + projected appreciation supports a ~$36k cash-out refi (75% LTV) — recoverable capital for the next deal without selling this one.
Negotiation context
- It's been on market 28 days — a 2% lower offer ($196k) is reasonable based on typical stale-listing flexibility.
- 4 sale attempts with the ask held roughly flat each time — persistent listings suggest the price (not the market) is what's stuck; bring a comps-based counter.
- Current owner paid $93k; list at $199k implies a 114% gain — meaningful room to come down on a strong offer.
Questions for the listing agent
- What does the HOA fee cover, when was the last increase, and are there any pending special assessments or reserve-fund shortfalls?
- Is there a deadline driving the sale (1031 exchange, divorce, estate, relocation)? That informs how much negotiation room exists.
- Schools are F-rated, which usually means shorter tenancies and higher turnover. Who's the typical renter profile here, and what's been the actual vacancy rate?
- The area grade is low — what's the realistic commute time and amenity access for the typical tenant pool here? Any planned neighborhood developments (good or bad) we should know about?
- What's the average days-on-market for RENTAL listings here right now (not sales)? A rising rental-DOM trend means longer vacancies and softer asking-rent achievability than the comps imply.
- What's the recent tenant-quality profile in this submarket — average credit score on applications, eviction rate, late-payment / NSF rate, and stable-employment percentage? A property-management company in the area should have these aggregated.
- How much new for-sale + rental construction is in the pipeline within 1–3 miles? Heavy new supply typically softens prices + rents 12–24 months out; constrained supply supports both.
Investment metrics
- 1% rule
- 1.11% ✓
- Cap rate
- 7.18%
- Cash-on-cash
- 3.17%
- DSCR
- 1.14
- GRM
- 7.5
CMA / ARV
- ARV (on-the-fly)
- $178,000
- Comps found
- 12
Show comp detail 12 sales within ~0.75 mi
| Address | Dist | Beds/Ba | Sqft | Sold | Price | $/sf | Match |
|---|---|---|---|---|---|---|---|
| 244 Canterbury Rd | 0.00mi | 3/1.0 | 1,000 (0%) | 1mo | $175,000 | $175 | 99 |
| 225 Canterbury Rd | 0.10mi | 3/1.5 | 1,008 (+1%) | 14mo | $155,000 | $154 | 81 |
| 5936 Decker Rd | 0.18mi | 3/2.0 | 1,080 (+8%) | 7mo | $218,000 | $202 | 69 |
| 5814 Decker Rd | 0.50mi | 3/1.0 | 1,008 (+1%) | 10mo | $202,400 | $201 | 67 |
| 3176 Cherry Ridge Rd | 0.61mi | 3/1.5 | 1,008 (+1%) | 9mo | $256,000 | $254 | 61 |
| 112 Essex Ct | 0.48mi | 3/1.0 | 1,008 (+1%) | 19mo | $165,000 | $164 | 60 |
| 3126 Snowden Dr | 0.58mi | 3/2.0 | 1,008 (+1%) | 9mo | $265,000 | $263 | 60 |
| 167 Dorchester Dr | 0.48mi | 2/1.0 (-1) | 1,080 (+8%) | 1mo | $195,000 | $181 | 59 |
| 5791 Decker Rd | 0.61mi | 2/1.0 (-1) | 900 (-10%) | 3mo | $125,000 | $139 | 47 |
| 172 Dover Drive Dr | 0.44mi | 3/2.0 | 1,144 (+14%) | 5mo | $160,000 | $140 | 47 |
| 1123 Porter Dr | 0.51mi | 2/1.5 (-1) | 900 (-10%) | 8mo | $160,000 | $178 | 46 |
| 1119 Porter Dr | 0.53mi | 2/1.5 (-1) | 1,116 (+12%) | 8mo | $134,000 | $120 | 42 |
Match score weights: distance 35% · size 25% · config 20% · recency 20%. Top-matched comps best support the ARV.
Projected returns pro-forma
3.51% appreciation · 3.0% rent growth · sell at horizon
- IRR
- 11.9%
- Equity multiple
- 1.70×
- Total profit
- $38,900
- Equity at exit
- $95,203
- IRR
- 13.7%
- Equity multiple
- 3.14×
- Total profit
- $119,068
- Equity at exit
- $151,333
Cash invested: $55,720 (down + closing). Projections, not guarantees.
Landlord ↔ Tenant lean methodology
- Overall (STATE)
- 62 Landlord-Friendly
- State Pennsylvania
- 62 Landlord-Friendly · EVEN
- County
- — inherits STATE
- City
- — inherits STATE
ZIP-level market 18324
- Home prices YoY
- 1.5%
- Active inventory
- 293
- Price-to-rent
- 7.5×
Monthly cashflow live
- Estimated rent
- $2,200 medium interval (Pro) →
- Mortgage (P&I)
- −$1,044
- Tax from tax record
- −$300 /mo · $3,602/yr
- Insurance
- −$83
- HOA
- −$164
- Vacancy / Maint / Mgmt
- −$462
- Net cashflow
- $147
Break-even live
Sensitivity live
| Price | -10% $260 | -5% $204 | +0% $147 | +5% $91 | +10% $35 |
|---|---|---|---|---|---|
| Rent | -10% $-26 | -5% $60 | +0% $147 | +5% $234 | +10% $321 |
| Rate | -1.0pp $248 | -0.5pp $198 | base $147 | +0.5pp $96 | +1.0pp $43 |
UW: 25.0% down · 7.5% · 30yr · 1.5% tax · 5.0% vac · 8.0% maint · 8.0% mgmt
Financing live
Cash to close
- Down payment
- $49,750
- Closing costs
- $5,970
- Reserves months
- —
- Total cash needed
- —
Loan-product check · same deal, 3 products live
Conventional
25% down · 7.5% · 30yr
- Down + closing
- —
- Monthly P&I
- —
- Monthly cashflow
- —
- DSCR
- —
- Eligible?
- —
Personal DTI + credit; lowest rate.
DSCR
20% down · 8.5% · 30yr
- Down + closing
- —
- Monthly P&I
- —
- Monthly cashflow
- —
- DSCR
- —
- Eligible?
- —
No personal income docs; deal must DSCR.
Hard money
10% down · 12.0% · 12mo
- Down + closing
- —
- Monthly P&I
- —
- Monthly cashflow
- —
- DSCR
- —
- Eligible?
- —
Short-term bridge; refi at stabilization.
Rent comps 1 comps
| Address | Beds | Baths | Sqft | Rent | $/sqft | DOM | Units | Dist |
|---|---|---|---|---|---|---|---|---|
| 353 Saunders Dr Unit PA East Stroudsburg, PA | 3.0 | 2.0 | 1287 | $2,200 | $1.71 | 22d | 1 | 0.63mi |
HOA detail
- Monthly dues
- $164 · $1,968/yr
- Likely covers
- water
Listing history 12 events
-
2026-04-30status Pending
-
2026-04-03$199,000 Active
-
2026-03-25historical $199,000
-
2025-12-04historical
-
2025-12-04historical
-
2025-09-25price $208,900
-
2025-09-11$209,000 Active
-
2025-09-11$209,000 Active
-
2025-09-10historical
-
2025-06-02price $219,900
-
2025-02-09$229,900 Active
-
2004-01-07soldstatus $93,000
ⓘ Source: listings_history table (triggers on properties + properties_extension) + one-shot
backfill from property_details.listing_events for pre-trigger history.
Tax reassessment forecast PA · Partial reset (capped growth)
- Current annual tax
- $3,602 · $300/mo
- Projected year-2 tax
- $3,602 · $300/mo
- Expected delta
- $0/yr ($0/mo · 0.0%)
ⓘ Screening estimate from a state-policy table — verify with the county assessor before closing.
Climate risk First Street
- Flood 1/10 Low FEMA zone X (unshaded) · 0% chance over 30 yrs
- Wildfire 4/10 Moderate
- Heat 3/10 Moderate 7 d/yr ≥95°F today · 15 d/yr by 30 yrs out
- Wind 4/10 Moderate 8% chance of damaging wind over 30 yrs
- Air quality 2/10 Low 1 unhealthy d/yr today · 2 by 30 yrs out
Nearby sold comps map
Loading sold comps map…
Walkable amenities ~0.75 mi
Loading nearby amenities…
Taxation est. · year 1
- Rental income
- $26,400
- − Mortgage interest
- −$11,147
- − Property taxes
- −$3,602
- − Insurance
- −$995
- − Repairs & maintenance
- −$2,112
- − Management
- −$2,112
- − HOA
- −$1,968
- − Depreciation
- −$5,789
- Taxable loss
- −$1,326
- Est. tax savings @ 24.0%
- +$318
- After-tax cash flow
- $2,086/yr
For passive investors: Depreciation is non-cash, so a rental often shows a tax loss while cash-flowing — sheltering income. Rental losses are passive: they offset passive income freely, and up to $25,000/yr can offset ordinary (W-2) income if you actively participate and your MAGI is under $100k (phasing out to $0 by $150k); unused losses carry forward. On sale, claimed depreciation is recaptured at up to 25%, and gains may owe capital-gains tax (a 1031 exchange can defer both). Figures are a year-1 estimate at your 24.0% rate — not tax advice; consult a CPA.
Schools (NCES district)
- District
- East Stroudsburg Area SD
- NCES district ID
- 4208670
- Math proficiency
- 25% ▼ -11.00%
- Reading proficiency
- 43% ▼ -18.00%
- Median HH income
- $57,142
- Composite
- 30.13/100
- National rank
- #6332
- State rank
- #413 of 539 in PA
Livability — Saw Creek
- Score
- 59/100
- State rank
- #1538
- US rank
- #20241
Category grades
Schools grade is shown separately in the Schools card above.
Census & demographics
- Census place
- Saw Creek, PA
- Population (ZIP)
- 9,591
Population outlook (Pike County) Hauer SSP2
- Today (2025)
- 53,548 people
- By 2030
- 51,622 · -3.6%
- By 2040
- 46,490 · -13.2%
- By 2050
- 40,372 · -24.6%
- By 2075
- 31,951 · -40.3%
- By 2100
- 26,821 · -49.9%
Race, ethnicity, and origin ACS 2023
- Neighborhood character
- Diverse neighborhood (Simpson 0.67)
- Race & ethnicity
- White 47% Hispanic / Latino 26% Black 21% Two or more races 12% Asian 1%
- Hispanic origin (detail)
- Mexican 1% Puerto Rican 12% Cuban 3% Dominican 5%
- Common ancestry
- Romanian 2% Estonian 1% Lithuanian 1%
- Foreign-born
- 19% · Canada, South Korea
- Languages at home
- 69% English-only · Spanish 19% Russian/Polish/Slavic 4% French/Haitian/Cajun 3%
Political lean MEDSL · Pike
- 2024 margin
- Strong R (+24.1) · D 37.6% · R 61.6%
- 2008→2024 swing
- -19.8pp toward R · 2008: -4.2pp · 2024: -24.1pp
- All cycles
- 2024: R+24.1 2020: R+19.0 2016: R+26.0 2012: R+11.0 2008: R+4.2
Not yet ingested
- Civics
- —
Market trends
- HPI YoY
- ▲ 3.51%
- Current HPI
- 243.6754
- Rent YoY
- —
- Metro
- —
- State GDP YoY
- ▲ 1.68%
- F500 in state
- 34
Industry mix (Fortune 500 HQ in PA)
| Industry | F500 HQs | Revenue |
|---|---|---|
| Healthcare | 2 | $309B |
|
||
| Insurance | 2 | $27B |
|
||
| Telecommunications / Media | 1 | $124B |
|
||
| Industrial Distribution | 1 | $22B |
|
||
| Financial Services | 1 | $20B |
|
||
| Chemicals / Materials | 1 | $18B |
|
||
Price history
+114.0% since first listed12 events — show timeline
- 2026-04-30 Pending — BRIGHT MLS
- 2026-04-03 Listed $199,000 BRIGHT MLS
- 2026-03-25 Coming Soon $199,000 BRIGHT MLS
- 2025-12-04 Listing Removed — BRIGHT MLS
- 2025-12-04 Listing Removed — GLVRMLS
- 2025-09-25 Price Changed $208,900 BRIGHT MLS
- 2025-09-11 Listed $209,000 BRIGHT MLS
- 2025-09-11 Listed $209,000 GLVRMLS
- 2025-09-10 Coming Soon — BRIGHT MLS
- 2025-06-02 Price Changed $219,900 PMAR
- 2025-02-09 Listed $229,900 PMAR
- 2004-01-07 Sold (Public Records) $93,000 Public Records
Property tax history
+1.0%/yrLatest (2026): $3,602 · +1.6% YoY. Source: county tax records.
Cash-flow waterfall
monthlySold comps — $/sqft
last 12 mo · ≤1 miLoading sold comps…