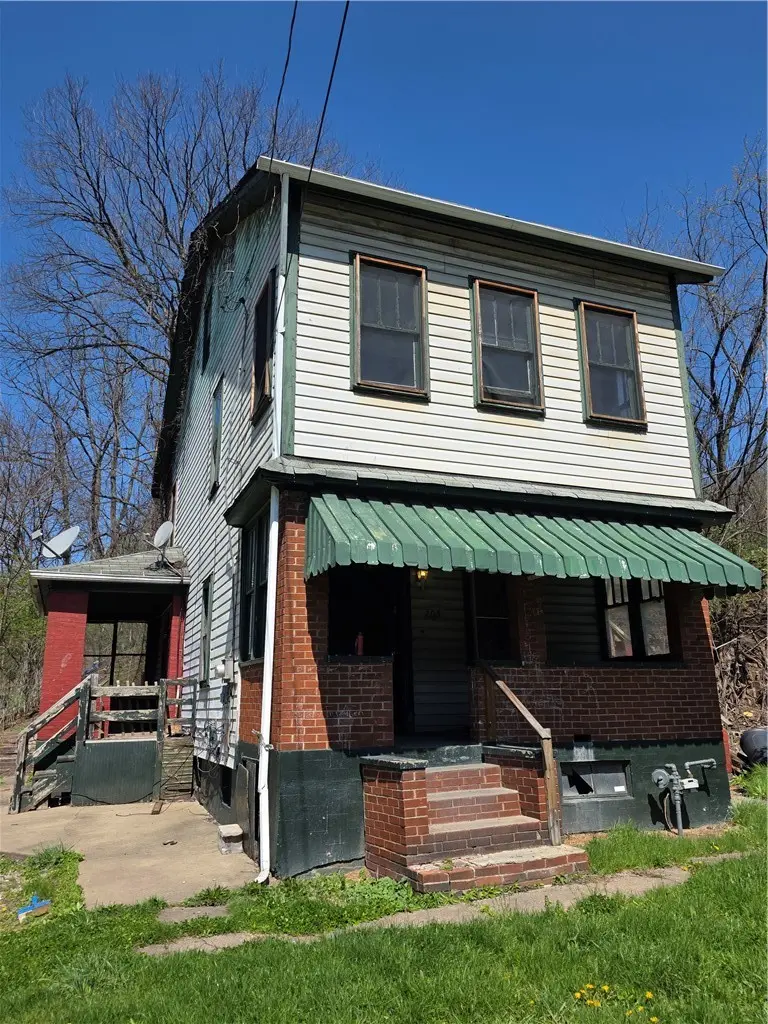
105 Westinghouse Ave · North Versailles, PA
Flood risk 7/10 · Major
- FEMA flood zone
- X (unshaded)
- Chance of flooding over 30 yrs
- 0.75%
- Est. flood insurance / yr
- $473 – $860
Fire risk 1/10 · Minimal
- Est. fire insurance / yr
- $511 – $949
Heat risk 3/10 · Minor
- Hot days now (above 96°F)
- 7 days/yr
- Hot days in 30 yrs
- 18 days/yr
Wind risk 2/10 · Minimal
- Chance of severe wind over 30 yrs
- —
Air-quality risk 4/10 · Minor
- Unhealthy air days now
- 5 days/yr
- Unhealthy air days in 30 yrs
- 7 days/yr
Risk factors via First Street. Map © Google.
Why this score? — see what drove the D grade
The composite is a weighted blend of 9 inputs, each scored 0–100. Each bar is that input's sub-score; the figure is the points it added to the 100-point composite (weight × sub-score).
- Cash flow +15.0/30.0
- ARV discount +7.5/15.0
- 1% rule +5.0/10.0
- DSCR +5.0/10.0
- Rent growth +2.5/5.0
- Livability +2.5/5.0
- Condition / age +2.5/5.0
- Schools +1.8/10.0
- Appreciation +0.0/10.0
$18,000
🖨 Deal sheet (PDF) 📄 Offer letter ✓ Due diligence
Listing remarks
Handyman Special awaits with this 4-bedroom, 1-bathroom home. Bring your vision and put your skills to work to transform this property into a great investment or rental. Located 1 mile and a 3 minute drive from the new Amazon Fulfillment center in North Versailles. Perfect for investors, house flippers, or DIY homeowners. Opportunity knocks to turn this into a solid income-producing property.
Key facts
- 0.23 acre lot
- 2 parking spots
- Built 1905
Property features AI
Exterior
- Parking: Off-street parking for 2 vehicles
- Utilities: Public water; Public sewer; Gas for heating
- Home design: Frame construction; Three-story building; Resale property
- Construction: Asphalt roof; Frame construction
- Exterior features: Public transportation nearby; Lot of approximately 0.23 acres
Interior
- Kitchen: Kitchen on the main level
- Bedrooms: Four bedrooms (two on the upper level, one attic bedroom, and additional bedroom listed)
- Flooring: Hardwood; Laminate; Vinyl
- Bathrooms: One full bathroom
- Heating & cooling: Forced-air gas heating
- Interior features: Hardwood, laminate, and vinyl flooring; Partial interior-entry basement
Neighborhood map
What this means for you Summary
Snapshot
- This is a 4-bed/1.0-bath single-family listed at $18k.
Deal economics
- At list price, monthly cash flow is $1k ($12k/yr) — positive.
- The deal already cash-flows at list — no discount required.
- Meets the 1% rule at list price ($2k rent vs $18k).
- Recommended offer: $17k (3.0% below list) — sets the bar for market timing.
Location & tenants
- Location reads: area grade D — affects rentability + tenant quality, not the cash-flow math above.
- East Allegheny SD (suburban): math 14% / reading 30% proficiency, ranked #485 of 539 in PA (top 90%) — low school quality limits family demand, transient renter base, plan for 1-2y turnover.
- Market conditions: 31 active listings in the ZIP; 5 comparable units currently listed for rent nearby; rentals at typical pace (median 24d on market — plan ~3-4 weeks tenant-placement turnaround); 40% of comp listings sitting > 30 days — soft ceiling on asking rent; 2,996 units permitted in Allegheny County in 2024 (1,588 in 5+ unit buildings).
- This rent runs 35% of the median local income ($54k/yr) — at the standard rent-burdened threshold; future hikes will face affordability resistance.
Forward outlook
- Local home prices are declining (-3.0%/yr); year-one equity from $124 of loan paydown is wiped out by about $540 of value loss. Plan a longer hold.
- At projected returns (-3.0% appreciation + 3.0% rent growth), your $5k cash investment doubles in ~1 year — after that, you're playing with house money.
Negotiation context
- It's been on market 55 days — a 3% lower offer ($17k) is reasonable based on typical stale-listing flexibility.
- Current owner paid $12k; 48% above their basis — modest negotiation headroom, anchor on the comps not their cost.
Risks & watch-outs
- Watch-outs: property tax is 4.9% of price; flood insurance adds $56/mo; built in 1905 — expect roof / HVAC / electrical / plumbing capex.
- Climate carrying-cost: major flood risk — expect insurance premiums to compound above CPI over the hold.
Questions for the listing agent
- It's been on market 55 days. Have you received any prior offers? Is the seller open to a 3% concession, seller financing, or rate buy-down credit?
- Built in 1905 — when were the roof, HVAC, electrical panel, plumbing, and water heater last replaced?
- Property tax is high relative to price — has the assessment been appealed recently, and will the sale trigger a re-assessment?
- What's the actual annual flood-insurance premium (NFIP or private), and is the property in a SFHA with mandatory coverage?
- Is there a deadline driving the sale (1031 exchange, divorce, estate, relocation)? That informs how much negotiation room exists.
- The area grade is low — what's the realistic commute time and amenity access for the typical tenant pool here? Any planned neighborhood developments (good or bad) we should know about?
- What's the average days-on-market for RENTAL listings here right now (not sales)? A rising rental-DOM trend means longer vacancies and softer asking-rent achievability than the comps imply.
- What's the recent tenant-quality profile in this submarket — average credit score on applications, eviction rate, late-payment / NSF rate, and stable-employment percentage? A property-management company in the area should have these aggregated.
- How much new for-sale + rental construction is in the pipeline within 1–3 miles? Heavy new supply typically softens prices + rents 12–24 months out; constrained supply supports both.
Investment metrics
- 1% rule
- 8.71% ✓
- Cap rate
- 77.12%
- Cash-on-cash
- 252.97%
- DSCR
- 12.26
- GRM
- 1.0
CMA / ARV
- ARV (median comp)
- $134,964
- List price
- $18,000
- Delta
- -86.66%
- Verdict
- UNDERPRICED
- Comps
- 20 within 1.0 mi
Show comp detail 12 sales within ~0.75 mi
| Address | Dist | Beds/Ba | Sqft | Sold | Price | $/sf | Match |
|---|---|---|---|---|---|---|---|
| 908 Franklin St | 0.55mi | 3/1.0 (-1) | 1,702 (+6%) | 1mo | $70,000 | $41 | 59 |
| 509 Fawcett Ave | 0.55mi | 3/1.0 (-1) | 1,650 (+2%) | 14mo | $20,000 | $12 | 54 |
| 831 Lincoln Way | 0.46mi | 3/2.0 (-1) | 1,530 (-5%) | 13mo | $200,000 | $131 | 51 |
| 405 Westinghouse Ave | 0.37mi | 4/1.5 | 1,800 (+12%) | 17mo | $105,000 | $58 | 47 |
| 124 Park Way | 0.51mi | 3/1.0 (-1) | 1,411 (-12%) | 9mo | $149,900 | $106 | 44 |
| 1140 Franklin St | 0.73mi | 3/2.0 (-1) | 1,525 (-5%) | 8mo | $140,000 | $92 | 42 |
| 1002 Summit St | 0.71mi | 3/2.0 (-1) | 1,462 (-9%) | 2mo | $157,000 | $107 | 41 |
| 1134 Lincoln Way | 0.69mi | 3/2.5 (-1) | 1,596 (-1%) | 18mo | $195,800 | $123 | 40 |
| 915 Summit St | 0.64mi | 4/2.0 | 1,803 (+12%) | 9mo | $225,000 | $125 | 38 |
| 3106 State St | 0.71mi | 3/1.0 (-1) | 1,480 (-8%) | 14mo | $40,000 | $27 | 37 |
| 611 Lynda Ln | 0.64mi | 3/2.0 (-1) | 1,452 (-10%) | 14mo | $150,000 | $103 | 33 |
| 2923 State St | 0.69mi | 3/1.5 (-1) | 1,784 (+11%) | 15mo | $159,000 | $89 | 30 |
Match score weights: distance 35% · size 25% · config 20% · recency 20%. Top-matched comps best support the ARV.
Projected returns pro-forma
-3.0% appreciation · 3.0% rent growth · sell at horizon
- IRR
- —
- Equity multiple
- 13.16×
- Total profit
- $61,303
- Equity at exit
- $2,684
- IRR
- —
- Equity multiple
- 28.05×
- Total profit
- $136,324
- Equity at exit
- $1,556
Cash invested: $5,040 (down + closing). Projections, not guarantees.
Landlord ↔ Tenant lean methodology
- Overall (STATE)
- 62 Landlord-Friendly
- State Pennsylvania
- 62 Landlord-Friendly · EVEN
- County
- — inherits STATE
- City
- — inherits STATE
ZIP-level market 15137
- Home prices YoY
- -9.2%
- Active inventory
- 31
- Price-to-rent
- 1.0×
Monthly cashflow live
- Estimated rent
- $1,567 high interval (Pro) →
- Mortgage (P&I)
- −$94
- Tax from tax record
- −$74 /mo · $886/yr
- Insurance
- −$8
- Flood insurance flood zone
- −$56 /mo · $666/yr
- HOA
- −$0
- Vacancy / Maint / Mgmt
- −$329
- Net cashflow
- $1,007
Break-even live
Sensitivity live
| Price | -10% $1,071 | -5% $1,064 | +0% $1,007 | +5% $1,002 | +10% $997 |
|---|---|---|---|---|---|
| Rent | -10% $883 | -5% $945 | +0% $1,007 | +5% $1,069 | +10% $1,131 |
| Rate | -1.0pp $1,016 | -0.5pp $1,011 | base $1,007 | +0.5pp $1,002 | +1.0pp $998 |
UW: 25.0% down · 7.5% · 30yr · 1.5% tax · 5.0% vac · 8.0% maint · 8.0% mgmt
Financing live
Cash to close
- Down payment
- $4,500
- Closing costs
- $540
- Reserves months
- —
- Total cash needed
- —
Loan-product check · same deal, 3 products live
Conventional
25% down · 7.5% · 30yr
- Down + closing
- —
- Monthly P&I
- —
- Monthly cashflow
- —
- DSCR
- —
- Eligible?
- —
Personal DTI + credit; lowest rate.
DSCR
20% down · 8.5% · 30yr
- Down + closing
- —
- Monthly P&I
- —
- Monthly cashflow
- —
- DSCR
- —
- Eligible?
- —
No personal income docs; deal must DSCR.
Hard money
10% down · 12.0% · 12mo
- Down + closing
- —
- Monthly P&I
- —
- Monthly cashflow
- —
- DSCR
- —
- Eligible?
- —
Short-term bridge; refi at stabilization.
Rent comps 5 comps
| Address | Beds | Baths | Sqft | Rent | $/sqft | DOM | Units | Dist |
|---|---|---|---|---|---|---|---|---|
| 2212 Cronemeyer St McKeesport, PA | 3.0 | 1.0 | 1720 | $1,375 | $0.80 | 44d | 1 | 0.86mi |
| 200 Delaware Ave North Versailles, PA | 3.0 | 1.5 | 1470 | $1,450 | $0.99 | 15d | 1 | 1.09mi |
| 201 S 4th St Duquesne, PA | 3.0 | 1.0 | 1200 | $1,385 | $1.15 | 44d | 1 | 1.24mi |
| 827 Hinnerman St Duquesne, PA | 3.0 | 1.0 | 1136 | $1,250 | $1.10 | 24d | 1 | 1.35mi |
| 19 S 6th St Duquesne, PA | 3.0 | 1.0 | 2100 | $1,675 | $0.80 | 24d | 1 | 1.42mi |
Listing history 14 events
-
2026-06-18days on market $18,000 Active 55 DOM
-
2026-06-17days on market $18,000 Active 54 DOM
-
2026-06-16days on market $18,000 Active 53 DOM
-
2026-06-15days on market $18,000 Active 52 DOM
-
2026-06-13days on market $18,000 Active 50 DOM
-
2026-06-09days on market $18,000 Active 46 DOM
-
2026-06-08days on market $18,000 Active 45 DOM
-
2026-06-07days on market $18,000 Active 44 DOM
-
2026-06-03days on market $18,000 Active 40 DOM
-
2026-06-02days on market $18,000 Active 39 DOM
-
2026-06-01days on market $18,000 Active 38 DOM
-
2026-05-31days on market $18,000 Active 37 DOM
-
2026-04-24$18,000 Active 395-char remark
-
1990-09-13soldstatus $12,188
ⓘ Source: listings_history table (triggers on properties + properties_extension) + one-shot
backfill from property_details.listing_events for pre-trigger history.
Tax reassessment forecast PA · Partial reset (capped growth)
- Current annual tax
- $886 · $74/mo
- Projected year-2 tax
- $886 · $74/mo
- Expected delta
- $0/yr ($0/mo · 0.0%)
ⓘ Screening estimate from a state-policy table — verify with the county assessor before closing.
Climate risk First Street
- Flood 7/10 Severe FEMA zone X (unshaded) · 75% chance over 30 yrs
- Wildfire 1/10 Low
- Heat 3/10 Moderate 7 d/yr ≥96°F today · 18 d/yr by 30 yrs out
- Wind 2/10 Low
- Air quality 4/10 Moderate 5 unhealthy d/yr today · 7 by 30 yrs out
Nearby sold comps map
Loading sold comps map…
Walkable amenities ~0.75 mi
Loading nearby amenities…
Taxation est. · year 1
- Rental income
- $18,808
- − Mortgage interest
- −$1,008
- − Property taxes
- −$886
- − Insurance
- −$756
- − Repairs & maintenance
- −$1,505
- − Management
- −$1,505
- − Depreciation
- −$524
- Taxable income
- $12,624
- Est. tax owed @ 24.0%
- −$3,030
- After-tax cash flow
- $9,053/yr
For passive investors: Depreciation is non-cash, so a rental often shows a tax loss while cash-flowing — sheltering income. Rental losses are passive: they offset passive income freely, and up to $25,000/yr can offset ordinary (W-2) income if you actively participate and your MAGI is under $100k (phasing out to $0 by $150k); unused losses carry forward. On sale, claimed depreciation is recaptured at up to 25%, and gains may owe capital-gains tax (a 1031 exchange can defer both). Figures are a year-1 estimate at your 24.0% rate — not tax advice; consult a CPA.
Schools (NCES district)
- District
- East Allegheny SD
- NCES district ID
- 4208060
- Math proficiency
- 14% ▼ -13.00%
- Reading proficiency
- 30% ▼ -19.00%
- Median HH income
- $38,748
- Composite
- 18.44/100
- National rank
- #8930
- State rank
- #485 of 539 in PA
Livability — North Versailles
No livability data for this city. (Only ~50 U.S. cities are tracked.)
Census & demographics
- County
- Allegheny County · 1,022,028 people
- City population
- 10,043
- Metro
- Pittsburgh, PA
- Population (ZIP)
- 10,043
- Household income
- $53,632
- Rent vs Own
- Severe rent burden
- 393.0
Population outlook (Allegheny County) Hauer SSP2
- Today (2025)
- 1,250,282 people
- By 2030
- 1,256,482 · +0.5%
- By 2040
- 1,256,318 · +0.5%
- By 2050
- 1,244,169 · -0.5%
- By 2075
- 1,197,693 · -4.2%
- By 2100
- 1,093,187 · -12.6%
Race, ethnicity, and origin ACS 2023
- Neighborhood character
- Predominantly White (77%)
- Race & ethnicity
- White 77% Black 18% Two or more races 2% Asian 2%
- Common ancestry
- Romanian 6% Slovak 3% Lithuanian 1%
- Foreign-born
- 2% · Vietnam
- Languages at home
- 97% English-only · Vietnamese 2%
Political lean MEDSL · Allegheny
- 2024 margin
- Strong D (+20.3) · D 59.7% · R 39.4%
- 2008→2024 swing
- +4.8pp toward D · 2008: 15.5pp · 2024: 20.3pp
- All cycles
- 2024: D+20.3 2020: D+20.4 2016: D+16.4 2012: D+14.4 2008: D+15.5
Not yet ingested
- Civics
- —
Market trends
- HPI YoY
- ▼ -25.43%
- Current HPI
- 252.4089
- Rent YoY
- —
- Metro
- Pittsburgh, PA
- State GDP YoY
- ▲ 1.68%
- F500 in state
- 34
Industry mix (Fortune 500 HQ in PA)
| Industry | F500 HQs | Revenue |
|---|---|---|
| Healthcare | 2 | $309B |
|
||
| Insurance | 2 | $27B |
|
||
| Telecommunications / Media | 1 | $124B |
|
||
| Industrial Distribution | 1 | $22B |
|
||
| Financial Services | 1 | $20B |
|
||
| Chemicals / Materials | 1 | $18B |
|
||
Price history
+47.7% since first listed2 events — show timeline
- 2026-04-24 Listed $18,000 West Penn MLS
- 1990-09-13 Sold (Public Records) $12,188 Public Records
Property tax history
+0.5%/yrLatest (2026): $886 · +0.0% YoY. Source: county tax records.
Cash-flow waterfall
monthlySold comps — $/sqft
last 12 mo · ≤1 miLoading sold comps…