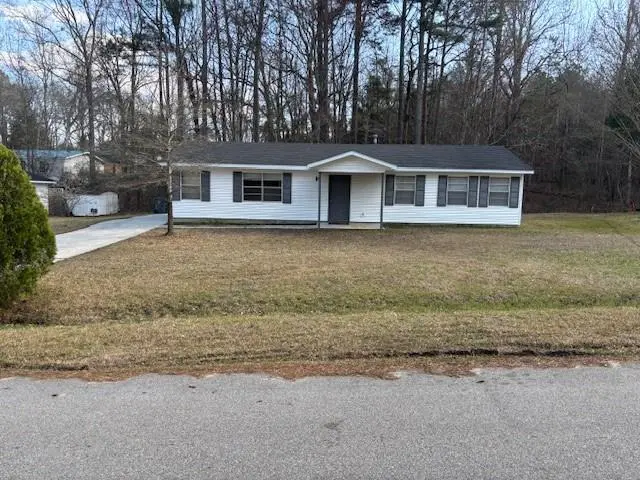
1071 Alexander St · Union Point, GA
Flood risk 1/10 · Minimal
- FEMA flood zone
- X (unshaded)
- Chance of flooding over 30 yrs
- 0.0%
- Est. flood insurance / yr
- $507 – $1,088
Fire risk 4/10 · Minor
- Est. fire insurance / yr
- $963 – $1,789
Heat risk 6/10 · Moderate
- Hot days now (above 106°F)
- 7 days/yr
- Hot days in 30 yrs
- 17 days/yr
Wind risk 6/10 · Moderate
- Chance of severe wind over 30 yrs
- 35.0%
Air-quality risk 3/10 · Minor
- Unhealthy air days now
- 3 days/yr
- Unhealthy air days in 30 yrs
- 3 days/yr
Risk factors via First Street. Map © Google.
Why this score? — see what drove the C- grade
The composite is a weighted blend of 9 inputs, each scored 0–100. Each bar is that input's sub-score; the figure is the points it added to the 100-point composite (weight × sub-score).
- ARV discount +15.0/15.0
- Cash flow +11.9/30.0
- Appreciation +10.0/10.0
- DSCR +3.5/10.0
- Livability +2.9/5.0
- Schools +2.7/10.0
- Rent growth +2.5/5.0
- Condition / age +2.5/5.0
- 1% rule +2.2/10.0
$164,850
🖨 Deal sheet (PDF) 📄 Offer letter ✓ Due diligence
Listing remarks MLS
**For the address, tax records reflect "Street", but maps and GPS only recognize Avenue. Please input Alexander Avenue in GPS** Updated home in Historic Union Point, which is 7 miles east of Greensboro and 5 miles north of I-20. Within walking distance of the entrance to the Firefly trail which goes from Union Point to Athens. New HVAC, new plumbing, new siding, new paint, new cabinets electrical upgrades, new carpet and flooring. Move-in ready. 100% USDA available. Perfect starter home or investment. Priced to sell.
Key facts
- New plumbing
- New siding
- New hvac
Tags
Neighborhood map
What this means for you Summary
Snapshot
- This is a 3-bed/2.0-bath single-family listed at $165k.
Deal economics
- At list price, monthly cash flow is $-41 ($-492/yr) — negative.
- To cash-flow at today's rent, offer at most $158k (4.4% below list).
- To meet the 1% rule (rent ≥ 1% of price), the offer needs to be $119k (27.6% below list).
- Recommended offer: $119k (27.6% below list) — sets the bar for 1% rule.
Location & tenants
- Location reads 58/100 on livability (#432 in GA) — a working-class tenant base; expect higher turnover. Strengths: cost of living A+, housing A+, crime A; Watch: schools F, amenities F, commute F.
- Greene County (rural): math 27% / reading 37% proficiency, ranked #82 of 174 in GA (top 47%) — families likely to look elsewhere, expect single-tenant / working-renter base with shorter leases; 64% free/reduced lunch — lower-income household profile, screen leases tightly.
- Market conditions: 20 active listings in the ZIP; 295 units permitted in Greene County in 2024 (0 in 5+ unit buildings).
Forward outlook
- In year one you build about $18k of equity ($1k loan paydown + $16k appreciation (10.0% local appreciation)).
- Greene County population projected at +5% by 2050 — modest demand growth; plan on rents tracking national, not racing it.
- At projected returns (10.0% appreciation + 3.0% rent growth), your $46k cash investment doubles in ~3 years — after that, you're playing with house money.
- By year 3, paydown + projected appreciation supports a ~$45k cash-out refi (75% LTV) — recoverable capital for the next deal without selling this one.
Negotiation context
- It's been on market 96 days — a 9% lower offer ($150k) is reasonable based on typical stale-listing flexibility.
- 2 sale attempts with the ask held roughly flat each time — persistent listings suggest the price (not the market) is what's stuck; bring a comps-based counter.
Risks & watch-outs
- Climate carrying-cost: major wind risk, 35% chance of damaging wind over 30y; extreme-heat days projected 7→17/yr by 2055 (HVAC capex compounding) — expect insurance premiums to compound above CPI over the hold.
Questions for the listing agent
- What do current leases actually rent for vs. the listed asking? Can we see a recent rent roll and the last 12 months of T-12 income?
- It's been on market 96 days. Have you received any prior offers? Is the seller open to a 28% concession, seller financing, or rate buy-down credit?
- Built in 1978 — when were the roof, HVAC, electrical panel, plumbing, and water heater last replaced?
- Why hasn't it sold? Are there any deal-killer items the seller is aware of (foundation, flood, title, zoning, code violations)?
- Is there a deadline driving the sale (1031 exchange, divorce, estate, relocation)? That informs how much negotiation room exists.
- Schools are F-rated, which usually means shorter tenancies and higher turnover. Who's the typical renter profile here, and what's been the actual vacancy rate?
- What's the average days-on-market for RENTAL listings here right now (not sales)? A rising rental-DOM trend means longer vacancies and softer asking-rent achievability than the comps imply.
- What's the recent tenant-quality profile in this submarket — average credit score on applications, eviction rate, late-payment / NSF rate, and stable-employment percentage? A property-management company in the area should have these aggregated.
- How much new for-sale + rental construction is in the pipeline within 1–3 miles? Heavy new supply typically softens prices + rents 12–24 months out; constrained supply supports both.
Investment metrics
- 1% rule
- 0.72% ✗
- Cap rate
- 5.99%
- Cash-on-cash
- -1.07%
- DSCR
- 0.95
- GRM
- 11.5
CMA / ARV
- ARV (median comp)
- $204,416
- List price
- $164,850
- Delta
- -19.36%
- Verdict
- UNDERPRICED
- Comps
- 20 within 1.0 mi
Show comp detail 5 sales within ~0.75 mi
| Address | Dist | Beds/Ba | Sqft | Sold | Price | $/sf | Match |
|---|---|---|---|---|---|---|---|
| 207 Willow Ln | 0.08mi | 3/2.0 | 1,456 (+12%) | 10mo | $155,000 | $106 | 68 |
| 1010 Orear Rd | 0.67mi | 4/2.0 (+1) | 1,300 (0%) | 8mo | $295,000 | $227 | 57 |
| 207 Comfort St | 0.63mi | 3/2.0 | 1,276 (-2%) | 16mo | $215,000 | $168 | 55 |
| 215 Hunter St | 0.45mi | 3/2.0 | 1,114 (-14%) | 1mo | $210,000 | $189 | 54 |
| 208 Thornton St | 0.56mi | 2/1.0 (-1) | 1,392 (+7%) | 13mo | $229,000 | $165 | 42 |
Match score weights: distance 35% · size 25% · config 20% · recency 20%. Top-matched comps best support the ARV.
Projected returns pro-forma
10.0% appreciation · 3.0% rent growth · sell at horizon
- IRR
- 23.5%
- Equity multiple
- 2.89×
- Total profit
- $87,090
- Equity at exit
- $148,510
- IRR
- 20.9%
- Equity multiple
- 6.60×
- Total profit
- $258,367
- Equity at exit
- $320,267
Cash invested: $46,158 (down + closing). Projections, not guarantees.
Landlord ↔ Tenant lean methodology
- Overall (STATE)
- 90 Strongly Landlord-Friendly
- State Georgia
- 90 Strongly Landlord-Friendly · R+3
- County
- — inherits STATE
- City
- — inherits STATE
ZIP-level market 30669
- Active inventory
- 20
- Price-to-rent
- 11.5×
Monthly cashflow live
- Estimated rent
- $1,193 medium interval (Pro) →
- Mortgage (P&I)
- −$864
- Tax from tax record
- −$50 /mo · $604/yr
- Insurance
- −$69
- HOA
- −$0
- Vacancy / Maint / Mgmt
- −$251
- Net cashflow
- $-41
Break-even live
Sensitivity live
| Price | -10% $52 | -5% $6 | +0% $-41 | +5% $-88 | +10% $-134 |
|---|---|---|---|---|---|
| Rent | -10% $-135 | -5% $-88 | +0% $-41 | +5% $6 | +10% $53 |
| Rate | -1.0pp $42 | -0.5pp $1 | base $-41 | +0.5pp $-84 | +1.0pp $-127 |
UW: 25.0% down · 7.5% · 30yr · 1.5% tax · 5.0% vac · 8.0% maint · 8.0% mgmt
Financing live
Cash to close
- Down payment
- $41,212
- Closing costs
- $4,946
- Reserves months
- —
- Total cash needed
- —
Loan-product check · same deal, 3 products live
Conventional
25% down · 7.5% · 30yr
- Down + closing
- —
- Monthly P&I
- —
- Monthly cashflow
- —
- DSCR
- —
- Eligible?
- —
Personal DTI + credit; lowest rate.
DSCR
20% down · 8.5% · 30yr
- Down + closing
- —
- Monthly P&I
- —
- Monthly cashflow
- —
- DSCR
- —
- Eligible?
- —
No personal income docs; deal must DSCR.
Hard money
10% down · 12.0% · 12mo
- Down + closing
- —
- Monthly P&I
- —
- Monthly cashflow
- —
- DSCR
- —
- Eligible?
- —
Short-term bridge; refi at stabilization.
Listing history 16 events
-
2026-06-16status $164,850 Pending 96 DOM
-
2026-06-16days on market $164,850 Active 96 DOM
-
2026-06-15days on market $164,850 Active 95 DOM
-
2026-06-14days on market $164,850 Active 93 DOM
-
2026-06-13days on market $164,850 Active 92 DOM
-
2026-06-10pricedays on market $164,850 Active 90 DOM
-
2026-06-09days on market $165,000 Active 89 DOM
-
2026-06-08days on market $165,000 Active 88 DOM
-
2026-06-07days on market $165,000 Active 87 DOM
-
2026-06-03days on market $165,000 Active 83 DOM
-
2026-06-02days on market $165,000 Active 82 DOM
-
2026-06-01days on market $165,000 Active 81 DOM
-
2026-05-31days on market $165,000 Active 80 DOM
-
2026-05-30days on market $165,000 Active 79 DOM
-
2026-03-12$165,000 New 536-char remark
Show marketing remark (532 chars)
**For the address, tax records reflect "Street", but maps and GPS only recognize Avenue. Please input Alexander Avenue in GPS** Updated home in Historic Union Point, which is 7 miles east of Greensboro and 5 miles north of I-20. Within walking distance of the entrance to the Firefly trail which goes from Union Point to Athens. New HVAC, new plumbing, new siding, new paint, new cabinets electrical upgrades, new carpet and flooring. Move-in ready. 100% USDA available. Perfect starter home or investment. Priced to sell.
-
2026-03-12$165,000 Active 532-char remark
Show marketing remark (532 chars)
**For the address, tax records reflect "Street", but maps and GPS only recognize Avenue. Please input Alexander Avenue in GPS** Updated home in Historic Union Point, which is 7 miles east of Greensboro and 5 miles north of I-20. Within walking distance of the entrance to the Firefly trail which goes from Union Point to Athens. New HVAC, new plumbing, new siding, new paint, new cabinets electrical upgrades, new carpet and flooring. Move-in ready. 100% USDA available. Perfect starter home or investment. Priced to sell.
ⓘ Source: listings_history table (triggers on properties + properties_extension) + one-shot
backfill from property_details.listing_events for pre-trigger history.
Tax reassessment forecast GA · Resets to sale price
- Current annual tax
- $604 · $50/mo
- Projected year-2 tax
- $1,517 · $126/mo
- Expected delta
- +$913/yr (+$76/mo · 151.1%)
ⓘ Screening estimate from a state-policy table — verify with the county assessor before closing.
Climate risk First Street
- Flood 1/10 Low FEMA zone X (unshaded) · 0% chance over 30 yrs
- Wildfire 4/10 Moderate
- Heat 6/10 Major 7 d/yr ≥106°F today · 17 d/yr by 30 yrs out
- Wind 6/10 Major 35% chance of damaging wind over 30 yrs
- Air quality 3/10 Moderate 3 unhealthy d/yr today · 3 by 30 yrs out
Nearby sold comps map
Loading sold comps map…
Walkable amenities ~0.75 mi
Loading nearby amenities…
Taxation est. · year 1
- Rental income
- $14,316
- − Mortgage interest
- −$9,234
- − Property taxes
- −$604
- − Insurance
- −$824
- − Repairs & maintenance
- −$1,145
- − Management
- −$1,145
- − Depreciation
- −$4,796
- Taxable loss
- −$3,433
- Est. tax savings @ 24.0%
- +$824
- After-tax cash flow
- $331/yr
For passive investors: Depreciation is non-cash, so a rental often shows a tax loss while cash-flowing — sheltering income. Rental losses are passive: they offset passive income freely, and up to $25,000/yr can offset ordinary (W-2) income if you actively participate and your MAGI is under $100k (phasing out to $0 by $150k); unused losses carry forward. On sale, claimed depreciation is recaptured at up to 25%, and gains may owe capital-gains tax (a 1031 exchange can defer both). Figures are a year-1 estimate at your 24.0% rate — not tax advice; consult a CPA.
Schools (NCES district)
- District
- Greene County
- NCES district ID
- 1302490
- Math proficiency
- 27% ▼ -8.00%
- Reading proficiency
- 37% ▼ -5.00%
- Median HH income
- $42,172
- Composite
- 27.08/100
- National rank
- #7046
- State rank
- #82 of 174 in GA
Livability — Union Point
- Score
- 58/100
- State rank
- #432
- US rank
- #21000
Category grades
Schools grade is shown separately in the Schools card above.
Census & demographics
- Census place
- Union Point, GA
- Population (ZIP)
- 3,071
Population outlook (Greene County) Hauer SSP2
- Today (2025)
- 17,835 people
- By 2030
- 18,182 · +1.9%
- By 2040
- 18,509 · +3.8%
- By 2050
- 18,794 · +5.4%
- By 2075
- 19,704 · +10.5%
- By 2100
- 20,584 · +15.4%
Race, ethnicity, and origin ACS 2023
- Neighborhood character
- Diverse neighborhood (Simpson 0.66)
- Race & ethnicity
- Black 41% White 39% Hispanic / Latino 13% Native American 4% Asian 4% Two or more races 4%
- Hispanic origin (detail)
- Mexican 12%
- Common ancestry
- Estonian 2% Lithuanian 1%
- Foreign-born
- 12% · Canada
- Languages at home
- 84% English-only · Spanish 12% Tagalog/Filipino 3% Other Asian/Pacific 1%
Political lean MEDSL · Greene
- 2024 margin
- Strong R (+28.9) · D 35.3% · R 64.2%
- 2008→2024 swing
- -13.9pp toward R · 2008: -15.1pp · 2024: -28.9pp
- All cycles
- 2024: R+28.9 2020: R+26.5 2016: R+26.0 2012: R+22.5 2008: R+15.1
Not yet ingested
- Civics
- —
Market trends
- HPI YoY
- ▲ 118.17%
- Current HPI
- 267.11
- Rent YoY
- —
- Metro
- —
- State GDP YoY
- ▲ 2.66%
- F500 in state
- 28
Industry mix (Fortune 500 HQ in GA)
| Industry | F500 HQs | Revenue |
|---|---|---|
| Paper / Packaging | 2 | $29B |
|
||
| Retail | 1 | $160B |
|
||
| Transportation / Logistics | 1 | $91B |
|
||
| Airlines | 1 | $62B |
|
||
| Consumer Goods | 1 | $47B |
|
||
| Utilities | 1 | $25B |
|
||
Price history
+0.0% since first listed2 events — show timeline
- 2026-03-12 Listed $165,000 FMLS
- 2026-03-12 Listed $165,000 GAMLS
Property tax history
+4.2%/yrLatest (2025): $604 · +9.2% YoY. Source: county tax records.
Cash-flow waterfall
monthlySold comps — $/sqft
last 12 mo · ≤1 miLoading sold comps…