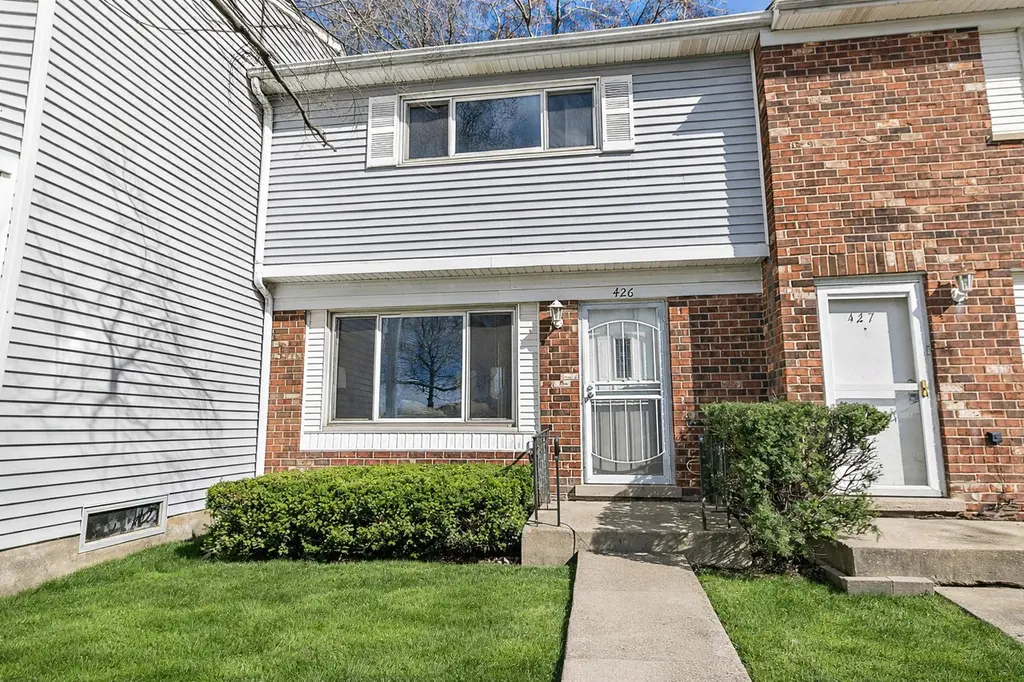
426 Greentree Ln · Bolingbrook, IL
Flood risk 1/10 · Minimal
- FEMA flood zone
- X (unshaded)
- Chance of flooding over 30 yrs
- 0.0%
- Est. flood insurance / yr
- $473 – $860
Fire risk 1/10 · Minimal
- Est. fire insurance / yr
- $804 – $1,492
Heat risk 3/10 · Minor
- Hot days now (above 103°F)
- 7 days/yr
- Hot days in 30 yrs
- 15 days/yr
Wind risk 2/10 · Minimal
- Chance of severe wind over 30 yrs
- —
Air-quality risk 4/10 · Minor
- Unhealthy air days now
- 4 days/yr
- Unhealthy air days in 30 yrs
- 6 days/yr
Risk factors via First Street. Map © Google.
Why this score? — see what drove the D grade
The composite is a weighted blend of 9 inputs, each scored 0–100. Each bar is that input's sub-score; the figure is the points it added to the 100-point composite (weight × sub-score).
- Cash flow +15.3/30.0
- 1% rule +5.3/10.0
- DSCR +4.7/10.0
- ARV discount +4.5/15.0
- Livability +3.8/5.0
- Rent growth +3.5/5.0
- Condition / age +2.5/5.0
- Schools +2.3/10.0
- Appreciation +0.0/10.0
$224,000
🖨 Deal sheet (PDF) 📄 Offer letter ✓ Due diligence
Listing remarks MLS
This home features fresh paint and offers two full bedrooms along with a bright, inviting living room highlighted by an accent-clad gas fireplace. The living area flows into the dining space and kitchen, where functional shelving above the server provides added storage. The galley kitchen is equipped with granite countertops, high-end cabinetry, a custom backsplash, and stainless steel appliances, with a sliding glass door leading to a private, fenced patio and storage shed. Upstairs, you will find a full bathroom with an updated vanity, modern light fixture, and a partially tiled shower with a built-in shampoo niche, along with two spacious bedrooms. The full basement expands the living space and includes a partially finished bathroom with jetted tub and vanity sink, recessed lighting, and wood wall paneling. Laundry is conveniently located in the unit, offering added everyday functionality. This unit is in a prime location off of IL-RT. 53, near dining, groceries, shopping, parks, and more!
Key facts
- Custom backsplash
- Private fenced patio
- Gas fireplace
Tags
Neighborhood map
What this means for you Summary
Snapshot
- This is a 2-bed/1.0-bath other listed at $224k.
Deal economics
- At list price, monthly cash flow is $81 ($966/yr) — positive.
- The deal already cash-flows at list — no discount required.
- Meets the 1% rule at list price ($2k rent vs $224k).
- Recommended offer: $211k (6.0% below list) — sets the bar for market timing.
- Cap rate 6.7% vs local median 4.9% in Bolingbrook — top-decile yield for the area; either an underpriced asset or a hidden risk that comps aren't pricing in. Stress-test before assuming the spread holds.
Location & tenants
- Location reads 76/100 on livability (#199 in IL, #3,692 nationally) — a middle-class / working-renter tenant base. Strengths: employment A+, housing A+, crime A; Watch: amenities F, health & safety F.
- Valley View CUSD 365U (suburban): math 21% / reading 28% proficiency, ranked #289 of 620 in IL (top 47%) — low school quality limits family demand, transient renter base, plan for 1-2y turnover.
- Zoned schools: Bernard J Ward Elem School (math 12% / reading 12%, grade F, #1,403 of 2,056 statewide, top 71%, 383 students, 0% FRL); Hubert H Humphrey Middle School (math 14% / reading 23%, grade F, #438 of 665 statewide, top 67%, 690 students, 0% FRL); Bolingbrook High School (math 23% / reading 29%, grade F, #244 of 693 statewide, top 35%, 3,405 students, 0% FRL) — zoned schools average 0% FRL vs 51% district-wide (51 pts lower); this property's tenant base skews higher-income than the district average.
- Market conditions: Rents rising fast (+4.1%/yr); 74 active listings in the ZIP; 7 comparable units currently listed for rent nearby; rentals at typical pace (median 24d on market — plan ~3-4 weeks tenant-placement turnaround); solid renter incomes; 2,028 units permitted in Will County in 2024 (530 in 5+ unit buildings).
Forward outlook
- Local home prices are declining (-3.0%/yr); year-one equity from $2k of loan paydown is wiped out by about $7k of value loss. Plan a longer hold.
- Will County population projected to shrink 4% by 2050 — rents likely to lag national; underwrite the cash flow, not the appreciation.
Negotiation context
- It's been on market 84 days — a 6% lower offer ($211k) is reasonable based on typical stale-listing flexibility.
- 8 sale attempts since 7y ago with the ask held roughly flat each time — persistent listings suggest the price (not the market) is what's stuck; bring a comps-based counter.
Questions for the listing agent
- It's been on market 84 days. Have you received any prior offers? Is the seller open to a 6% concession, seller financing, or rate buy-down credit?
- Built in 1969 — when were the roof, HVAC, electrical panel, plumbing, and water heater last replaced?
- What does the HOA fee cover, when was the last increase, and are there any pending special assessments or reserve-fund shortfalls?
- Why hasn't it sold? Are there any deal-killer items the seller is aware of (foundation, flood, title, zoning, code violations)?
- Is there a deadline driving the sale (1031 exchange, divorce, estate, relocation)? That informs how much negotiation room exists.
- Schools are D-rated, which usually means shorter tenancies and higher turnover. Who's the typical renter profile here, and what's been the actual vacancy rate?
- The area grade is low — what's the realistic commute time and amenity access for the typical tenant pool here? Any planned neighborhood developments (good or bad) we should know about?
- What's the average days-on-market for RENTAL listings here right now (not sales)? A rising rental-DOM trend means longer vacancies and softer asking-rent achievability than the comps imply.
- What's the recent tenant-quality profile in this submarket — average credit score on applications, eviction rate, late-payment / NSF rate, and stable-employment percentage? A property-management company in the area should have these aggregated.
- How much new for-sale + rental construction is in the pipeline within 1–3 miles? Heavy new supply typically softens prices + rents 12–24 months out; constrained supply supports both.
Investment metrics
- 1% rule
- 1.03% ✓
- Cap rate
- 6.72%
- Cash-on-cash
- 1.54%
- DSCR
- 1.07
- GRM
- 8.1
CMA / ARV
- ARV (median comp)
- $210,212
- List price
- $224,000
- Delta
- 6.56%
- Verdict
- FAIR
- Comps
- 20 within 1.0 mi
Projected returns pro-forma
-3.0% appreciation · 4.1% rent growth · sell at horizon
- IRR
- -12.4%
- Equity multiple
- 0.55×
- Total profit
- $-28,419
- Equity at exit
- $33,399
- IRR
- -1.5%
- Equity multiple
- 0.89×
- Total profit
- $-6,621
- Equity at exit
- $19,367
Cash invested: $62,720 (down + closing). Projections, not guarantees.
Landlord ↔ Tenant lean methodology
- Overall (STATE)
- 43 Moderately Tenant-Leaning
- State Illinois
- 43 Moderately Tenant-Leaning · D+7
- County
- — inherits STATE
- City
- — inherits STATE
ZIP-level market 60440
- Rents YoY
- 4.1%
- Active inventory
- 74
- Price-to-rent
- 8.1×
Monthly cashflow live
- Estimated rent
- $2,317 high interval (Pro) →
- Mortgage (P&I)
- −$1,175
- Tax from tax record
- −$280 /mo · $3,358/yr
- Insurance
- −$93
- HOA
- −$202
- Lot rent
- −$0
- Vacancy / Maint / Mgmt
- −$487
- Net cashflow
- $81
Break-even live
Sensitivity live
| Price | -10% $207 | -5% $144 | +0% $81 | +5% $17 | +10% $-46 |
|---|---|---|---|---|---|
| Rent | -10% $-103 | -5% $-11 | +0% $81 | +5% $172 | +10% $264 |
| Rate | -1.0pp $193 | -0.5pp $137 | base $81 | +0.5pp $22 | +1.0pp $-37 |
UW: 25.0% down · 7.5% · 30yr · 1.5% tax · 5.0% vac · 8.0% maint · 8.0% mgmt
Financing live
Cash to close
- Down payment
- $56,000
- Closing costs
- $6,720
- Reserves months
- —
- Total cash needed
- —
Loan-product check · same deal, 3 products live
Conventional
25% down · 7.5% · 30yr
- Down + closing
- —
- Monthly P&I
- —
- Monthly cashflow
- —
- DSCR
- —
- Eligible?
- —
Personal DTI + credit; lowest rate.
DSCR
20% down · 8.5% · 30yr
- Down + closing
- —
- Monthly P&I
- —
- Monthly cashflow
- —
- DSCR
- —
- Eligible?
- —
No personal income docs; deal must DSCR.
Hard money
10% down · 12.0% · 12mo
- Down + closing
- —
- Monthly P&I
- —
- Monthly cashflow
- —
- DSCR
- —
- Eligible?
- —
Short-term bridge; refi at stabilization.
Rent comps 7 comps
| Address | Beds | Baths | Sqft | Rent | $/sqft | DOM | Units | Dist |
|---|---|---|---|---|---|---|---|---|
| 451 Yorkshire Sq Unit 451 Bolingbrook, IL | 3.0 | 1.5 | 1470 | $2,400 | $1.63 | 10d | 1 | 0.27mi |
| 176 Fairwood Dr Bolingbrook, IL | 3.0 | 1.5 | 1162 | $2,166 | $1.86 | 46d | 1 | 0.45mi |
| 131 Enclave Cir Unit C Bolingbrook, IL | 2.0 | 1.5 | 1498 | $2,499 | $1.67 | 23d | 1 | 0.54mi |
| 239 Malibu Dr Bolingbrook, IL | 3.0 | 1.5 | 975 | $2,550 | $2.62 | 22d | 1 | 0.97mi |
| 230 Dakota Ct Unit B Bolingbrook, IL | 3.0 | 1.0 | 1400 | $2,200 | $1.57 | 27d | 1 | 1.34mi |
| 231 Dakota Ct Unit B Bolingbrook, IL | 2.0 | 1.0 | 968 | $1,850 | $1.91 | 46d | 1 | 1.35mi |
| 238 Algonquin Ct Unit D Bolingbrook, IL | 3.0 | 1.0 | 1108 | $2,250 | $2.03 | 10d | 1 | 1.41mi |
HOA detail
- Monthly dues
- $202 · $2,424/yr
- Likely covers
- gas
Listing history 40 events
-
2026-06-22days on market $224,000 Active 84 DOM
-
2026-06-21days on market $224,000 Active 83 DOM
-
2026-06-18days on market $224,000 Active 80 DOM
-
2026-06-17days on market $224,000 Active 79 DOM
-
2026-06-16days on market $224,000 Active 78 DOM
-
2026-06-15days on market $224,000 Active 77 DOM
-
2026-06-13days on market $224,000 Active 75 DOM
-
2026-06-13days on market $224,000 Active 74 DOM
-
2026-06-09days on market $224,000 Active 71 DOM
-
2026-06-08days on market $224,000 Active 70 DOM
-
2026-06-07days on market $224,000 Active 69 DOM
-
2026-06-04days on market $224,000 Active 66 DOM
-
2026-06-03days on market $224,000 Active 65 DOM
-
2026-06-02days on market $224,000 Active 64 DOM
-
2026-06-01days on market $224,000 Active 63 DOM
-
2026-05-31days on market $224,000 Active 62 DOM
-
2026-03-30$224,000 Active 1010-char remark
Show marketing remark (1010 chars)
This home features fresh paint and offers two full bedrooms along with a bright, inviting living room highlighted by an accent-clad gas fireplace. The living area flows into the dining space and kitchen, where functional shelving above the server provides added storage. The galley kitchen is equipped with granite countertops, high-end cabinetry, a custom backsplash, and stainless steel appliances, with a sliding glass door leading to a private, fenced patio and storage shed. Upstairs, you will find a full bathroom with an updated vanity, modern light fixture, and a partially tiled shower with a built-in shampoo niche, along with two spacious bedrooms. The full basement expands the living space and includes a partially finished bathroom with jetted tub and vanity sink, recessed lighting, and wood wall paneling. Laundry is conveniently located in the unit, offering added everyday functionality. This unit is in a prime location off of IL-RT. 53, near dining, groceries, shopping, parks, and more!
-
2026-03-30historical
Show marketing remark (1010 chars)
This home features fresh paint and offers two full bedrooms along with a bright, inviting living room highlighted by an accent-clad gas fireplace. The living area flows into the dining space and kitchen, where functional shelving above the server provides added storage. The galley kitchen is equipped with granite countertops, high-end cabinetry, a custom backsplash, and stainless steel appliances, with a sliding glass door leading to a private, fenced patio and storage shed. Upstairs, you will find a full bathroom with an updated vanity, modern light fixture, and a partially tiled shower with a built-in shampoo niche, along with two spacious bedrooms. The full basement expands the living space and includes a partially finished bathroom with jetted tub and vanity sink, recessed lighting, and wood wall paneling. Laundry is conveniently located in the unit, offering added everyday functionality. This unit is in a prime location off of IL-RT. 53, near dining, groceries, shopping, parks, and more!
-
2026-03-19Active
-
2026-03-19historical
-
2025-08-07soldstatus $210,000
-
2025-07-24soldstatus $210,000 Closed
-
2025-06-19historical Contingent - Continue to Show
-
2025-06-05$210,000 Active
-
2022-06-23historical
-
2022-06-23Active
-
2019-12-08historical
-
2019-11-16New
-
2019-06-21soldstatus $135,000
-
2019-05-28soldstatus $135,000 Closed Sale
-
2019-05-16status Pending
-
2019-04-09historical Contingent
-
2019-04-02status Reactivated
-
2019-02-26status Contingent
-
2019-02-21historical
-
2019-02-15$134,900 New
-
2002-05-03soldstatus $93,000
-
2000-09-01soldstatus $69,750
-
1991-06-18soldstatus $53,000
-
1991-06-14soldstatus $52,750
ⓘ Source: listings_history table (triggers on properties + properties_extension) + one-shot
backfill from property_details.listing_events for pre-trigger history.
Tax reassessment forecast IL · Partial reset (capped growth)
- Current annual tax
- $3,358 · $280/mo
- Projected year-2 tax
- $4,221 · $352/mo
- Expected delta
- +$863/yr (+$72/mo · 25.7%)
ⓘ Screening estimate from a state-policy table — verify with the county assessor before closing.
Climate risk First Street
- Flood 1/10 Low FEMA zone X (unshaded) · 0% chance over 30 yrs
- Wildfire 1/10 Low
- Heat 3/10 Moderate 7 d/yr ≥103°F today · 15 d/yr by 30 yrs out
- Wind 2/10 Low
- Air quality 4/10 Moderate 4 unhealthy d/yr today · 6 by 30 yrs out
Nearby sold comps map
Loading sold comps map…
Walkable amenities ~0.75 mi
Loading nearby amenities…
Taxation est. · year 1
- Rental income
- $27,803
- − Mortgage interest
- −$12,547
- − Property taxes
- −$3,358
- − Insurance
- −$1,120
- − Repairs & maintenance
- −$2,224
- − Management
- −$2,224
- − HOA
- −$2,424
- − Depreciation
- −$6,516
- Taxable loss
- −$2,612
- Est. tax savings @ 24.0%
- +$627
- After-tax cash flow
- $1,593/yr
For passive investors: Depreciation is non-cash, so a rental often shows a tax loss while cash-flowing — sheltering income. Rental losses are passive: they offset passive income freely, and up to $25,000/yr can offset ordinary (W-2) income if you actively participate and your MAGI is under $100k (phasing out to $0 by $150k); unused losses carry forward. On sale, claimed depreciation is recaptured at up to 25%, and gains may owe capital-gains tax (a 1031 exchange can defer both). Figures are a year-1 estimate at your 24.0% rate — not tax advice; consult a CPA.
Schools (NCES district)
- District
- Valley View CUSD 365U
- NCES district ID
- 1740070
- Math proficiency
- 21% ▼ -15.00%
- Reading proficiency
- 28% ▼ -10.00%
- Median HH income
- $69,424
- Composite
- 23.48/100
- National rank
- #7875
- State rank
- #289 of 620 in IL
Livability — Bolingbrook
- Score
- 76/100
- State rank
- #199
- US rank
- #3692
Category grades
Schools grade is shown separately in the Schools card above.
Census & demographics
- Census place
- Bolingbrook, IL
- County
- Will County · 412,448 people
- City population
- 74,096
- Metro
- Chicago-Naperville-Elgin, IL-IN-WI
- Population (ZIP)
- 51,940
- Household income
- $93,494
- Rent vs Own
- Severe rent burden
- 1149.0
Population outlook (Will County) Hauer SSP2
- Today (2025)
- 705,368 people
- By 2030
- 708,154 · +0.4%
- By 2040
- 702,692 · -0.4%
- By 2050
- 680,249 · -3.6%
- By 2075
- 611,990 · -13.2%
- By 2100
- 516,215 · -26.8%
Race, ethnicity, and origin ACS 2023
- Neighborhood character
- Highly diverse neighborhood (Simpson 0.72)
- Race & ethnicity
- White 36% Hispanic / Latino 33% Black 19% Two or more races 15% Asian 10%
- Hispanic origin (detail)
- Mexican 30%
- Common ancestry
- Romanian 7% Lithuanian 1% Italian 1%
- Foreign-born
- 23% · Canada, China, South Korea
- Languages at home
- 62% English-only · Spanish 26% Other Indo-European 5% Tagalog/Filipino 2%
Political lean MEDSL · Will
- 2024 margin
- Toss-up / Even · D 50.1% · R 48.5% · Other 1.4%
- 2008→2024 swing
- -11.6pp toward R · 2008: 13.2pp · 2024: 1.6pp
- All cycles
- 2024: D+1.6 2020: D+8.3 2016: D+5.7 2012: D+3.7 2008: D+13.2
Not yet ingested
- Civics
- —
Market trends
- HPI YoY
- ▼ -256.14%
- Current HPI
- 246.1906
- Rent YoY
- ▲ 4.10%
- Metro
- Chicago-Naperville-Elgin, IL-IN-WI
- State GDP YoY
- ▲ 1.59%
- F500 in state
- 60
Industry mix (Fortune 500 HQ in IL)
| Industry | F500 HQs | Revenue |
|---|---|---|
| Insurance | 4 | $201B |
|
||
| Consumer Goods | 4 | $87B |
|
||
| Industrial Machinery | 3 | $64B |
|
||
| Healthcare | 2 | $55B |
|
||
| Retail / Pharmacy | 1 | $148B |
|
||
| Agriculture / Food | 1 | $86B |
|
||
Price history
+324.6% since first listed24 events — show timeline
- 2026-03-30 Listing Removed — MRED as Distributed by MLS Grid
- 2026-03-30 Listed $224,000 MRED as Distributed by MLS Grid
- 2026-03-19 Listing Removed — MRED as Distributed by MLS Grid
- 2026-03-19 Listed — MRED as Distributed by MLS Grid
- 2025-08-07 Sold (Public Records) $210,000 Public Records
- 2025-07-24 Sold (MLS) $210,000 MRED as Distributed by MLS Grid
- 2025-06-19 Contingent — MRED as Distributed by MLS Grid
- 2025-06-05 Listed $210,000 MRED as Distributed by MLS Grid
- 2022-06-23 Listed — MRED as Distributed by MLS Grid
- 2022-06-23 Listing Removed — MRED as Distributed by MLS Grid
- 2019-12-08 Listing Removed — MRED as Distributed by MLS Grid
- 2019-11-16 Listed — MRED as Distributed by MLS Grid
- 2019-06-21 Sold (Public Records) $135,000 Public Records
- 2019-05-28 Sold (MLS) $135,000 MRED as Distributed by MLS Grid
- 2019-05-16 Pending — MRED as Distributed by MLS Grid
- 2019-04-09 Contingent — MRED as Distributed by MLS Grid
- 2019-04-02 Relisted — MRED as Distributed by MLS Grid
- 2019-02-26 Relisted — MRED as Distributed by MLS Grid
- 2019-02-21 Listing Removed — MRED as Distributed by MLS Grid
- 2019-02-15 Listed $134,900 MRED as Distributed by MLS Grid
- 2002-05-03 Sold (Public Records) $93,000 Public Records
- 2000-09-01 Sold (Public Records) $69,750 Public Records
- 1991-06-18 Sold (Public Records) $53,000 Public Records
- 1991-06-14 Sold (Public Records) $52,750 Public Records
Property tax history
+2.0%/yrLatest (2024): $3,358 · +8.5% YoY. Source: county tax records.
Cash-flow waterfall
monthlySold comps — $/sqft
last 12 mo · ≤1 miLoading sold comps…