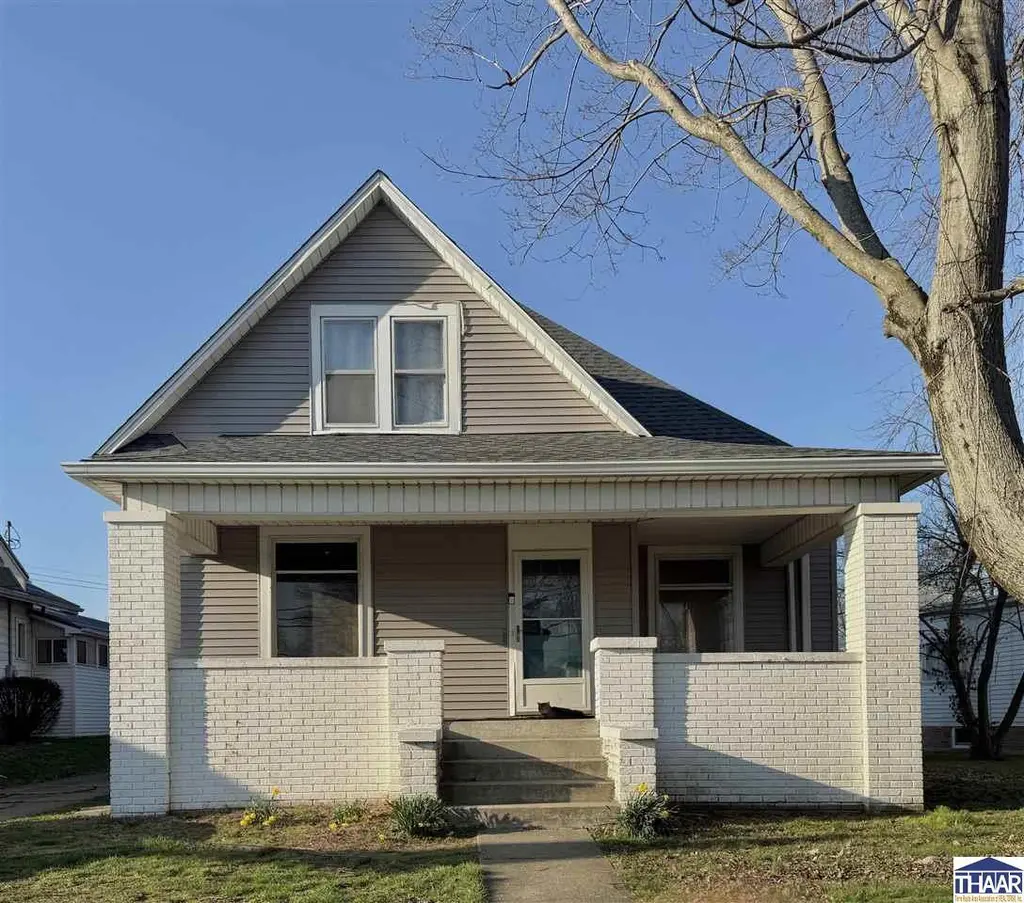
516 W Washington St · Sullivan, IN
Flood risk 1/10 · Minimal
- FEMA flood zone
- —
- Chance of flooding over 30 yrs
- 0.0%
- Est. flood insurance / yr
- —
Fire risk 1/10 · Minimal
- Est. fire insurance / yr
- $717 – $1,331
Heat risk 4/10 · Minor
- Hot days now (above 105°F)
- 7 days/yr
- Hot days in 30 yrs
- 19 days/yr
Wind risk 2/10 · Minimal
- Chance of severe wind over 30 yrs
- 1.0%
Air-quality risk 2/10 · Minimal
- Unhealthy air days now
- 1 days/yr
- Unhealthy air days in 30 yrs
- 2 days/yr
Risk factors via First Street. Map © Google.
Why this score? — see what drove the F grade
The composite is a weighted blend of 9 inputs, each scored 0–100. Each bar is that input's sub-score; the figure is the points it added to the 100-point composite (weight × sub-score).
- Cash flow +7.7/30.0
- Schools +3.5/10.0
- Livability +3.5/5.0
- Rent growth +2.5/5.0
- Condition / age +2.5/5.0
- DSCR +1.8/10.0
- 1% rule +1.3/10.0
- ARV discount +0.0/15.0
- Appreciation +0.0/10.0
$199,000
🖨 Deal sheet (PDF) 📄 Offer letter ✓ Due diligence
Listing remarks MLS
Charming 4 bedroom 2.5 bath Craftsman style home in the center of Sullivan. Enjoy the fireplace in the living room and the large covered front porch. This home is full of potential! REO Property. Property Sold AS-IS W/O Repair, Warranty or Seller Disclosure. The Listing Broker & Seller assume no responsibility & make no guarantees, warranties or representations as to the availability or accuracy of information contained herein. Buyer or Buyer's Agent is responsible for utility activation
Key facts
- Bonus room
- Large living room
- Updated flooring
Tags
Neighborhood map
What this means for you Summary
Snapshot
- This is a 2-bed/2.5-bath single-family listed at $199k.
Deal economics
- At list price, monthly cash flow is $-227 ($-3k/yr) — negative.
- To cash-flow at today's rent, offer at most $159k (20.2% below list).
- To meet the 1% rule (rent ≥ 1% of price), the offer needs to be $125k (37.0% below list).
- Recommended offer: $125k (37.0% below list) — sets the bar for 1% rule.
Location & tenants
- Location reads 70/100 on livability (#167 in IN) — a middle-class / working-renter tenant base. Strengths: cost of living A+, housing A+, health & safety A+; Watch: amenities F, commute F, employment D-.
- Southwest School Corporation (rural): math 40% / reading 42% proficiency, ranked #137 of 301 in IN (top 46%) — families likely to look elsewhere, expect single-tenant / working-renter base with shorter leases.
- Zoned schools: Sullivan Elementary School (math 43% / reading 40%, grade F, #478 of 994 statewide, top 49%, 663 students, 50% FRL); Sullivan Middle School (math 39% / reading 45%, grade D-, #102 of 330 statewide, top 32%, 298 students, 49% FRL); Sullivan High School (math 32% / reading 52%, grade F, #197 of 369 statewide, top 57%, 499 students, 46% FRL).
- Market conditions: 79 active listings in the ZIP; 4 units permitted in Sullivan County in 2024 (0 in 5+ unit buildings).
Forward outlook
- Local home prices are declining (-3.0%/yr); year-one equity from $1k of loan paydown is wiped out by about $6k of value loss. Plan a longer hold.
- Sullivan County population projected at -12% by 2050 — secular population decline; favor cash flow + early exit over multi-decade hold.
Negotiation context
- It's been on market 25 days — a 2% lower offer ($196k) is reasonable based on typical stale-listing flexibility.
- 2 sale attempts since 12y ago with the ask held roughly flat each time — persistent listings suggest the price (not the market) is what's stuck; bring a comps-based counter.
- Current owner paid $72k; list at $199k implies a 175% gain — meaningful room to come down on a strong offer.
Risks & watch-outs
- Watch-outs: built in 1906 — expect roof / HVAC / electrical / plumbing capex.
Questions for the listing agent
- What do current leases actually rent for vs. the listed asking? Can we see a recent rent roll and the last 12 months of T-12 income?
- Built in 1906 — when were the roof, HVAC, electrical panel, plumbing, and water heater last replaced?
- Is there a deadline driving the sale (1031 exchange, divorce, estate, relocation)? That informs how much negotiation room exists.
- Schools are D-rated, which usually means shorter tenancies and higher turnover. Who's the typical renter profile here, and what's been the actual vacancy rate?
- The area grade is low — what's the realistic commute time and amenity access for the typical tenant pool here? Any planned neighborhood developments (good or bad) we should know about?
- What's the average days-on-market for RENTAL listings here right now (not sales)? A rising rental-DOM trend means longer vacancies and softer asking-rent achievability than the comps imply.
- What's the recent tenant-quality profile in this submarket — average credit score on applications, eviction rate, late-payment / NSF rate, and stable-employment percentage? A property-management company in the area should have these aggregated.
- How much new for-sale + rental construction is in the pipeline within 1–3 miles? Heavy new supply typically softens prices + rents 12–24 months out; constrained supply supports both.
Investment metrics
- 1% rule
- 0.63% ✗
- Cap rate
- 4.92%
- Cash-on-cash
- -4.89%
- DSCR
- 0.78
- GRM
- 13.2
CMA / ARV
- ARV (on-the-fly)
- $168,372
- Comps found
- 12
Show comp detail 12 sales within ~0.75 mi
| Address | Dist | Beds/Ba | Sqft | Sold | Price | $/sf | Match |
|---|---|---|---|---|---|---|---|
| 105 N French St | 0.08mi | 2/2.0 | 1,520 (-2%) | 5mo | $67,500 | $44 | 86 |
| 524 W Sylvandell St | 0.18mi | 3/2.0 (+1) | 1,485 (-5%) | 1mo | $219,900 | $148 | 76 |
| 210 N West St | 0.16mi | 2/2.0 | 1,413 (-9%) | 2mo | $89,900 | $64 | 73 |
| 403 W Sylvandell St St | 0.27mi | 2/1.0 | 1,522 (-2%) | 6mo | $148,000 | $97 | 72 |
| 326 W Graysville St | 0.32mi | 3/2.0 (+1) | 1,500 (-4%) | 5mo | $183,250 | $122 | 68 |
| 339 N Broad St St | 0.68mi | 2/2.0 | 1,578 (+1%) | 0mo | $169,900 | $108 | 64 |
| 419 S Bell St St | 0.40mi | 3/2.0 (+1) | 1,363 (-13%) | 3mo | $230,000 | $169 | 51 |
| 119 S Crowder St | 0.33mi | 3/1.0 (+1) | 1,475 (-5%) | 18mo | $138,000 | $94 | 50 |
| 804 N Court St St | 0.67mi | 3/2.0 (+1) | 1,495 (-4%) | 7mo | $70,000 | $47 | 49 |
| 306 N State St St | 0.60mi | 2/1.0 | 1,421 (-9%) | 3mo | $154,900 | $109 | 49 |
| 320 E Washington St | 0.72mi | 3/2.0 (+1) | 1,426 (-8%) | 1mo | $269,599 | $189 | 44 |
| 324 S State St | 0.63mi | 3/1.0 (+1) | 1,713 (+10%) | 4mo | $133,500 | $78 | 39 |
Match score weights: distance 35% · size 25% · config 20% · recency 20%. Top-matched comps best support the ARV.
Projected returns pro-forma
-3.0% appreciation · 3.0% rent growth · sell at horizon
- IRR
- -24.7%
- Equity multiple
- 0.16×
- Total profit
- $-46,799
- Equity at exit
- $29,672
- IRR
- -20.5%
- Equity multiple
- -0.07×
- Total profit
- $-59,707
- Equity at exit
- $17,206
Cash invested: $55,720 (down + closing). Projections, not guarantees.
Landlord ↔ Tenant lean methodology
- Overall (STATE)
- 90 Strongly Landlord-Friendly
- State Indiana
- 90 Strongly Landlord-Friendly · R+11
- County
- — inherits STATE
- City
- — inherits STATE
ZIP-level market 47882
- Home prices YoY
- -11.1%
- Active inventory
- 79
- Price-to-rent
- 13.2×
Monthly cashflow live
- Estimated rent
- $1,253 medium interval (Pro) →
- Mortgage (P&I)
- −$1,044
- Tax from tax record
- −$91 /mo · $1,087/yr
- Insurance
- −$83
- HOA
- −$0
- Vacancy / Maint / Mgmt
- −$263
- Net cashflow
- $-227
Break-even live
Sensitivity live
| Price | -10% $-115 | -5% $-171 | +0% $-227 | +5% $-284 | +10% $-340 |
|---|---|---|---|---|---|
| Rent | -10% $-326 | -5% $-277 | +0% $-227 | +5% $-178 | +10% $-128 |
| Rate | -1.0pp $-127 | -0.5pp $-177 | base $-227 | +0.5pp $-279 | +1.0pp $-331 |
UW: 25.0% down · 7.5% · 30yr · 1.5% tax · 5.0% vac · 8.0% maint · 8.0% mgmt
Financing live
Cash to close
- Down payment
- $49,750
- Closing costs
- $5,970
- Reserves months
- —
- Total cash needed
- —
Loan-product check · same deal, 3 products live
Conventional
25% down · 7.5% · 30yr
- Down + closing
- —
- Monthly P&I
- —
- Monthly cashflow
- —
- DSCR
- —
- Eligible?
- —
Personal DTI + credit; lowest rate.
DSCR
20% down · 8.5% · 30yr
- Down + closing
- —
- Monthly P&I
- —
- Monthly cashflow
- —
- DSCR
- —
- Eligible?
- —
No personal income docs; deal must DSCR.
Hard money
10% down · 12.0% · 12mo
- Down + closing
- —
- Monthly P&I
- —
- Monthly cashflow
- —
- DSCR
- —
- Eligible?
- —
Short-term bridge; refi at stabilization.
Listing history 5 events
-
2026-04-14status Pending
-
2026-03-20$199,000 Active
-
2015-02-02soldstatus $72,404 508-char remark
Show marketing remark (508 chars)
Charming 4 bedroom 2.5 bath Craftsman style home in the center of Sullivan. Enjoy the fireplace in the living room and the large covered front porch. This home is full of potential! REO Property. Property Sold AS-IS W/O Repair, Warranty or Seller Disclosure. The Listing Broker & Seller assume no responsibility & make no guarantees, warranties or representations as to the availability or accuracy of information contained herein. Buyer or Buyer's Agent is responsible for utility activation
-
2014-10-17$74,500 508-char remark
Show marketing remark (508 chars)
Charming 4 bedroom 2.5 bath Craftsman style home in the center of Sullivan. Enjoy the fireplace in the living room and the large covered front porch. This home is full of potential! REO Property. Property Sold AS-IS W/O Repair, Warranty or Seller Disclosure. The Listing Broker & Seller assume no responsibility & make no guarantees, warranties or representations as to the availability or accuracy of information contained herein. Buyer or Buyer's Agent is responsible for utility activation
-
2003-11-13soldstatus $90,000
ⓘ Source: listings_history table (triggers on properties + properties_extension) + one-shot
backfill from property_details.listing_events for pre-trigger history.
Tax reassessment forecast IN · Partial reset (capped growth)
- Current annual tax
- $1,087 · $91/mo
- Projected year-2 tax
- $1,389 · $116/mo
- Expected delta
- +$302/yr (+$25/mo · 27.8%)
ⓘ Screening estimate from a state-policy table — verify with the county assessor before closing.
Climate risk First Street
- Flood 1/10 Low 0% chance over 30 yrs
- Wildfire 1/10 Low
- Heat 4/10 Moderate 7 d/yr ≥105°F today · 19 d/yr by 30 yrs out
- Wind 2/10 Low 100% chance of damaging wind over 30 yrs
- Air quality 2/10 Low 1 unhealthy d/yr today · 2 by 30 yrs out
Nearby sold comps map
Loading sold comps map…
Walkable amenities ~0.75 mi
Loading nearby amenities…
Taxation est. · year 1
- Rental income
- $15,035
- − Mortgage interest
- −$11,147
- − Property taxes
- −$1,087
- − Insurance
- −$995
- − Repairs & maintenance
- −$1,203
- − Management
- −$1,203
- − Depreciation
- −$5,789
- Taxable loss
- −$6,389
- Est. tax savings @ 24.0%
- +$1,533
- After-tax cash flow
- $-1,194/yr
For passive investors: Depreciation is non-cash, so a rental often shows a tax loss while cash-flowing — sheltering income. Rental losses are passive: they offset passive income freely, and up to $25,000/yr can offset ordinary (W-2) income if you actively participate and your MAGI is under $100k (phasing out to $0 by $150k); unused losses carry forward. On sale, claimed depreciation is recaptured at up to 25%, and gains may owe capital-gains tax (a 1031 exchange can defer both). Figures are a year-1 estimate at your 24.0% rate — not tax advice; consult a CPA.
Schools (NCES district)
- District
- Southwest School Corporation
- NCES district ID
- 1810860
- Math proficiency
- 40% ▼ -10.00%
- Reading proficiency
- 42% ▼ -9.00%
- Median HH income
- $43,624
- Composite
- 34.71/100
- National rank
- #5136
- State rank
- #137 of 301 in IN
Livability — Sullivan
- Score
- 70/100
- State rank
- #167
- US rank
- #7960
Category grades
Schools grade is shown separately in the Schools card above.
Census & demographics
- Census place
- Sullivan, IN
- City population
- 8,494
- Population (ZIP)
- 8,494
Population outlook (Sullivan County) Hauer SSP2
- Today (2025)
- 20,313 people
- By 2030
- 19,908 · -2.0%
- By 2040
- 19,009 · -6.4%
- By 2050
- 17,972 · -11.5%
- By 2075
- 14,929 · -26.5%
- By 2100
- 11,391 · -43.9%
Race, ethnicity, and origin ACS 2023
- Neighborhood character
- Predominantly White (95%)
- Race & ethnicity
- White 95% Two or more races 3%
- Common ancestry
- Italian 2% Slovak 2% Iranian 2%
- Foreign-born
- 1% · China
- Languages at home
- 99% English-only · Spanish 1%
Political lean MEDSL · Sullivan
- 2024 margin
- Solid R (+52.7) · D 22.8% · R 75.5% · Other 1.7%
- 2008→2024 swing
- -52.0pp toward R · 2008: -0.7pp · 2024: -52.7pp
- All cycles
- 2024: R+52.7 2020: R+50.5 2016: R+47.0 2012: R+20.6 2008: R+0.7
Not yet ingested
- Civics
- —
Market trends
- HPI YoY
- ▼ -23.79%
- Current HPI
- 190.5334
- Rent YoY
- —
- Metro
- —
- State GDP YoY
- ▲ 2.90%
- F500 in state
- 18
Industry mix (Fortune 500 HQ in IN)
| Industry | F500 HQs | Revenue |
|---|---|---|
| Industrial Machinery | 2 | $37B |
|
||
| Healthcare | 1 | $177B |
|
||
| Pharmaceuticals | 1 | $45B |
|
||
| Metals / Steel | 1 | $18B |
|
||
| Agriculture | 1 | $17B |
|
||
| Packaging | 1 | $12B |
|
||
Price history
+121.1% since first listed5 events — show timeline
- 2026-04-14 Pending — THAAR
- 2026-03-20 Listed $199,000 THAAR
- 2015-02-02 Sold (MLS) $72,404 MIBOR as Distributed by MLS Grid
- 2014-10-17 Listed $74,500 MIBOR as Distributed by MLS Grid
- 2003-11-13 Sold (Public Records) $90,000 Public Records
Property tax history
+5.3%/yrLatest (2024): $1,087 · +34.0% YoY. Source: county tax records.
Cash-flow waterfall
monthlySold comps — $/sqft
last 12 mo · ≤1 miLoading sold comps…