 Duplex
7920 Albany Ave · Lubbock, TX
Flood risk 1/10 · Minimal
- FEMA flood zone
- X (unshaded)
- Chance of flooding over 30 yrs
- 0.0%
- Est. flood insurance / yr
- $507 – $1,088
Fire risk 1/10 · Minimal
- Est. fire insurance / yr
- $1,222 – $2,270
Heat risk 5/10 · Moderate
- Hot days now (above 99°F)
- 7 days/yr
- Hot days in 30 yrs
- 21 days/yr
Wind risk 2/10 · Minimal
- Chance of severe wind over 30 yrs
- —
Air-quality risk 2/10 · Minimal
- Unhealthy air days now
- 1 days/yr
- Unhealthy air days in 30 yrs
- 1 days/yr
Risk factors via First Street. Map © Google.
Why this score? — see what drove the C- grade
The composite is a weighted blend of 9 inputs, each scored 0–100. Each bar is that input's sub-score; the figure is the points it added to the 100-point composite (weight × sub-score).
- Cash flow +19.4/30.0
- ARV discount +7.5/15.0
- DSCR +6.1/10.0
- 1% rule +5.4/10.0
- Livability +4.0/5.0
- Rent growth +3.2/5.0
- Schools +3.1/10.0
- Condition / age +2.5/5.0
- Appreciation +0.0/10.0
$310,000
🖨 Deal sheet 📄 Offer letter ✓ Due diligence
Multi-family units
County records classify this as Multi-Family (2-4 Unit). Listing-text estimate: 2 units. confirmed
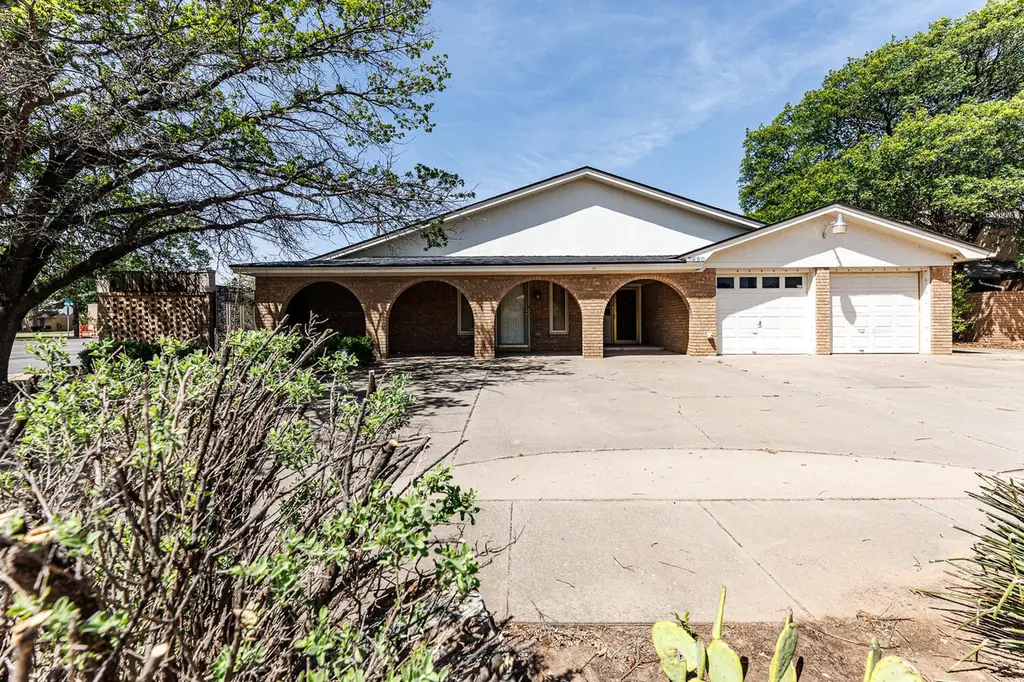
Listing remarks MLS
Large duplex in South Lubbock located in Farrar Estates! Side A features 3 bedrooms, 2 bathrooms, and a 2-car garage. Side B offers 3 bedrooms, 2.5 bathrooms, 2-car garage plus an office, perfect for extra space or working from home. The property has a newer roof, and Side B is move-in ready with fresh interior paint and brand-new carpet. Don't miss this great investment opportunity or owner-occupant option!
Key facts
- Office space
- Newer roof
- Fresh interior paint
Tags
Neighborhood map
What this means for you Summary
Snapshot
- This is a 2 × 3.0-bed/2.5-bath units multifamily listed at $310k.
Deal economics
- At list price, monthly cash flow is $348 ($4k/yr) — positive. Per door: $174/mo.
- The deal already cash-flows at list — no discount required.
- Meets the 1% rule at list price ($3k rent vs $310k).
- Recommended offer: $301k (3.0% below list) — sets the bar for market timing.
Location & tenants
- Location reads 80/100 on livability (#37 in TX, #1,749 nationally) — a professional / high-income tenant draw. Strengths: commute A+, cost of living A+, housing A+; Watch: employment C-, schools D+, crime F.
- Lubbock ISD (urban): math 36% / reading 39% proficiency, ranked #481 of 826 in TX (top 58%) — families likely to look elsewhere, expect single-tenant / working-renter base with shorter leases; 60% free/reduced lunch — lower-income household profile, screen leases tightly.
- Market conditions: Rents rising (+2.8%/yr); 705 active listings in the ZIP; solid renter incomes; 2,219 units permitted in Lubbock County in 2024 (252 in 5+ unit buildings).
- This rent runs 40% of the median local income ($97k/yr) — at the standard rent-burdened threshold; future hikes will face affordability resistance.
Forward outlook
- Local home prices are declining (-3.0%/yr); year-one equity from $2k of loan paydown is wiped out by about $9k of value loss. Plan a longer hold.
- Lubbock County population projected at +39% by 2050 — long-run rental-demand tailwind backs the buy-and-hold thesis.
Negotiation context
- It's been on market 45 days — a 3% lower offer ($301k) is reasonable based on typical stale-listing flexibility.
- 2 sale attempts since 8y ago with the ask held roughly flat each time — persistent listings suggest the price (not the market) is what's stuck; bring a comps-based counter.
Risks & watch-outs
- Climate carrying-cost: extreme-heat days projected 7→21/yr by 2055 (HVAC capex compounding) — expect insurance premiums to compound above CPI over the hold.
Questions for the listing agent
- It's been on market 45 days. Have you received any prior offers? Is the seller open to a 3% concession, seller financing, or rate buy-down credit?
- Can we see the unit-by-unit rent roll, current vacancy, and any below-market leases? What's the average tenancy length?
- What capital expenditures (roof, boiler, parking lot, exteriors) have been made in the last 5 years, and what's planned in the next 2?
- Built in 1979 — when were the roof, HVAC, electrical panel, plumbing, and water heater last replaced?
- Is there a deadline driving the sale (1031 exchange, divorce, estate, relocation)? That informs how much negotiation room exists.
- Schools are D-rated, which usually means shorter tenancies and higher turnover. Who's the typical renter profile here, and what's been the actual vacancy rate?
- Crime grade is F in this area — have there been break-ins, vandalism, or insurance claims at this property in the last 3 years? What carrier currently insures it and at what premium?
- What's the average days-on-market for RENTAL listings here right now (not sales)? A rising rental-DOM trend means longer vacancies and softer asking-rent achievability than the comps imply.
- What's the recent tenant-quality profile in this submarket — average credit score on applications, eviction rate, late-payment / NSF rate, and stable-employment percentage? A property-management company in the area should have these aggregated.
- How much new apartment / multifamily construction is in the pipeline within 1–3 miles? Heavy new supply (>2% of stock underway) typically softens rents 12–24 months out; light construction supports rent growth.
Investment metrics
- 1% rule
- 1.04% ✓
- Cap rate
- 7.64%
- Cash-on-cash
- 4.81%
- DSCR
- 1.21
- GRM
- 8.0
CMA / ARV
No comps found within radius.
Projected returns pro-forma
-3.0% appreciation · 2.75% rent growth · sell at horizon
- IRR
- -9.1%
- Equity multiple
- 0.67×
- Total profit
- $-28,780
- Equity at exit
- $46,222
- IRR
- 0.1%
- Equity multiple
- 1.01×
- Total profit
- $534
- Equity at exit
- $26,803
Cash invested: $86,800 (down + closing). Projections, not guarantees.
Landlord ↔ Tenant lean methodology
- Overall (STATE)
- 87 Strongly Landlord-Friendly
- State Texas
- 87 Strongly Landlord-Friendly · R+5
- County
- — inherits STATE
- City
- — inherits STATE
ZIP-level market 79424
- Rents YoY
- 2.8%
- Active inventory
- 705
- Price-to-rent
- 16.0×
Monthly cashflow live
- Estimated rent
- $3,226 high interval (Pro) →
- Mortgage (P&I)
- −$1,626
- Tax from tax record
- −$445 /mo · $5,346/yr
- Insurance
- −$129
- HOA
- −$0
- Vacancy / Maint / Mgmt
- −$677
- Net cashflow
- $348
Break-even live
2-unit breakdown (identical units grouped — click to expand)
| Units | Beds | Baths | Est. rent |
|---|---|---|---|
| 2× units | 3.0 | 2.5 | $3,226 |
| #1 | 3.0 | 2.5 | $1,613 |
| #2 | 3.0 | 2.5 | $1,613 |
| Total (2 units) | $3,226 | ||
UW: 25.0% down · 7.5% · 30yr · 1.5% tax · 5.0% vac · 8.0% maint · 8.0% mgmt
Financing live
Cash to close
- Down payment
- $77,500
- Closing costs
- $9,300
- Reserves months
- —
- Total cash needed
- —
Loan-product check · same deal, 3 products live
Conventional
25% down · 7.5% · 30yr
- Down + closing
- —
- Monthly P&I
- —
- Monthly cashflow
- —
- DSCR
- —
- Eligible?
- —
Personal DTI + credit; lowest rate.
DSCR
20% down · 8.5% · 30yr
- Down + closing
- —
- Monthly P&I
- —
- Monthly cashflow
- —
- DSCR
- —
- Eligible?
- —
No personal income docs; deal must DSCR.
Hard money
10% down · 12.0% · 12mo
- Down + closing
- —
- Monthly P&I
- —
- Monthly cashflow
- —
- DSCR
- —
- Eligible?
- —
Short-term bridge; refi at stabilization.
Listing history 8 events
-
2026-06-01status $310,000 Pending 45 DOM
-
2026-05-31days on market $310,000 Active 45 DOM
-
2026-05-30days on market $310,000 Active 44 DOM
-
2026-04-16$310,000 Active 412-char remark
Show marketing remark (412 chars)
Large duplex in South Lubbock located in Farrar Estates! Side A features 3 bedrooms, 2 bathrooms, and a 2-car garage. Side B offers 3 bedrooms, 2.5 bathrooms, 2-car garage plus an office, perfect for extra space or working from home. The property has a newer roof, and Side B is move-in ready with fresh interior paint and brand-new carpet. Don't miss this great investment opportunity or owner-occupant option!
-
2019-01-17soldstatus
-
2019-01-16soldstatus 529-char remark
Show marketing remark (529 chars)
Don't miss this duplex opportunity with a great location! This well maintained property offers 3 bedrooms with office or extra bedroom on side B with 2.5 baths and 3 bedrooms 2 bath on side A. Very little yard maintenance with a full concrete lot. 2 car garage included for both units. Hard to find, act fast! Call or text me to schedule a time to see this duplex! Property sold AS-IS, measurements and square footage are not guaranteed accurate. Buyers are advised to perform their own measurements if exact footage is required.
-
2018-12-11$219,900 529-char remark
Show marketing remark (529 chars)
Don't miss this duplex opportunity with a great location! This well maintained property offers 3 bedrooms with office or extra bedroom on side B with 2.5 baths and 3 bedrooms 2 bath on side A. Very little yard maintenance with a full concrete lot. 2 car garage included for both units. Hard to find, act fast! Call or text me to schedule a time to see this duplex! Property sold AS-IS, measurements and square footage are not guaranteed accurate. Buyers are advised to perform their own measurements if exact footage is required.
-
1992-11-01soldstatus
ⓘ Source: listings_history table (triggers on properties + properties_extension) + one-shot
backfill from property_details.listing_events for pre-trigger history.
Tax reassessment forecast TX · Resets to sale price
- Current annual tax
- $5,346 · $445/mo
- Projected year-2 tax
- $5,673 · $473/mo
- Expected delta
- +$327/yr (+$27/mo · 6.1%)
ⓘ Screening estimate from a state-policy table — verify with the county assessor before closing.
Climate risk First Street
- Flood 1/10 Low FEMA zone X (unshaded) · 0% chance over 30 yrs
- Wildfire 1/10 Low
- Heat 5/10 Major 7 d/yr ≥99°F today · 21 d/yr by 30 yrs out
- Wind 2/10 Low
- Air quality 2/10 Low 1 unhealthy d/yr today · 1 by 30 yrs out
Nearby sold comps map
Loading sold comps map…
Walkable amenities ~0.75 mi
Loading nearby amenities…
Taxation est. · year 1
- Rental income
- $38,712
- − Mortgage interest
- −$17,365
- − Property taxes
- −$5,346
- − Insurance
- −$1,550
- − Repairs & maintenance
- −$3,097
- − Management
- −$3,097
- − Depreciation
- −$9,018
- Taxable loss
- −$761
- Est. tax savings @ 24.0%
- +$183
- After-tax cash flow
- $4,361/yr
For passive investors: Depreciation is non-cash, so a rental often shows a tax loss while cash-flowing — sheltering income. Rental losses are passive: they offset passive income freely, and up to $25,000/yr can offset ordinary (W-2) income if you actively participate and your MAGI is under $100k (phasing out to $0 by $150k); unused losses carry forward. On sale, claimed depreciation is recaptured at up to 25%, and gains may owe capital-gains tax (a 1031 exchange can defer both). Figures are a year-1 estimate at your 24.0% rate — not tax advice; consult a CPA.
Schools (NCES district)
- District
- Lubbock ISD
- NCES district ID
- 4828500
- Math proficiency
- 36% ▼ -8.00%
- Reading proficiency
- 39% ▼ -1.00%
- Median HH income
- $39,820
- Composite
- 31.44/100
- National rank
- #5984
- State rank
- #481 of 826 in TX
Livability — Lubbock
- Score
- 80/100
- State rank
- #37
- US rank
- #1749
Category grades
Schools grade is shown separately in the Schools card above.
Census & demographics
- Census place
- Lubbock, TX
- County
- Lubbock County · 293,542 people
- City population
- 283,030
- Metro
- Lubbock, TX
- Population (ZIP)
- 53,478
- Household income
- $97,231
- Rent vs Own
- Severe rent burden
- 1958.0
Population outlook (Lubbock County) Hauer SSP2
- Today (2025)
- 345,960 people
- By 2030
- 371,449 · +7.4%
- By 2040
- 424,539 · +22.7%
- By 2050
- 481,150 · +39.1%
- By 2075
- 633,467 · +83.1%
- By 2100
- 746,853 · +115.9%
Race, ethnicity, and origin ACS 2023
- Neighborhood character
- Predominantly White (71%)
- Race & ethnicity
- White 71% Hispanic / Latino 21% Two or more races 12% Asian 3% Black 2%
- Hispanic origin (detail)
- Mexican 17%
- Common ancestry
- Slovak 2% Italian 2% Lithuanian 1%
- Foreign-born
- 6% · Canada, China
- Languages at home
- 88% English-only · Spanish 8% Chinese 1% Tagalog/Filipino 1%
Political lean MEDSL · Lubbock
- 2024 margin
- Solid R (+39.5) · D 29.7% · R 69.2% · Other 1.0%
- 2008→2024 swing
- -2.8pp toward R · 2008: -36.7pp · 2024: -39.5pp
- All cycles
- 2024: R+39.5 2020: R+32.2 2016: R+38.4 2012: R+40.9 2008: R+36.7
Not yet ingested
- Civics
- —
Market trends
- HPI YoY
- ▼ -146.64%
- Current HPI
- 213.2155
- Rent YoY
- ▲ 2.75%
- Metro
- Lubbock, TX
- State GDP YoY
- ▲ 3.95%
- F500 in state
- 110
Industry mix (Fortune 500 HQ in TX)
| Industry | F500 HQs | Revenue |
|---|---|---|
| Energy | 16 | $1,198B |
|
||
| Technology | 5 | $198B |
|
||
| Engineering / Construction | 4 | $72B |
|
||
| Energy Services | 3 | $60B |
|
||
| Utilities | 3 | $41B |
|
||
| Healthcare | 2 | $330B |
|
||
Price history
+41.0% since first listed5 events — show timeline
- 2026-04-16 Listed $310,000 LARMLS
- 2019-01-17 Sold (Public Records) — Public Records
- 2019-01-16 Sold (MLS) — LARMLS
- 2018-12-11 Listed $219,900 LARMLS
- 1992-11-01 Sold (Public Records) — Public Records
Property tax history
+3.6%/yrLatest (2025): $5,346 · -2.6% YoY. Source: county tax records.
Cash-flow waterfall
monthlySold comps — $/sqft
last 12 mo · ≤1 miLoading sold comps…