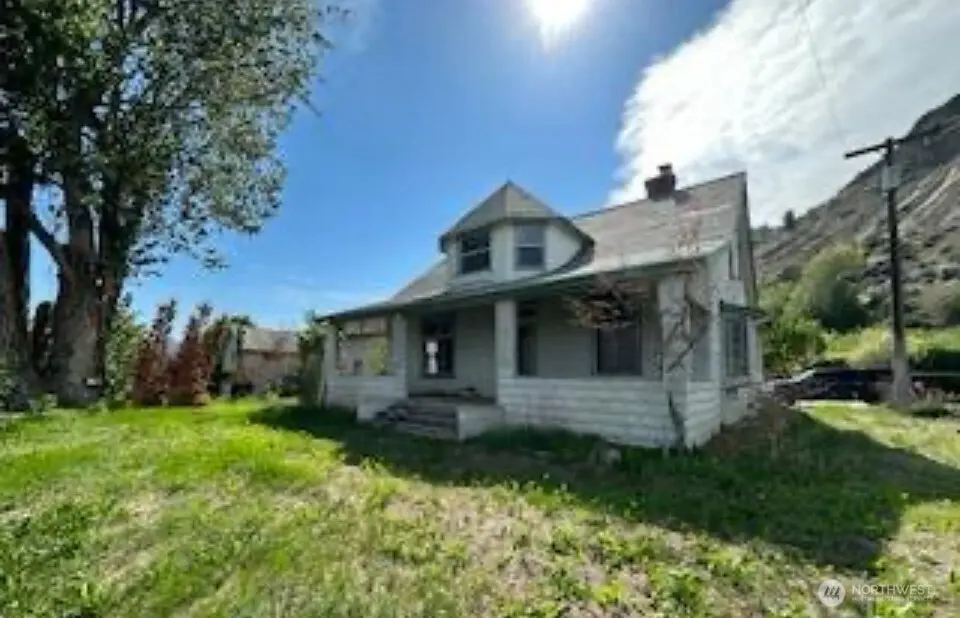
193 Golden Rd · Oroville, WA
Flood risk 1/10 · Minimal
- FEMA flood zone
- X
- Chance of flooding over 30 yrs
- 0.0%
- Est. flood insurance / yr
- $473 – $860
Fire risk 6/10 · Moderate
- Est. fire insurance / yr
- $604 – $1,122
Heat risk 4/10 · Minor
- Hot days now (above 97°F)
- 7 days/yr
- Hot days in 30 yrs
- 15 days/yr
Wind risk 1/10 · Minimal
- Chance of severe wind over 30 yrs
- —
Air-quality risk 10/10 · Severe
- Unhealthy air days now
- 29 days/yr
- Unhealthy air days in 30 yrs
- 32 days/yr
Risk factors via First Street. Map © Google.
Why this score? — see what drove the B- grade
The composite is a weighted blend of 9 inputs, each scored 0–100. Each bar is that input's sub-score; the figure is the points it added to the 100-point composite (weight × sub-score).
- Cash flow +30.0/30.0
- 1% rule +10.0/10.0
- DSCR +10.0/10.0
- ARV discount +7.5/15.0
- Schools +3.5/10.0
- Livability +3.2/5.0
- Rent growth +2.5/5.0
- Condition / age +2.5/5.0
- Appreciation +0.0/10.0
$49,900
🖨 Deal sheet (PDF) 📄 Offer letter ✓ Due diligence
Listing remarks
This is a very unique opportunity for the creative & ambitious! This 100+ year old home sits on a an acre parcel w/ fantastic views of the valley, city, river & Canada! This home is a restorationist's dream! Numerous areas are unaltered from the original finishes, like doors, moldings, railings, & flooring. The partially finished basement lends itself to many ideas & options. An addition was started so there is a separate meter allowing for a separate living space! Heating is Geothermal but will need work. High ceilings add to the appeal of this vintage home as does the very quaint, covered porch. This truly could be the find of your lifetime! You will need to insta
Key facts
- Covered porch
- Original finishes
- Geothermal heating
Tags
Neighborhood map
What this means for you Summary
Snapshot
- This is a 3-bed/2.0-bath single-family listed at $50k.
Deal economics
- At list price, monthly cash flow is $639 ($8k/yr) — positive.
- The deal already cash-flows at list — no discount required.
- Meets the 1% rule at list price ($1k rent vs $50k).
- Recommended offer: $44k (12.0% below list) — sets the bar for market timing.
- Cap rate 21.7% vs local median 1.4% in Oroville — top-decile yield for the area; either an underpriced asset or a hidden risk that comps aren't pricing in. Stress-test before assuming the spread holds.
Location & tenants
- Location reads 63/100 on livability (#389 in WA) — a middle-class / working-renter tenant base. Strengths: cost of living A+, crime A-, housing B+; Watch: health & safety C-, amenities F, commute F.
- Oroville School District (rural): math 34% / reading 46% proficiency, ranked #228 of 291 in WA (top 78%) — families likely to look elsewhere, expect single-tenant / working-renter base with shorter leases; 64% free/reduced lunch — lower-income household profile, screen leases tightly.
- Zoned schools: Oroville Elementary (277 students, 77% FRL); Oroville Middle-High School (253 students, 75% FRL).
- Market conditions: 181 active listings in the ZIP; 234 units permitted in Okanogan County in 2024 (0 in 5+ unit buildings).
Forward outlook
- Local home prices are declining (-3.0%/yr); year-one equity from $345 of loan paydown is wiped out by about $1k of value loss. Plan a longer hold.
- Okanogan County population projected at -12% by 2050 — secular population decline; favor cash flow + early exit over multi-decade hold.
- At projected returns (-3.0% appreciation + 3.0% rent growth), your $14k cash investment doubles in ~3 years — after that, you're playing with house money.
Negotiation context
- It's been on market 400 days — a 12% lower offer ($44k) is reasonable based on typical stale-listing flexibility.
- 3 sale attempts; this cycle's ask has dropped $130k (72%) from the opening price — seller is motivated, your offer sets the floor, not the list.
Risks & watch-outs
- Watch-outs: built in 1913 — expect roof / HVAC / electrical / plumbing capex.
- Climate carrying-cost: major wildfire risk — expect insurance premiums to compound above CPI over the hold.
Questions for the listing agent
- It's been on market 400 days. Have you received any prior offers? Is the seller open to a 12% concession, seller financing, or rate buy-down credit?
- Built in 1913 — when were the roof, HVAC, electrical panel, plumbing, and water heater last replaced?
- Why hasn't it sold? Are there any deal-killer items the seller is aware of (foundation, flood, title, zoning, code violations)?
- Is there a deadline driving the sale (1031 exchange, divorce, estate, relocation)? That informs how much negotiation room exists.
- Schools are F-rated, which usually means shorter tenancies and higher turnover. Who's the typical renter profile here, and what's been the actual vacancy rate?
- What's the average days-on-market for RENTAL listings here right now (not sales)? A rising rental-DOM trend means longer vacancies and softer asking-rent achievability than the comps imply.
- What's the recent tenant-quality profile in this submarket — average credit score on applications, eviction rate, late-payment / NSF rate, and stable-employment percentage? A property-management company in the area should have these aggregated.
- How much new for-sale + rental construction is in the pipeline within 1–3 miles? Heavy new supply typically softens prices + rents 12–24 months out; constrained supply supports both.
Investment metrics
- 1% rule
- 2.60% ✓
- Cap rate
- 21.67%
- Cash-on-cash
- 54.92%
- DSCR
- 3.44
- GRM
- 3.2
CMA / ARV
No comps found within radius.
Projected returns pro-forma
-3.0% appreciation · 3.0% rent growth · sell at horizon
- IRR
- 53.2%
- Equity multiple
- 3.34×
- Total profit
- $32,688
- Equity at exit
- $7,440
- IRR
- 58.4%
- Equity multiple
- 6.80×
- Total profit
- $81,088
- Equity at exit
- $4,314
Cash invested: $13,972 (down + closing). Projections, not guarantees.
Landlord ↔ Tenant lean methodology
- Overall (STATE)
- 28 Tenant-Leaning
- State Washington
- 28 Tenant-Leaning · D+8
- County
- — inherits STATE
- City
- — inherits STATE
ZIP-level market 98844
- Active inventory
- 181
- Price-to-rent
- 3.2×
Monthly cashflow live
- Estimated rent
- $1,296 medium interval (Pro) →
- Mortgage (P&I)
- −$262
- Tax from tax record
- −$102 /mo · $1,221/yr
- Insurance
- −$21
- HOA
- −$0
- Vacancy / Maint / Mgmt
- −$272
- Net cashflow
- $639
Break-even live
Sensitivity live
| Price | -10% $668 | -5% $654 | +0% $639 | +5% $625 | +10% $611 |
|---|---|---|---|---|---|
| Rent | -10% $537 | -5% $588 | +0% $639 | +5% $691 | +10% $742 |
| Rate | -1.0pp $665 | -0.5pp $652 | base $639 | +0.5pp $627 | +1.0pp $613 |
UW: 25.0% down · 7.5% · 30yr · 1.5% tax · 5.0% vac · 8.0% maint · 8.0% mgmt
Financing live
Cash to close
- Down payment
- $12,475
- Closing costs
- $1,497
- Reserves months
- —
- Total cash needed
- —
Loan-product check · same deal, 3 products live
Conventional
25% down · 7.5% · 30yr
- Down + closing
- —
- Monthly P&I
- —
- Monthly cashflow
- —
- DSCR
- —
- Eligible?
- —
Personal DTI + credit; lowest rate.
DSCR
20% down · 8.5% · 30yr
- Down + closing
- —
- Monthly P&I
- —
- Monthly cashflow
- —
- DSCR
- —
- Eligible?
- —
No personal income docs; deal must DSCR.
Hard money
10% down · 12.0% · 12mo
- Down + closing
- —
- Monthly P&I
- —
- Monthly cashflow
- —
- DSCR
- —
- Eligible?
- —
Short-term bridge; refi at stabilization.
Listing history 17 events
-
2026-06-07statusdays on market $49,900 Pending 400 DOM
-
2026-06-03days on market $49,900 Active 398 DOM
-
2026-06-02days on market $49,900 Active 397 DOM
-
2026-06-01days on market $49,900 Active 396 DOM
-
2026-05-31days on market $49,900 Active 395 DOM
-
2026-04-03status Active
-
2026-03-10price $99,900
-
2026-01-15price $109,900
-
2025-11-25price $124,900
-
2025-10-16price $134,900
-
2025-08-09price $149,900
-
2025-07-23status Active
-
2025-07-18historical
-
2025-07-02price $169,900
-
2025-05-29price $174,900
-
2025-04-26$179,900 Active
-
1993-06-22soldstatus $100,000
ⓘ Source: listings_history table (triggers on properties + properties_extension) + one-shot
backfill from property_details.listing_events for pre-trigger history.
Tax reassessment forecast WA · Resets to sale price
- Current annual tax
- $1,221 · $102/mo
- Projected year-2 tax
- $1,221 · $102/mo
- Expected delta
- $0/yr ($0/mo · 0.0%)
ⓘ Screening estimate from a state-policy table — verify with the county assessor before closing.
Climate risk First Street
- Flood 1/10 Low FEMA zone X · 0% chance over 30 yrs
- Wildfire 6/10 Major
- Heat 4/10 Moderate 7 d/yr ≥97°F today · 15 d/yr by 30 yrs out
- Wind 1/10 Low
- Air quality 10/10 Extreme 29 unhealthy d/yr today · 32 by 30 yrs out
Nearby sold comps map
Loading sold comps map…
Walkable amenities ~0.75 mi
Loading nearby amenities…
Taxation est. · year 1
- Rental income
- $15,550
- − Mortgage interest
- −$2,795
- − Property taxes
- −$1,221
- − Insurance
- −$250
- − Repairs & maintenance
- −$1,244
- − Management
- −$1,244
- − Depreciation
- −$1,452
- Taxable income
- $7,345
- Est. tax owed @ 24.0%
- −$1,763
- After-tax cash flow
- $5,911/yr
For passive investors: Depreciation is non-cash, so a rental often shows a tax loss while cash-flowing — sheltering income. Rental losses are passive: they offset passive income freely, and up to $25,000/yr can offset ordinary (W-2) income if you actively participate and your MAGI is under $100k (phasing out to $0 by $150k); unused losses carry forward. On sale, claimed depreciation is recaptured at up to 25%, and gains may owe capital-gains tax (a 1031 exchange can defer both). Figures are a year-1 estimate at your 24.0% rate — not tax advice; consult a CPA.
Schools (NCES district)
- District
- Oroville School District
- NCES district ID
- 5306420
- Math proficiency
- 34% ▼ -5.00%
- Reading proficiency
- 46% ▬ 0.00%
- Median HH income
- $34,641
- Composite
- 35.43/100
- National rank
- #9774
- State rank
- #228 of 291 in WA
Livability — Oroville
- Score
- 63/100
- State rank
- #389
- US rank
- #15388
Category grades
Schools grade is shown separately in the Schools card above.
Census & demographics
- Population (ZIP)
- 4,814
Population outlook (Okanogan County) Hauer SSP2
- Today (2025)
- 40,288 people
- By 2030
- 39,265 · -2.5%
- By 2040
- 37,110 · -7.9%
- By 2050
- 35,389 · -12.2%
- By 2075
- 31,609 · -21.5%
- By 2100
- 26,647 · -33.9%
Race, ethnicity, and origin ACS 2023
- Neighborhood character
- Predominantly White (74%)
- Race & ethnicity
- White 74% Hispanic / Latino 15% Two or more races 9% Black 2% Native American 2%
- Hispanic origin (detail)
- Mexican 14%
- Common ancestry
- Italian 3% Iranian 2% Lithuanian 2%
- Foreign-born
- 11% · Canada
- Languages at home
- 88% English-only · Spanish 11%
Political lean MEDSL · Okanogan
- 2024 margin
- R (+15.0) · D 41.1% · R 56.0% · Other 2.9%
- 2008→2024 swing
- -8.0pp toward R · 2008: -7.0pp · 2024: -15.0pp
- All cycles
- 2024: R+15.0 2020: R+13.8 2016: R+21.3 2012: R+14.8 2008: R+7.0
Not yet ingested
- Civics
- —
Market trends
- HPI YoY
- ▼ -91.28%
- Current HPI
- 164.8058
- Rent YoY
- —
- Metro
- —
- State GDP YoY
- ▲ 4.65%
- F500 in state
- 22
Industry mix (Fortune 500 HQ in WA)
| Industry | F500 HQs | Revenue |
|---|---|---|
| Retail | 2 | $269B |
|
||
| Technology / Retail | 1 | $638B |
|
||
| Technology | 1 | $245B |
|
||
| Telecommunications | 1 | $38B |
|
||
| Food / Beverage | 1 | $36B |
|
||
| Automotive / Trucks | 1 | $34B |
|
||
Price history
-0.1% since first listed12 events — show timeline
- 2026-04-03 Relisted — NWMLS as Distributed by MLS Grid
- 2026-03-10 Price Changed $99,900 NWMLS as Distributed by MLS Grid
- 2026-01-15 Price Changed $109,900 NWMLS as Distributed by MLS Grid
- 2025-11-25 Price Changed $124,900 NWMLS as Distributed by MLS Grid
- 2025-10-16 Price Changed $134,900 NWMLS as Distributed by MLS Grid
- 2025-08-09 Price Changed $149,900 NWMLS as Distributed by MLS Grid
- 2025-07-23 Relisted — NWMLS as Distributed by MLS Grid
- 2025-07-18 Delisted — NWMLS as Distributed by MLS Grid
- 2025-07-02 Price Changed $169,900 NWMLS as Distributed by MLS Grid
- 2025-05-29 Price Changed $174,900 NWMLS as Distributed by MLS Grid
- 2025-04-26 Listed $179,900 NWMLS as Distributed by MLS Grid
- 1993-06-22 Sold (Public Records) $100,000 Public Records
Property tax history
-6.6%/yrLatest (2026): $1,221 · -52.7% YoY. Source: county tax records.
Cash-flow waterfall
monthlySold comps — $/sqft
last 12 mo · ≤1 miLoading sold comps…