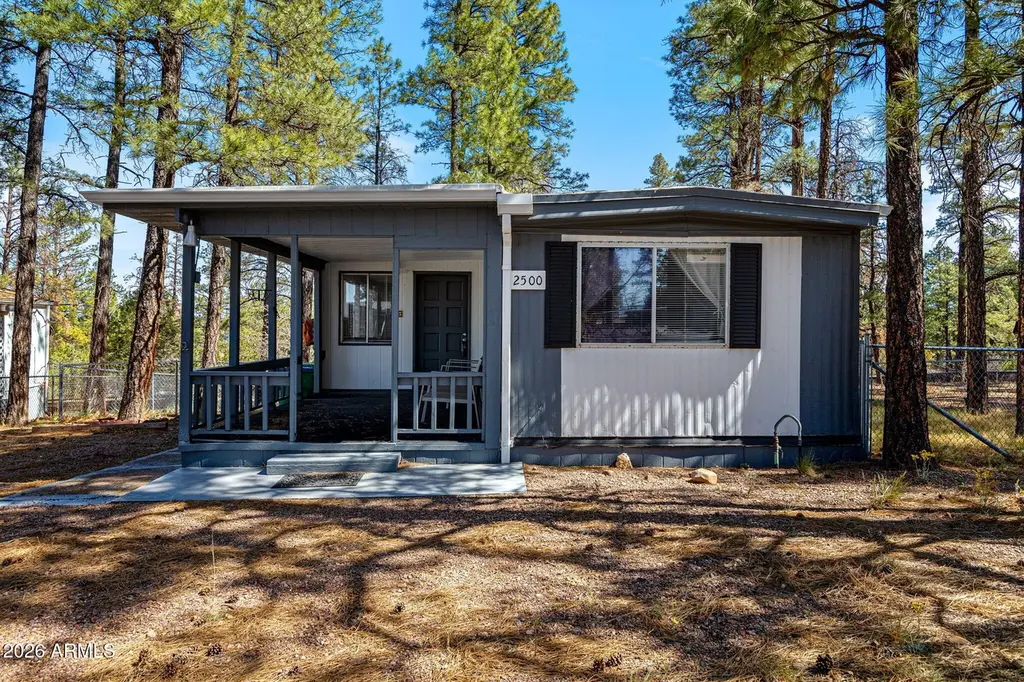
2500 W Savage -- · Show Low, AZ
Flood risk 1/10 · Minimal
- FEMA flood zone
- X (unshaded)
- Chance of flooding over 30 yrs
- 0.0%
- Est. flood insurance / yr
- $507 – $1,088
Fire risk 5/10 · Moderate
- Est. fire insurance / yr
- $610 – $1,132
Heat risk 2/10 · Minimal
- Hot days now (above 89°F)
- 7 days/yr
- Hot days in 30 yrs
- 18 days/yr
Wind risk 1/10 · Minimal
- Chance of severe wind over 30 yrs
- —
Air-quality risk 2/10 · Minimal
- Unhealthy air days now
- 1 days/yr
- Unhealthy air days in 30 yrs
- 1 days/yr
Risk factors via First Street. Map © Google.
Why this score? — see what drove the C+ grade
The composite is a weighted blend of 9 inputs, each scored 0–100. Each bar is that input's sub-score; the figure is the points it added to the 100-point composite (weight × sub-score).
- Cash flow +24.4/30.0
- ARV discount +15.0/15.0
- DSCR +7.9/10.0
- 1% rule +5.0/10.0
- Livability +3.2/5.0
- Schools +3.0/10.0
- Rent growth +2.5/5.0
- Condition / age +2.5/5.0
- Appreciation +0.0/10.0
$169,000
🖨 Deal sheet (PDF) 📄 Offer letter ✓ Due diligence
Listing remarks MLS
Fully furnished charming 2 bedroom, plus office, 1-bath manufactured home in the desirable Fool Hollow Lake area of Show Low. This 940 sq ft single-level home offers a functional layout with a cozy living space, dining area, and included appliances, as well as a full size stack washer and dryer. Situated on a ~0.14-acre lot with mature pine trees, the property features a deck, small workshop, and RV hookup--perfect for weekend getaways or full-time living. Built in 1973 with new forced air gas heat and central air conditioning. This home provides a peaceful mountain setting just minutes from outdoor recreation, fishing, and hiking plus it is a short walk to Fools Hollow Lake. No HOA and plenty of open parking. Great opportunity for investment or retreat!
Key facts
- 5,849 sq ft lot
- Built 1973
- Listed 44 days
Neighborhood map
What this means for you Summary
Snapshot
- This is a 2-bed/1.0-bath manufactured listed at $169k.
Deal economics
- At list price, monthly cash flow is $343 ($4k/yr) — positive.
- The deal already cash-flows at list — no discount required.
- Meets the 1% rule at list price ($2k rent vs $169k).
- Recommended offer: $164k (3.0% below list) — sets the bar for market timing.
- Cap rate 8.7% vs local median 3.3% in Show Low — top-decile yield for the area; either an underpriced asset or a hidden risk that comps aren't pricing in. Stress-test before assuming the spread holds.
Location & tenants
- Location reads 65/100 on livability (#90 in AZ) — a middle-class / working-renter tenant base. Strengths: cost of living A+, housing A+; Watch: employment D, crime F, amenities F.
- Show Low Unified District (4393) (rural): math 32% / reading 39% proficiency, ranked #89 of 249 in AZ (top 36%) — families likely to look elsewhere, expect single-tenant / working-renter base with shorter leases.
- Zoned schools: Whipple Ranch Elementary School (404 students, 50% FRL); Show Low Junior High School (math 29% / reading 34%, grade F, #78 of 218 statewide, top 36%, 587 students, 45% FRL); Show Low High School (math 22% / reading 37%, grade F, #120 of 381 statewide, top 34%, 877 students, 31% FRL).
- Market conditions: 897 active listings in the ZIP; 485 units permitted in Navajo County in 2024 (11 in 5+ unit buildings).
Forward outlook
- Local home prices are declining (-3.0%/yr); year-one equity from $1k of loan paydown is wiped out by about $5k of value loss. Plan a longer hold.
- Navajo County population projected at -16% by 2050 — secular population decline; favor cash flow + early exit over multi-decade hold.
Negotiation context
- It's been on market 44 days — a 3% lower offer ($164k) is reasonable based on typical stale-listing flexibility.
- Current owner paid $65k; list at $169k implies a 160% gain — meaningful room to come down on a strong offer.
Risks & watch-outs
- Climate carrying-cost: moderate wildfire risk — expect insurance premiums to compound above CPI over the hold.
Questions for the listing agent
- It's been on market 44 days. Have you received any prior offers? Is the seller open to a 3% concession, seller financing, or rate buy-down credit?
- Built in 1973 — when were the roof, HVAC, electrical panel, plumbing, and water heater last replaced?
- Is there a deadline driving the sale (1031 exchange, divorce, estate, relocation)? That informs how much negotiation room exists.
- Schools are B-rated — typically a magnet for longer-tenancy family renters. What's the average tenant stay here, and is there a school-zone premium baked into asking?
- Crime grade is F in this area — have there been break-ins, vandalism, or insurance claims at this property in the last 3 years? What carrier currently insures it and at what premium?
- What's the average days-on-market for RENTAL listings here right now (not sales)? A rising rental-DOM trend means longer vacancies and softer asking-rent achievability than the comps imply.
- What's the recent tenant-quality profile in this submarket — average credit score on applications, eviction rate, late-payment / NSF rate, and stable-employment percentage? A property-management company in the area should have these aggregated.
- How much new for-sale + rental construction is in the pipeline within 1–3 miles? Heavy new supply typically softens prices + rents 12–24 months out; constrained supply supports both.
Investment metrics
- 1% rule
- 1.00% ✓
- Cap rate
- 8.73%
- Cash-on-cash
- 8.69%
- DSCR
- 1.39
- GRM
- 8.3
CMA / ARV
- ARV (median comp)
- $206,560
- List price
- $169,000
- Delta
- -18.18%
- Verdict
- UNDERPRICED
- Comps
- 4 within 1.0 mi
Show comp detail 5 sales within ~0.75 mi
| Address | Dist | Beds/Ba | Sqft | Sold | Price | $/sf | Match |
|---|---|---|---|---|---|---|---|
| 2500 W Savage -- | 0.00mi | 2/1.0 | 940 (0%) | 1mo | $153,000 | $163 | 100 |
| 2330 W Sylvester Cir | 0.16mi | 2/2.0 | 952 (+1%) | 22mo | $135,000 | $142 | 68 |
| 2401 W Savage | 0.08mi | 3/2.0 (+1) | 1,024 (+9%) | 11mo | $270,000 | $264 | 64 |
| 2441 W Thornton Rd | 0.20mi | 3/2.0 (+1) | 900 (-4%) | 15mo | $215,000 | $239 | 62 |
| 2380 W Rogers Loop Dr | 0.17mi | 3/1.0 (+1) | 980 (+4%) | 21mo | $150,000 | $153 | 62 |
Match score weights: distance 35% · size 25% · config 20% · recency 20%. Top-matched comps best support the ARV.
Projected returns pro-forma
-3.0% appreciation · 3.0% rent growth · sell at horizon
- IRR
- -3.2%
- Equity multiple
- 0.88×
- Total profit
- $-5,631
- Equity at exit
- $25,198
- IRR
- 6.5%
- Equity multiple
- 1.48×
- Total profit
- $22,883
- Equity at exit
- $14,612
Cash invested: $47,320 (down + closing). Projections, not guarantees.
Landlord ↔ Tenant lean methodology
- Overall (STATE)
- 87 Strongly Landlord-Friendly
- State Arizona
- 87 Strongly Landlord-Friendly · R+3
- County
- — inherits STATE
- City
- — inherits STATE
ZIP-level market 85901
- Home prices YoY
- -14.5%
- Active inventory
- 897
- Price-to-rent
- 8.3×
Monthly cashflow live
- Estimated rent
- $1,691 medium interval (Pro) →
- Mortgage (P&I)
- −$886
- Tax from tax record
- −$37 /mo · $441/yr
- Insurance
- −$70
- HOA
- −$0
- Vacancy / Maint / Mgmt
- −$355
- Net cashflow
- $343
Break-even live
Sensitivity live
| Price | -10% $439 | -5% $391 | +0% $343 | +5% $295 | +10% $247 |
|---|---|---|---|---|---|
| Rent | -10% $209 | -5% $276 | +0% $343 | +5% $410 | +10% $476 |
| Rate | -1.0pp $428 | -0.5pp $386 | base $343 | +0.5pp $299 | +1.0pp $255 |
UW: 25.0% down · 7.5% · 30yr · 1.5% tax · 5.0% vac · 8.0% maint · 8.0% mgmt
Financing live
Cash to close
- Down payment
- $42,250
- Closing costs
- $5,070
- Reserves months
- —
- Total cash needed
- —
Loan-product check · same deal, 3 products live
Conventional
25% down · 7.5% · 30yr
- Down + closing
- —
- Monthly P&I
- —
- Monthly cashflow
- —
- DSCR
- —
- Eligible?
- —
Personal DTI + credit; lowest rate.
DSCR
20% down · 8.5% · 30yr
- Down + closing
- —
- Monthly P&I
- —
- Monthly cashflow
- —
- DSCR
- —
- Eligible?
- —
No personal income docs; deal must DSCR.
Hard money
10% down · 12.0% · 12mo
- Down + closing
- —
- Monthly P&I
- —
- Monthly cashflow
- —
- DSCR
- —
- Eligible?
- —
Short-term bridge; refi at stabilization.
Listing history 8 events
-
2026-05-19price $169,000 766-char remark
Show marketing remark (766 chars)
Fully furnished charming 2 bedroom, plus office, 1-bath manufactured home in the desirable Fool Hollow Lake area of Show Low. This 940 sq ft single-level home offers a functional layout with a cozy living space, dining area, and included appliances, as well as a full size stack washer and dryer. Situated on a ~0.14-acre lot with mature pine trees, the property features a deck, small workshop, and RV hookup--perfect for weekend getaways or full-time living. Built in 1973 with new forced air gas heat and central air conditioning. This home provides a peaceful mountain setting just minutes from outdoor recreation, fishing, and hiking plus it is a short walk to Fools Hollow Lake. No HOA and plenty of open parking. Great opportunity for investment or retreat!
-
2026-04-09$189,000 Active 766-char remark
Show marketing remark (766 chars)
Fully furnished charming 2 bedroom, plus office, 1-bath manufactured home in the desirable Fool Hollow Lake area of Show Low. This 940 sq ft single-level home offers a functional layout with a cozy living space, dining area, and included appliances, as well as a full size stack washer and dryer. Situated on a ~0.14-acre lot with mature pine trees, the property features a deck, small workshop, and RV hookup--perfect for weekend getaways or full-time living. Built in 1973 with new forced air gas heat and central air conditioning. This home provides a peaceful mountain setting just minutes from outdoor recreation, fishing, and hiking plus it is a short walk to Fools Hollow Lake. No HOA and plenty of open parking. Great opportunity for investment or retreat!
-
2022-01-10soldstatus $65,000
-
2017-08-14soldstatus $50,000 194-char remark
Show marketing remark (194 chars)
3 bedroom/2 bathroom fully furnished home and so close to Fool Hollow Lake. Great views and lots of room for friends and summer toys. It has an RV hookup and a little workshop behind the house.
-
2017-08-14soldstatus $50,000
Show marketing remark (194 chars)
3 bedroom/2 bathroom fully furnished home and so close to Fool Hollow Lake. Great views and lots of room for friends and summer toys. It has an RV hookup and a little workshop behind the house.
-
2015-08-21soldstatus $49,000
-
2015-08-21soldstatus $49,000
-
2001-12-20soldstatus $49,000
ⓘ Source: listings_history table (triggers on properties + properties_extension) + one-shot
backfill from property_details.listing_events for pre-trigger history.
Tax reassessment forecast AZ · Resets to sale price
- Current annual tax
- $441 · $37/mo
- Projected year-2 tax
- $1,115 · $93/mo
- Expected delta
- +$675/yr (+$56/mo · 153.1%)
ⓘ Screening estimate from a state-policy table — verify with the county assessor before closing.
Climate risk First Street
- Flood 1/10 Low FEMA zone X (unshaded) · 0% chance over 30 yrs
- Wildfire 5/10 Major
- Heat 2/10 Low 7 d/yr ≥89°F today · 18 d/yr by 30 yrs out
- Wind 1/10 Low
- Air quality 2/10 Low 1 unhealthy d/yr today · 1 by 30 yrs out
Nearby sold comps map
Loading sold comps map…
Walkable amenities ~0.75 mi
Loading nearby amenities…
Taxation est. · year 1
- Rental income
- $20,297
- − Mortgage interest
- −$9,467
- − Property taxes
- −$441
- − Insurance
- −$845
- − Repairs & maintenance
- −$1,624
- − Management
- −$1,624
- − Depreciation
- −$4,916
- Taxable income
- $1,381
- Est. tax owed @ 24.0%
- −$331
- After-tax cash flow
- $3,783/yr
For passive investors: Depreciation is non-cash, so a rental often shows a tax loss while cash-flowing — sheltering income. Rental losses are passive: they offset passive income freely, and up to $25,000/yr can offset ordinary (W-2) income if you actively participate and your MAGI is under $100k (phasing out to $0 by $150k); unused losses carry forward. On sale, claimed depreciation is recaptured at up to 25%, and gains may owe capital-gains tax (a 1031 exchange can defer both). Figures are a year-1 estimate at your 24.0% rate — not tax advice; consult a CPA.
Schools (NCES district)
- District
- Show Low Unified District (4393)
- NCES district ID
- 0407700
- Math proficiency
- 32% ▼ -9.00%
- Reading proficiency
- 39% ▼ -4.00%
- Median HH income
- $41,240
- Composite
- 29.9/100
- National rank
- #6387
- State rank
- #89 of 249 in AZ
Livability — Show Low
- Score
- 65/100
- State rank
- #90
- US rank
- #13573
Category grades
Schools grade is shown separately in the Schools card above.
Census & demographics
- Census place
- Show Low, AZ
- City population
- 18,821
- Population (ZIP)
- 18,821
Population outlook (Navajo County) Hauer SSP2
- Today (2025)
- 105,760 people
- By 2030
- 103,301 · -2.3%
- By 2040
- 97,070 · -8.2%
- By 2050
- 88,850 · -16.0%
- By 2075
- 65,180 · -38.4%
- By 2100
- 37,281 · -64.7%
Race, ethnicity, and origin ACS 2023
- Neighborhood character
- Predominantly White (77%)
- Race & ethnicity
- White 77% Hispanic / Latino 16% Two or more races 11% Native American 2%
- Hispanic origin (detail)
- Mexican 12%
- Common ancestry
- Slovak 2% Lithuanian 2% Italian 2%
- Foreign-born
- 4% · Canada
- Languages at home
- 92% English-only · Spanish 7% Tagalog/Filipino 1%
Political lean MEDSL · Navajo
- 2024 margin
- R (+17.2) · D 40.9% · R 58.1%
- 2008→2024 swing
- -5.5pp toward R · 2008: -11.7pp · 2024: -17.2pp
- All cycles
- 2024: R+17.2 2020: R+8.2 2016: R+7.9 2012: R+8.4 2008: R+11.7
Not yet ingested
- Civics
- —
Market trends
- HPI YoY
- ▼ -65.52%
- Current HPI
- 386.3007
- Rent YoY
- —
- Metro
- —
- State GDP YoY
- ▲ 4.54%
- F500 in state
- 20
Industry mix (Fortune 500 HQ in AZ)
| Industry | F500 HQs | Revenue |
|---|---|---|
| Technology | 2 | $13B |
|
||
| Mining / Metals | 1 | $23B |
|
||
| Environmental Services | 1 | $16B |
|
||
| Metals / Steel | 1 | $14B |
|
||
| Technology Distribution | 1 | $9B |
|
||
| Homebuilding | 1 | $8B |
|
||
Price history
+244.9% since first listed8 events — show timeline
- 2026-05-19 Price Changed $169,000 ARMLS
- 2026-04-09 Listed $189,000 ARMLS
- 2022-01-10 Sold (Public Records) $65,000 Public Records
- 2017-08-14 Sold (Public Records) $50,000 Public Records
- 2017-08-14 Sold (MLS) $50,000 WMMLS
- 2015-08-21 Sold (Public Records) $49,000 Public Records
- 2015-08-21 Sold (MLS) $49,000 WMMLS
- 2001-12-20 Sold (Public Records) $49,000 Public Records
Property tax history
+1.1%/yrLatest (2025): $441 · +4.0% YoY. Source: county tax records.
Cash-flow waterfall
monthlySold comps — $/sqft
last 12 mo · ≤1 miLoading sold comps…