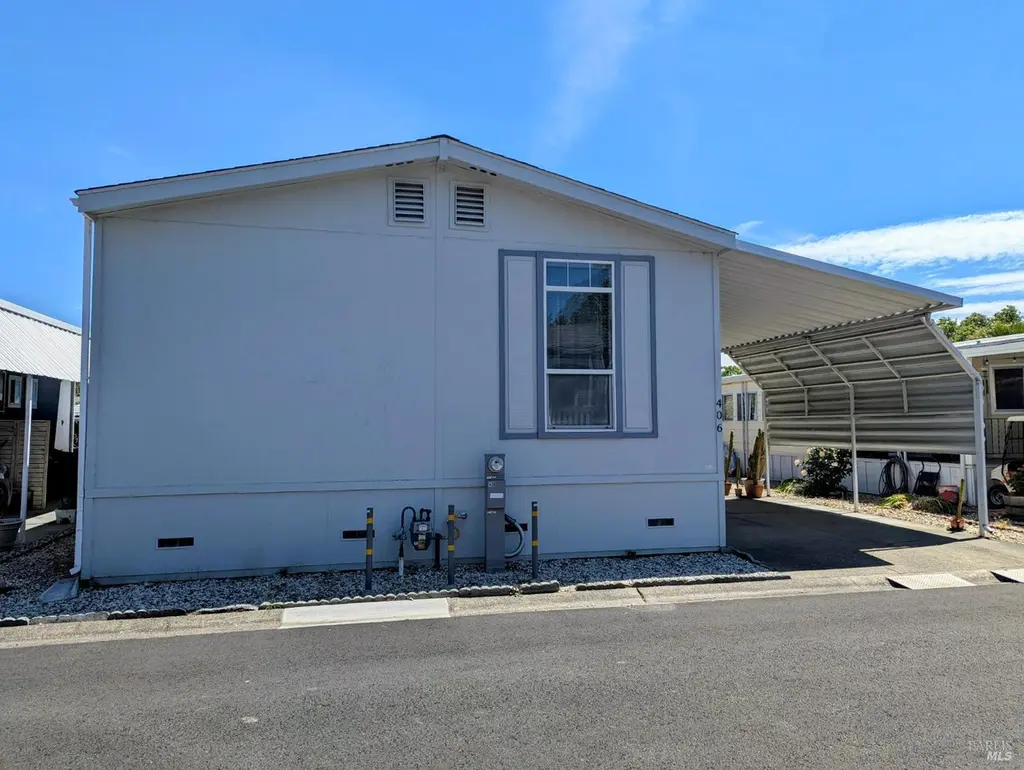
406 Burgundy N · Calistoga, CA
Flood risk 1/10 · Minimal
- FEMA flood zone
- X (unshaded)
- Chance of flooding over 30 yrs
- 0.0%
- Est. flood insurance / yr
- $507 – $1,088
Fire risk 4/10 · Minor
- Est. fire insurance / yr
- $659 – $1,223
Heat risk 5/10 · Moderate
- Hot days now (above 100°F)
- 8 days/yr
- Hot days in 30 yrs
- 17 days/yr
Wind risk 1/10 · Minimal
- Chance of severe wind over 30 yrs
- —
Air-quality risk 10/10 · Severe
- Unhealthy air days now
- 29 days/yr
- Unhealthy air days in 30 yrs
- 30 days/yr
Risk factors via First Street. Map © Google.
Why this score? — see what drove the C+ grade
The composite is a weighted blend of 9 inputs, each scored 0–100. Each bar is that input's sub-score; the figure is the points it added to the 100-point composite (weight × sub-score).
- Cash flow +30.0/30.0
- 1% rule +10.0/10.0
- DSCR +10.0/10.0
- Schools +3.9/10.0
- Livability +3.2/5.0
- Rent growth +2.5/5.0
- Condition / age +2.5/5.0
- ARV discount +0.0/15.0
- Appreciation +0.0/10.0
$249,000
🖨 Deal sheet (PDF) 📄 Offer letter ✓ Due diligence
Listing remarks MLS
This 2005 home is situated on a quiet cul-de-sac in Chateau Calistoga, a 55+ community located near downtown Calistoga. The home features a large great room, kitchen with custom cabinetry, three bedrooms, two baths in 1344 square feet of living space. Outdoor patio and raised garden beds. Park offers a community clubhouse, pool & spa for your year round enjoyment.
Key facts
- 2 parking spots
- Built 2005
- Listed 64 days
Neighborhood map
What this means for you Summary
Snapshot
- This is a 3-bed/2.0-bath manufactured listed at $249k.
Deal economics
- At list price, monthly cash flow is $2k ($18k/yr) — positive.
- The deal already cash-flows at list — no discount required.
- Meets the 1% rule at list price ($4k rent vs $249k).
- Recommended offer: $234k (6.0% below list) — sets the bar for market timing.
- Cap rate 13.5% vs local median 2.4% in Calistoga — top-decile yield for the area; either an underpriced asset or a hidden risk that comps aren't pricing in. Stress-test before assuming the spread holds.
Location & tenants
- Location reads 63/100 on livability (#448 in CA) — a middle-class / working-renter tenant base. Strengths: health & safety A+, employment A-; Watch: amenities F, commute F, cost of living F.
- Calistoga Joint Unified (town): math 33% / reading 51% proficiency, ranked #624 of 1,400 in CA (top 45%) — families likely to look elsewhere, expect single-tenant / working-renter base with shorter leases.
- Zoned schools: Calistoga Elementary (412 students, 82% FRL); Calistoga Junior/Senior High (380 students, 80% FRL) — zoned schools average 81% FRL vs 58% district-wide (23 pts higher); higher-poverty schools than district average — tighter screening recommended.
- Market conditions: 107 active listings in the ZIP; 3 comparable units currently listed for rent nearby; rentals at typical pace (median 15d on market — plan ~3-4 weeks tenant-placement turnaround); 427 units permitted in Napa County in 2024 (189 in 5+ unit buildings).
Forward outlook
- Local home prices are declining (-3.0%/yr); year-one equity from $2k of loan paydown is wiped out by about $7k of value loss. Plan a longer hold.
- Napa County population projected at +14% by 2050 — modest demand growth; plan on rents tracking national, not racing it.
- At projected returns (-3.0% appreciation + 3.0% rent growth), your $70k cash investment doubles in ~5 years — after that, you're playing with house money.
Negotiation context
- It's been on market 65 days — a 6% lower offer ($234k) is reasonable based on typical stale-listing flexibility.
Risks & watch-outs
- Climate carrying-cost: extreme-heat days projected 8→17/yr by 2055 (HVAC capex compounding) — expect insurance premiums to compound above CPI over the hold.
Questions for the listing agent
- It's been on market 65 days. Have you received any prior offers? Is the seller open to a 6% concession, seller financing, or rate buy-down credit?
- Why hasn't it sold? Are there any deal-killer items the seller is aware of (foundation, flood, title, zoning, code violations)?
- Is there a deadline driving the sale (1031 exchange, divorce, estate, relocation)? That informs how much negotiation room exists.
- Schools are D-rated, which usually means shorter tenancies and higher turnover. Who's the typical renter profile here, and what's been the actual vacancy rate?
- What's the average days-on-market for RENTAL listings here right now (not sales)? A rising rental-DOM trend means longer vacancies and softer asking-rent achievability than the comps imply.
- What's the recent tenant-quality profile in this submarket — average credit score on applications, eviction rate, late-payment / NSF rate, and stable-employment percentage? A property-management company in the area should have these aggregated.
- How much new for-sale + rental construction is in the pipeline within 1–3 miles? Heavy new supply typically softens prices + rents 12–24 months out; constrained supply supports both.
Investment metrics
- 1% rule
- 1.50% ✓
- Cap rate
- 13.55%
- Cash-on-cash
- 25.90%
- DSCR
- 2.15
- GRM
- 5.5
CMA / ARV
- ARV (median comp)
- $199,000
- List price
- $249,000
- Delta
- 25.13%
- Verdict
- OVERPRICED
- Comps
- 8 within 1.0 mi
Show comp detail 12 sales within ~0.75 mi
| Address | Dist | Beds/Ba | Sqft | Sold | Price | $/sf | Match |
|---|---|---|---|---|---|---|---|
| 512 Sherry N #245 | 0.02mi | 3/2.0 | 1,284 (-4%) | 4mo | $280,000 | $218 | 89 |
| 320 Chablis N | 0.05mi | 2/2.0 (-1) | 1,440 (+7%) | 3mo | $165,000 | $115 | 78 |
| 937 Champagne Cir S | 0.16mi | 2/2.0 (-1) | 1,248 (-7%) | 2mo | $198,000 | $159 | 74 |
| 218 Champagne Cir W | 0.07mi | 2/2.0 (-1) | 1,440 (+7%) | 12mo | $130,000 | $90 | 70 |
| 703 Claret S | 0.14mi | 2/2.0 (-1) | 1,440 (+7%) | 9mo | $149,000 | $103 | 69 |
| 33 Magnolia Dr | 0.21mi | 2/2.0 (-1) | 1,440 (+7%) | 8mo | $206,000 | $143 | 67 |
| 819 E Champagne | 0.15mi | 3/2.0 | 1,536 (+14%) | 9mo | $325,000 | $212 | 62 |
| 516 Sherry St N #244 | 0.02mi | 2/2.0 (-1) | 1,536 (+14%) | 13mo | $262,500 | $171 | 60 |
| 37 Magnolia Dr | 0.21mi | 2/2.0 (-1) | 1,536 (+14%) | 5mo | $200,000 | $130 | 58 |
| 4 Camellia Dr | 0.30mi | 2/2.0 (-1) | 1,440 (+7%) | 14mo | $115,000 | $80 | 57 |
| 921 Champagne St S | 0.12mi | 2/2.0 (-1) | 1,488 (+11%) | 18mo | $168,000 | $113 | 56 |
| 219 Champagne W | 0.08mi | 2/2.0 (-1) | 1,152 (-14%) | 14mo | $170,000 | $148 | 56 |
Match score weights: distance 35% · size 25% · config 20% · recency 20%. Top-matched comps best support the ARV.
Projected returns pro-forma
-3.0% appreciation · 3.0% rent growth · sell at horizon
- IRR
- 19.6%
- Equity multiple
- 1.79×
- Total profit
- $55,399
- Equity at exit
- $37,127
- IRR
- 27.8%
- Equity multiple
- 3.46×
- Total profit
- $171,236
- Equity at exit
- $21,529
Cash invested: $69,720 (down + closing). Projections, not guarantees.
Landlord ↔ Tenant lean methodology
- Overall (STATE)
- 18 Strongly Tenant-Friendly
- State California
- 18 Strongly Tenant-Friendly · D+13
- County
- — inherits STATE
- City
- — inherits STATE
ZIP-level market 94515
- Active inventory
- 107
- Price-to-rent
- 5.5×
Monthly cashflow live
- Estimated rent
- $3,747 medium interval (Pro) →
- Mortgage (P&I)
- −$1,306
- Tax from tax record
- −$46 /mo · $551/yr
- Insurance
- −$104
- HOA
- −$0
- Vacancy / Maint / Mgmt
- −$787
- Net cashflow
- $1,505
Break-even live
Sensitivity live
| Price | -10% $1,646 | -5% $1,575 | +0% $1,505 | +5% $1,435 | +10% $1,364 |
|---|---|---|---|---|---|
| Rent | -10% $1,209 | -5% $1,357 | +0% $1,505 | +5% $1,653 | +10% $1,801 |
| Rate | -1.0pp $1,630 | -0.5pp $1,568 | base $1,505 | +0.5pp $1,440 | +1.0pp $1,375 |
UW: 25.0% down · 7.5% · 30yr · 1.5% tax · 5.0% vac · 8.0% maint · 8.0% mgmt
Financing live
Cash to close
- Down payment
- $62,250
- Closing costs
- $7,470
- Reserves months
- —
- Total cash needed
- —
Loan-product check · same deal, 3 products live
Conventional
25% down · 7.5% · 30yr
- Down + closing
- —
- Monthly P&I
- —
- Monthly cashflow
- —
- DSCR
- —
- Eligible?
- —
Personal DTI + credit; lowest rate.
DSCR
20% down · 8.5% · 30yr
- Down + closing
- —
- Monthly P&I
- —
- Monthly cashflow
- —
- DSCR
- —
- Eligible?
- —
No personal income docs; deal must DSCR.
Hard money
10% down · 12.0% · 12mo
- Down + closing
- —
- Monthly P&I
- —
- Monthly cashflow
- —
- DSCR
- —
- Eligible?
- —
Short-term bridge; refi at stabilization.
Rent comps 3 comps
| Address | Beds | Baths | Sqft | Rent | $/sqft | DOM | Units | Dist |
|---|---|---|---|---|---|---|---|---|
| 1612 Grant St Calistoga, CA | 3.0 | 2.0 | 1625 | $3,795 | $2.34 | 45d | 1 | 0.57mi |
| 2014 Tablerock Ct Calistoga, CA | 3.0 | 2.0 | 1459 | $4,095 | $2.81 | 15d | 1 | 0.83mi |
| 1700 Cedar St Calistoga, CA | 2.0 | 1.0 | 962 | $3,200 | $3.33 | 15d | 1 | 0.86mi |
Listing history 18 events
-
2026-06-21days on market $249,000 Active 65 DOM
-
2026-06-18days on market $249,000 Active 62 DOM
-
2026-06-17pricedays on market $249,000 Active 61 DOM
-
2026-06-16days on market $269,000 Active 60 DOM
-
2026-06-15days on market $269,000 Active 59 DOM
-
2026-06-14days on market $269,000 Active 57 DOM
-
2026-06-13days on market $269,000 Active 56 DOM
-
2026-06-10days on market $269,000 Active 54 DOM
-
2026-06-09days on market $269,000 Active 53 DOM
-
2026-06-08days on market $269,000 Active 52 DOM
-
2026-06-07days on market $269,000 Active 51 DOM
-
2026-06-05days on market $269,000 Active 48 DOM
-
2026-06-03days on market $269,000 Active 47 DOM
-
2026-06-02days on market $269,000 Active 46 DOM
-
2026-06-01days on market $269,000 Active 45 DOM
-
2026-05-31days on market $269,000 Active 44 DOM
-
2026-05-30days on market $269,000 Active 43 DOM
-
2026-04-17$269,000 Active 370-char remark
Show marketing remark (370 chars)
This 2005 home is situated on a quiet cul-de-sac in Chateau Calistoga, a 55+ community located near downtown Calistoga. The home features a large great room, kitchen with custom cabinetry, three bedrooms, two baths in 1344 square feet of living space. Outdoor patio and raised garden beds. Park offers a community clubhouse, pool & spa for your year round enjoyment.
ⓘ Source: listings_history table (triggers on properties + properties_extension) + one-shot
backfill from property_details.listing_events for pre-trigger history.
Tax reassessment forecast CA · Resets to sale price
- Current annual tax
- $551 · $46/mo
- Projected year-2 tax
- $1,892 · $158/mo
- Expected delta
- +$1,341/yr (+$112/mo · 243.3%)
ⓘ Screening estimate from a state-policy table — verify with the county assessor before closing.
Climate risk First Street
- Flood 1/10 Low FEMA zone X (unshaded) · 0% chance over 30 yrs
- Wildfire 4/10 Moderate
- Heat 5/10 Major 8 d/yr ≥100°F today · 17 d/yr by 30 yrs out
- Wind 1/10 Low
- Air quality 10/10 Extreme 29 unhealthy d/yr today · 30 by 30 yrs out
Nearby sold comps map
Loading sold comps map…
Walkable amenities ~0.75 mi
Loading nearby amenities…
Taxation est. · year 1
- Rental income
- $44,969
- − Mortgage interest
- −$13,948
- − Property taxes
- −$551
- − Insurance
- −$1,245
- − Repairs & maintenance
- −$3,598
- − Management
- −$3,598
- − Depreciation
- −$7,244
- Taxable income
- $14,786
- Est. tax owed @ 24.0%
- −$3,549
- After-tax cash flow
- $14,511/yr
For passive investors: Depreciation is non-cash, so a rental often shows a tax loss while cash-flowing — sheltering income. Rental losses are passive: they offset passive income freely, and up to $25,000/yr can offset ordinary (W-2) income if you actively participate and your MAGI is under $100k (phasing out to $0 by $150k); unused losses carry forward. On sale, claimed depreciation is recaptured at up to 25%, and gains may owe capital-gains tax (a 1031 exchange can defer both). Figures are a year-1 estimate at your 24.0% rate — not tax advice; consult a CPA.
Schools (NCES district)
- District
- Calistoga Joint Unified
- NCES district ID
- 0607020
- Math proficiency
- 33% ▲ 2.00%
- Reading proficiency
- 51% ▲ 5.00%
- Median HH income
- $60,716
- Composite
- 39.48/100
- National rank
- #8101
- State rank
- #624 of 1400 in CA
Livability — Calistoga
- Score
- 63/100
- State rank
- #448
- US rank
- #15176
Category grades
Schools grade is shown separately in the Schools card above.
Census & demographics
- Census place
- Calistoga, CA
- Population (ZIP)
- 6,921
Population outlook (Napa County) Hauer SSP2
- Today (2025)
- 153,987 people
- By 2030
- 159,490 · +3.6%
- By 2040
- 168,796 · +9.6%
- By 2050
- 176,213 · +14.4%
- By 2075
- 190,113 · +23.5%
- By 2100
- 190,528 · +23.7%
Race, ethnicity, and origin ACS 2023
- Neighborhood character
- Majority White (55%)
- Race & ethnicity
- White 55% Hispanic / Latino 41% Two or more races 18% Asian 2% Black 1%
- Hispanic origin (detail)
- Mexican 38%
- Common ancestry
- Italian 3% Lithuanian 2% Portuguese 2%
- Foreign-born
- 25% · Canada
- Languages at home
- 64% English-only · Spanish 34% Russian/Polish/Slavic 1% French/Haitian/Cajun 1%
Political lean MEDSL · Napa
- 2024 margin
- Solid D (+34.9) · D 65.9% · R 31.1% · Other 3.0%
- 2008→2024 swing
- +2.4pp toward D · 2008: 32.5pp · 2024: 34.9pp
- All cycles
- 2024: D+34.9 2020: D+40.4 2016: D+35.2 2012: D+25.7 2008: D+32.5
Not yet ingested
- Civics
- —
Market trends
- HPI YoY
- ▼ -476.46%
- Current HPI
- 244.6548
- Rent YoY
- —
- Metro
- —
- State GDP YoY
- ▲ 3.21%
- F500 in state
- 116
Industry mix (Fortune 500 HQ in CA)
| Industry | F500 HQs | Revenue |
|---|---|---|
| Technology | 27 | $1,492B |
|
||
| Financial Services | 3 | $174B |
|
||
| Retail | 3 | $44B |
|
||
| Insurance | 3 | $26B |
|
||
| Media / Entertainment | 2 | $115B |
|
||
| Pharmaceuticals / Biotech | 2 | $62B |
|
||
Price history
1 event — show timeline
- 2026-04-17 Listed $269,000 BAREIS
Property tax history
-0.9%/yrLatest (2025): $551 · -21.6% YoY. Source: county tax records.
Cash-flow waterfall
monthlySold comps — $/sqft
last 12 mo · ≤1 miLoading sold comps…