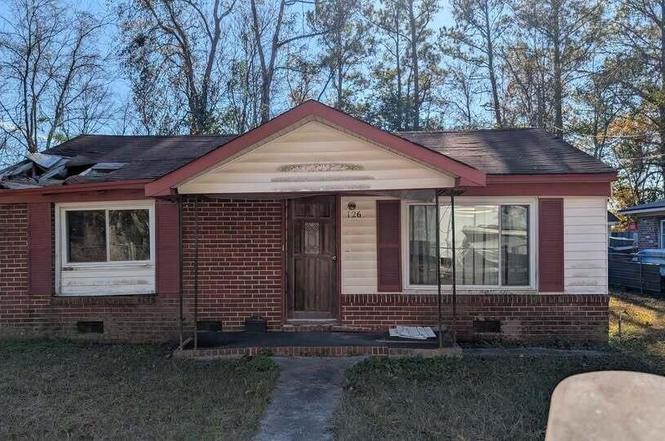
126 Fennick Dr Dr · Moncks Corner, SC
Flood risk 1/10 · Minimal
- FEMA flood zone
- X (unshaded)
- Chance of flooding over 30 yrs
- 0.0%
- Est. flood insurance / yr
- $507 – $1,088
Fire risk 4/10 · Minor
- Est. fire insurance / yr
- $783 – $1,453
Heat risk 8/10 · Major
- Hot days now (above 109°F)
- 7 days/yr
- Hot days in 30 yrs
- 17 days/yr
Wind risk 8/10 · Major
- Chance of severe wind over 30 yrs
- 97.0%
Air-quality risk 2/10 · Minimal
- Unhealthy air days now
- 2 days/yr
- Unhealthy air days in 30 yrs
- 2 days/yr
Risk factors via First Street. Map © Google.
Why this score? — see what drove the B grade
The composite is a weighted blend of 9 inputs, each scored 0–100. Each bar is that input's sub-score; the figure is the points it added to the 100-point composite (weight × sub-score).
- Cash flow +30.0/30.0
- 1% rule +10.0/10.0
- DSCR +10.0/10.0
- ARV discount +7.5/15.0
- Schools +3.6/10.0
- Livability +3.4/5.0
- Rent growth +3.2/5.0
- Condition / age +2.5/5.0
- Appreciation +0.0/10.0
$80,000
🖨 Deal sheet (PDF) 📄 Offer letter ✓ Due diligence
Listing remarks
Investor Special! Cash or hard money only. Property to be conveyed via quitclaim deed; alternatively, the buyer may obtain a tax title certificate to secure marketable title and a warranty deed at closing.
Key facts
- 4,791 sq ft lot
- Built 1983
- Listed 95 days
Neighborhood map
What this means for you Summary
Snapshot
- This is a 3-bed/2.0-bath single-family listed at $80k.
Deal economics
- At list price, monthly cash flow is $972 ($12k/yr) — positive.
- The deal already cash-flows at list — no discount required.
- Meets the 1% rule at list price ($2k rent vs $80k).
- Recommended offer: $73k (9.0% below list) — sets the bar for market timing.
- Cap rate 20.9% vs local median 4.3% in Moncks Corner — top-decile yield for the area; either an underpriced asset or a hidden risk that comps aren't pricing in. Stress-test before assuming the spread holds.
Location & tenants
- Location reads 67/100 on livability (#99 in SC) — a middle-class / working-renter tenant base. Strengths: housing A+, health & safety A+, cost of living A; Watch: crime C-, amenities F, commute F.
- Berkeley 01 (suburban): math 35% / reading 48% proficiency, ranked #30 of 80 in SC (top 38%) — families likely to look elsewhere, expect single-tenant / working-renter base with shorter leases.
- Zoned schools: Berkeley Elementary (619 students, 100% FRL); Berkeley Middle (math 19% / reading 32%, grade F, #162 of 229 statewide, top 71%, 1,403 students, 57% FRL); Berkeley High (math 36% / reading 83%, grade C+, #110 of 196 statewide, top 58%, 1,776 students, 50% FRL) — zoned schools average 69% FRL vs 48% district-wide (21 pts higher); higher-poverty schools than district average — tighter screening recommended.
- Market conditions: Rents rising (+2.8%/yr); 642 active listings in the ZIP; 11 comparable units currently listed for rent nearby; rentals at typical pace (median 15d on market — plan ~3-4 weeks tenant-placement turnaround); solid renter incomes; 3,183 units permitted in Berkeley County in 2024 (580 in 5+ unit buildings).
Forward outlook
- Local home prices are declining (-3.0%/yr); year-one equity from $553 of loan paydown is wiped out by about $2k of value loss. Plan a longer hold.
- Berkeley County population projected at +48% by 2050 — long-run rental-demand tailwind backs the buy-and-hold thesis.
- At projected returns (-3.0% appreciation + 2.8% rent growth), your $22k cash investment doubles in ~3 years — after that, you're playing with house money.
Negotiation context
- It's been on market 95 days — a 9% lower offer ($73k) is reasonable based on typical stale-listing flexibility.
Risks & watch-outs
- Watch-outs: property tax is 2.6% of price.
- Climate carrying-cost: severe wind risk, 97% chance of damaging wind over 30y; extreme-heat days projected 7→17/yr by 2055 (HVAC capex compounding) — expect insurance premiums to compound above CPI over the hold.
Questions for the listing agent
- It's been on market 95 days. Have you received any prior offers? Is the seller open to a 9% concession, seller financing, or rate buy-down credit?
- Property tax is high relative to price — has the assessment been appealed recently, and will the sale trigger a re-assessment?
- Why hasn't it sold? Are there any deal-killer items the seller is aware of (foundation, flood, title, zoning, code violations)?
- Is there a deadline driving the sale (1031 exchange, divorce, estate, relocation)? That informs how much negotiation room exists.
- Schools are D-rated, which usually means shorter tenancies and higher turnover. Who's the typical renter profile here, and what's been the actual vacancy rate?
- What's the average days-on-market for RENTAL listings here right now (not sales)? A rising rental-DOM trend means longer vacancies and softer asking-rent achievability than the comps imply.
- What's the recent tenant-quality profile in this submarket — average credit score on applications, eviction rate, late-payment / NSF rate, and stable-employment percentage? A property-management company in the area should have these aggregated.
- How much new for-sale + rental construction is in the pipeline within 1–3 miles? Heavy new supply typically softens prices + rents 12–24 months out; constrained supply supports both.
Investment metrics
- 1% rule
- 2.53% ✓
- Cap rate
- 20.87%
- Cash-on-cash
- 52.06%
- DSCR
- 3.32
- GRM
- 3.3
CMA / ARV
- ARV (on-the-fly)
- $318,600
- Comps found
- 6
Show comp detail 6 sales within ~0.75 mi
| Address | Dist | Beds/Ba | Sqft | Sold | Price | $/sf | Match |
|---|---|---|---|---|---|---|---|
| 1208 Edward Dr | 0.43mi | 3/2.0 | 1,300 (-4%) | 2mo | $345,000 | $265 | 72 |
| 106 Journeys End Ln | 0.54mi | 3/2.0 | 1,437 (+6%) | 3mo | $339,500 | $236 | 62 |
| 1223 Old Fort Rd | 0.54mi | 3/1.5 | 1,400 (+4%) | 15mo | $225,000 | $161 | 54 |
| 411 Berkeley Dr | 0.73mi | 3/2.0 | 1,320 (-2%) | 12mo | $335,000 | $254 | 53 |
| 416 Altman St | 0.72mi | 3/1.0 | 1,252 (-7%) | 10mo | $269,000 | $215 | 42 |
| 407 Blue Elderberry Run | 0.63mi | 3/2.0 | 1,460 (+8%) | 18mo | $325,000 | $223 | 42 |
Match score weights: distance 35% · size 25% · config 20% · recency 20%. Top-matched comps best support the ARV.
Projected returns pro-forma
-3.0% appreciation · 2.77% rent growth · sell at horizon
- IRR
- 49.8%
- Equity multiple
- 3.17×
- Total profit
- $48,541
- Equity at exit
- $11,928
- IRR
- 55.2%
- Equity multiple
- 6.37×
- Total profit
- $120,367
- Equity at exit
- $6,917
Cash invested: $22,400 (down + closing). Projections, not guarantees.
Landlord ↔ Tenant lean methodology
- Overall (STATE)
- 90 Strongly Landlord-Friendly
- State South Carolina
- 90 Strongly Landlord-Friendly · R+6
- County
- — inherits STATE
- City
- — inherits STATE
ZIP-level market 29461
- Home prices YoY
- -13.9%
- Rents YoY
- 2.8%
- Active inventory
- 642
- Price-to-rent
- 3.3×
Monthly cashflow live
- Estimated rent
- $2,021 high interval (Pro) →
- Mortgage (P&I)
- −$420
- Tax from tax record
- −$172 /mo · $2,062/yr
- Insurance
- −$33
- HOA
- −$0
- Vacancy / Maint / Mgmt
- −$424
- Net cashflow
- $972
Break-even live
Sensitivity live
| Price | -10% $1,017 | -5% $994 | +0% $972 | +5% $949 | +10% $927 |
|---|---|---|---|---|---|
| Rent | -10% $812 | -5% $892 | +0% $972 | +5% $1,052 | +10% $1,131 |
| Rate | -1.0pp $1,012 | -0.5pp $992 | base $972 | +0.5pp $951 | +1.0pp $930 |
UW: 25.0% down · 7.5% · 30yr · 1.5% tax · 5.0% vac · 8.0% maint · 8.0% mgmt
Financing live
Cash to close
- Down payment
- $20,000
- Closing costs
- $2,400
- Reserves months
- —
- Total cash needed
- —
Loan-product check · same deal, 3 products live
Conventional
25% down · 7.5% · 30yr
- Down + closing
- —
- Monthly P&I
- —
- Monthly cashflow
- —
- DSCR
- —
- Eligible?
- —
Personal DTI + credit; lowest rate.
DSCR
20% down · 8.5% · 30yr
- Down + closing
- —
- Monthly P&I
- —
- Monthly cashflow
- —
- DSCR
- —
- Eligible?
- —
No personal income docs; deal must DSCR.
Hard money
10% down · 12.0% · 12mo
- Down + closing
- —
- Monthly P&I
- —
- Monthly cashflow
- —
- DSCR
- —
- Eligible?
- —
Short-term bridge; refi at stabilization.
Rent comps 11 comps
| Address | Beds | Baths | Sqft | Rent | $/sqft | DOM | Units | Dist |
|---|---|---|---|---|---|---|---|---|
| 503 Berkeley Dr Moncks Corner, SC | 3.0 | 1.0 | 1015 | $1,895 | $1.87 | 22d | 1 | 0.58mi |
| 2000 Epson Plantation Dr Moncks Corner, SC | 3.0 | 2.0 | 1370 | $1,949 | $1.42 | 12d | 1 | 0.84mi |
| 2000 Epson Plantation Dr Moncks Corner, SC | 2.0 | 2.0 | 1217 | $1,725 | $1.42 | 24d | 1 | 0.84mi |
| 2000 Epson Plantation Dr Moncks Corner, SC | 2.0 | 2.0 | 1217 | $1,799 | $1.48 | 15d | 1 | 0.84mi |
| 211 White St Unit B Moncks Corner, SC | 2.0 | 2.0 | 1020 | $1,700 | $1.67 | 15d | 1 | 0.99mi |
| 303 Eagleston Dr Moncks Corner, SC | 3.0 | 2.0 | 1368 | $2,000 | $1.46 | 15d | 1 | 1.03mi |
| 215 Shannonwood Dr Moncks Corner, SC | 3.0 | 2.0 | 1184 | $1,579 | $1.33 | 3d | 1 | 1.14mi |
| 255 Mitton Rd Moncks Corner, SC | 3.0 | 2.0 | 1680 | $2,200 | $1.31 | 24d | 1 | 1.15mi |
| 121 Johnny Reb Dr Unit A Moncks Corner, SC | 2.0 | 2.0 | 912 | $1,695 | $1.86 | 15d | 1 | 1.30mi |
| 391 State Road S-8-978 Moncks Corner, SC | 1.0–3.0 | 1.0–2.0 | 1061 | $1,626 | $1.53 | 24d | 1 | 1.39mi |
| 121 Marigny St Moncks Corner, SC | 3.0–4.0 | 2.5 | 1875 | $2,230 | $1.19 | 3d | 9 | 1.43mi |
Listing history 6 events
-
2026-04-17status Pending
-
2026-03-18price $80,000
-
2026-02-18price $85,000
-
2026-02-13price $90,000
-
2026-01-28price $95,000
-
2026-01-12$100,000 Active
ⓘ Source: listings_history table (triggers on properties + properties_extension) + one-shot
backfill from property_details.listing_events for pre-trigger history.
Tax reassessment forecast SC · Resets to sale price
- Current annual tax
- $2,062 · $172/mo
- Projected year-2 tax
- $2,062 · $172/mo
- Expected delta
- $0/yr ($0/mo · 0.0%)
ⓘ Screening estimate from a state-policy table — verify with the county assessor before closing.
Climate risk First Street
- Flood 1/10 Low FEMA zone X (unshaded) · 0% chance over 30 yrs
- Wildfire 4/10 Moderate
- Heat 8/10 Severe 7 d/yr ≥109°F today · 17 d/yr by 30 yrs out
- Wind 8/10 Severe 97% chance of damaging wind over 30 yrs
- Air quality 2/10 Low 2 unhealthy d/yr today · 2 by 30 yrs out
Nearby sold comps map
Loading sold comps map…
Walkable amenities ~0.75 mi
Loading nearby amenities…
Taxation est. · year 1
- Rental income
- $24,251
- − Mortgage interest
- −$4,481
- − Property taxes
- −$2,062
- − Insurance
- −$400
- − Repairs & maintenance
- −$1,940
- − Management
- −$1,940
- − Depreciation
- −$2,327
- Taxable income
- $11,100
- Est. tax owed @ 24.0%
- −$2,664
- After-tax cash flow
- $8,998/yr
For passive investors: Depreciation is non-cash, so a rental often shows a tax loss while cash-flowing — sheltering income. Rental losses are passive: they offset passive income freely, and up to $25,000/yr can offset ordinary (W-2) income if you actively participate and your MAGI is under $100k (phasing out to $0 by $150k); unused losses carry forward. On sale, claimed depreciation is recaptured at up to 25%, and gains may owe capital-gains tax (a 1031 exchange can defer both). Figures are a year-1 estimate at your 24.0% rate — not tax advice; consult a CPA.
Schools (NCES district)
- District
- Berkeley 01
- NCES district ID
- 4501170
- Math proficiency
- 35% ▼ -8.00%
- Reading proficiency
- 48% ▼ -2.00%
- Median HH income
- $52,724
- Composite
- 35.95/100
- National rank
- #4799
- State rank
- #30 of 80 in SC
Livability — Moncks Corner
- Score
- 67/100
- State rank
- #99
- US rank
- #10812
Category grades
Schools grade is shown separately in the Schools card above.
Census & demographics
- Census place
- Moncks Corner, SC
- County
- Berkeley County · 198,768 people
- City population
- 43,816
- Metro
- Charleston-North Charleston, SC
- Population (ZIP)
- 43,816
- Household income
- $82,666
- Rent vs Own
- Severe rent burden
- 815.0
Population outlook (Berkeley County) Hauer SSP2
- Today (2025)
- 254,184 people
- By 2030
- 279,677 · +10.0%
- By 2040
- 329,379 · +29.6%
- By 2050
- 375,557 · +47.8%
- By 2075
- 476,740 · +87.6%
- By 2100
- 535,945 · +110.8%
Race, ethnicity, and origin ACS 2023
- Neighborhood character
- Majority White (61%)
- Race & ethnicity
- White 61% Black 29% Hispanic / Latino 6% Two or more races 5%
- Hispanic origin (detail)
- Mexican 2% Puerto Rican 2%
- Common ancestry
- Lithuanian 1% Slovak 1% Romanian 1%
- Foreign-born
- 3% · Canada
- Languages at home
- 96% English-only · Spanish 3%
Political lean MEDSL · Berkeley
- 2024 margin
- R (+16.3) · D 41.1% · R 57.4% · Other 1.4%
- 2008→2024 swing
- -3.2pp toward R · 2008: -13.1pp · 2024: -16.3pp
- All cycles
- 2024: R+16.3 2020: R+11.7 2016: R+17.4 2012: R+18.9 2008: R+13.1
Not yet ingested
- Civics
- —
Market trends
- HPI YoY
- ▼ -52.95%
- Current HPI
- 328.7212
- Rent YoY
- ▲ 2.77%
- Metro
- Charleston-North Charleston, SC
- State GDP YoY
- ▲ 4.51%
- F500 in state
- 2
Industry mix (Fortune 500 HQ in SC)
| Industry | F500 HQs | Revenue |
|---|---|---|
| Packaging | 1 | $7B |
|
||
Price history
-20.0% since first listed6 events — show timeline
- 2026-04-17 Pending — Charleston Trident MLS
- 2026-03-18 Price Changed $80,000 Charleston Trident MLS
- 2026-02-18 Price Changed $85,000 Charleston Trident MLS
- 2026-02-13 Price Changed $90,000 Charleston Trident MLS
- 2026-01-28 Price Changed $95,000 Charleston Trident MLS
- 2026-01-12 Listed $100,000 Charleston Trident MLS
Property tax history
+3.9%/yrLatest (2025): $2,062 · +3.9% YoY. Source: county tax records.
Cash-flow waterfall
monthlySold comps — $/sqft
last 12 mo · ≤1 miLoading sold comps…