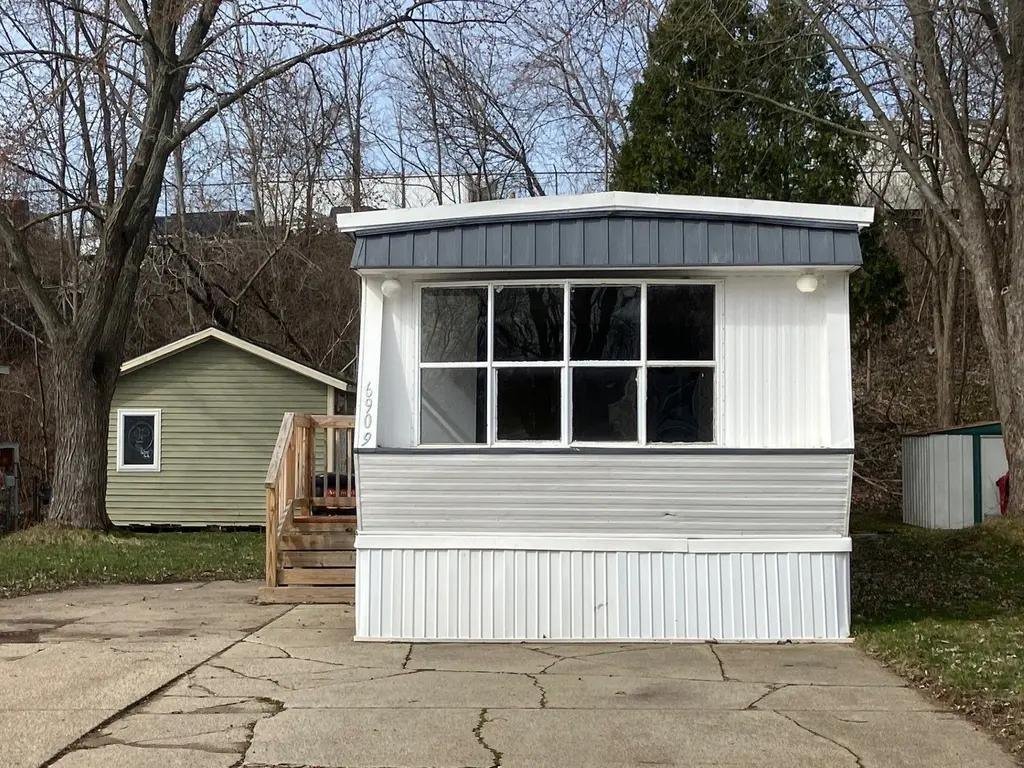
6909 Independence Lane South W #49 · Byron, MI
Flood risk No data
- FEMA flood zone
- —
- Chance of flooding over 30 yrs
- —
- Est. flood insurance / yr
- —
Fire risk No data
- Est. fire insurance / yr
- —
Heat risk No data
- Hot days now (above threshold)
- —
- Hot days in 30 yrs
- —
Wind risk No data
- Chance of severe wind over 30 yrs
- —
Air-quality risk No data
- Unhealthy air days now
- —
- Unhealthy air days in 30 yrs
- —
Risk factors via First Street. Map © Google.
Why this score? — see what drove the D+ grade
The composite is a weighted blend of 9 inputs, each scored 0–100. Each bar is that input's sub-score; the figure is the points it added to the 100-point composite (weight × sub-score).
- Cash flow +15.0/30.0
- ARV discount +7.5/15.0
- Schools +6.2/10.0
- 1% rule +5.0/10.0
- DSCR +5.0/10.0
- Livability +3.3/5.0
- Rent growth +2.5/5.0
- Condition / age +2.5/5.0
- Appreciation +0.0/10.0
$17,700
🖨 Deal sheet (PDF) 📄 Offer letter ✓ Due diligence
Listing remarks
* THIS IS A RESALE LISTING * You'll love living in this 2 bedroom, 1 bathroom home within a wonderful family-friendly community. Check out the awesome amenities your community has to offer such as a playground, community events, a basketball court, and more! This home won't be on the market long, so call us today for more information or to schedule a tour. Deposits & Fees are subject to change.
Key facts
- Built 2026
- Listed 36 days
Property features AI
Finance
- Other: Living area: 672 (listed)
- Financial info: List price $17,200
Exterior
- Utilities: Natural gas available
- Home design: Spec inventory home; Plan 93410; Active status
Interior
- Bedrooms: 2 bedrooms
- Bathrooms: 1 full bathroom
- Heating & cooling: Natural gas heating
- Interior features: 1 total bathroom
Neighborhood map
What this means for you Summary
Snapshot
- This is a 2-bed/1.0-bath manufactured listed at $18k.
Deal economics
- At list price, monthly cash flow is $946 ($11k/yr) — positive.
- The deal already cash-flows at list — no discount required.
- Meets the 1% rule at list price ($1k rent vs $18k).
- Recommended offer: $17k (3.0% below list) — sets the bar for market timing.
- Cap rate 70.4% vs local median 1.7% in Byron — top-decile yield for the area; either an underpriced asset or a hidden risk that comps aren't pricing in. Stress-test before assuming the spread holds.
Location & tenants
- Location reads 66/100 on livability (#410 in MI) — a middle-class / working-renter tenant base. Strengths: cost of living A+, housing A+, employment B; Watch: crime D+, amenities F, commute F.
- Byron Center Public Schools (suburban): math 69% / reading 73% proficiency, ranked #15 of 540 in MI (top 3%) — strong family-tenant draw, lease renewals of 3-5y typical; only 20% free/reduced lunch — higher-income household profile.
- Market conditions: 109 active listings in the ZIP; 1 comparable units currently listed for rent nearby; 2,253 units permitted in Kent County in 2024 (969 in 5+ unit buildings).
Forward outlook
- Local home prices are declining (-3.0%/yr); year-one equity from $122 of loan paydown is wiped out by about $531 of value loss. Plan a longer hold.
- Kent County population projected at +22% by 2050 — long-run rental-demand tailwind backs the buy-and-hold thesis.
- At projected returns (-3.0% appreciation + 3.0% rent growth), your $5k cash investment doubles in ~1 year — after that, you're playing with house money.
Negotiation context
- It's been on market 36 days — a 3% lower offer ($17k) is reasonable based on typical stale-listing flexibility.
Questions for the listing agent
- It's been on market 36 days. Have you received any prior offers? Is the seller open to a 3% concession, seller financing, or rate buy-down credit?
- Is there a deadline driving the sale (1031 exchange, divorce, estate, relocation)? That informs how much negotiation room exists.
- Schools are B-rated — typically a magnet for longer-tenancy family renters. What's the average tenant stay here, and is there a school-zone premium baked into asking?
- Crime grade is D in this area — have there been break-ins, vandalism, or insurance claims at this property in the last 3 years? What carrier currently insures it and at what premium?
- The area grade is low — what's the realistic commute time and amenity access for the typical tenant pool here? Any planned neighborhood developments (good or bad) we should know about?
- What's the average days-on-market for RENTAL listings here right now (not sales)? A rising rental-DOM trend means longer vacancies and softer asking-rent achievability than the comps imply.
- What's the recent tenant-quality profile in this submarket — average credit score on applications, eviction rate, late-payment / NSF rate, and stable-employment percentage? A property-management company in the area should have these aggregated.
- How much new for-sale + rental construction is in the pipeline within 1–3 miles? Heavy new supply typically softens prices + rents 12–24 months out; constrained supply supports both.
Investment metrics
- 1% rule
- 7.64% ✓
- Cap rate
- 70.42%
- Cash-on-cash
- 229.04%
- DSCR
- 11.19
- GRM
- 1.1
CMA / ARV
- ARV (median comp)
- $45,000
- List price
- $17,700
- Delta
- -60.67%
- Verdict
- UNDERPRICED
- Comps
- 1 within 2.0 mi
Projected returns pro-forma
-3.0% appreciation · 3.0% rent growth · sell at horizon
- IRR
- —
- Equity multiple
- 12.58×
- Total profit
- $57,400
- Equity at exit
- $2,639
- IRR
- —
- Equity multiple
- 26.76×
- Total profit
- $127,644
- Equity at exit
- $1,530
Cash invested: $4,956 (down + closing). Projections, not guarantees.
Landlord ↔ Tenant lean methodology
- Overall (STATE)
- 62 Landlord-Friendly
- State Michigan
- 62 Landlord-Friendly · EVEN
- County
- — inherits STATE
- City
- — inherits STATE
ZIP-level market 49548
- Active inventory
- 109
- Price-to-rent
- 1.1×
Monthly cashflow live
- Estimated rent
- $1,352 medium interval (Pro) →
- Mortgage (P&I)
- −$93
- Tax est. 1.5%
- −$22 /mo · $266/yr
- Insurance
- −$7
- HOA
- −$0
- Vacancy / Maint / Mgmt
- −$284
- Net cashflow
- $946
Break-even live
Sensitivity live
| Price | -10% $958 | -5% $952 | +0% $946 | +5% $940 | +10% $934 |
|---|---|---|---|---|---|
| Rent | -10% $839 | -5% $893 | +0% $946 | +5% $999 | +10% $1,053 |
| Rate | -1.0pp $955 | -0.5pp $950 | base $946 | +0.5pp $941 | +1.0pp $937 |
UW: 25.0% down · 7.5% · 30yr · 1.5% tax · 5.0% vac · 8.0% maint · 8.0% mgmt
Financing live
Cash to close
- Down payment
- $4,425
- Closing costs
- $531
- Reserves months
- —
- Total cash needed
- —
Loan-product check · same deal, 3 products live
Conventional
25% down · 7.5% · 30yr
- Down + closing
- —
- Monthly P&I
- —
- Monthly cashflow
- —
- DSCR
- —
- Eligible?
- —
Personal DTI + credit; lowest rate.
DSCR
20% down · 8.5% · 30yr
- Down + closing
- —
- Monthly P&I
- —
- Monthly cashflow
- —
- DSCR
- —
- Eligible?
- —
No personal income docs; deal must DSCR.
Hard money
10% down · 12.0% · 12mo
- Down + closing
- —
- Monthly P&I
- —
- Monthly cashflow
- —
- DSCR
- —
- Eligible?
- —
Short-term bridge; refi at stabilization.
Rent comps 1 comps
| Address | Beds | Baths | Sqft | Rent | $/sqft | DOM | Units | Dist |
|---|---|---|---|---|---|---|---|---|
| 6471 Division Ave S Grand Rapids, MI | 2.0 | 1.0 | 728 | $1,399 | $1.92 | 11d | 1 | 0.80mi |
Listing history 15 events
-
2026-06-18days on market $17,700 Active 36 DOM
-
2026-06-17days on market $17,700 Active 35 DOM
-
2026-06-16days on market $17,700 Active 34 DOM
-
2026-06-15days on market $17,700 Active 33 DOM
-
2026-06-14days on market $17,700 Active 31 DOM
-
2026-06-10days on market $17,700 Active 28 DOM
-
2026-06-09days on market $17,700 Active 27 DOM
-
2026-06-08days on market $17,700 Active 26 DOM
-
2026-06-07days on market $17,700 Active 25 DOM
-
2026-06-05days on market $17,700 Active 22 DOM
-
2026-06-03days on market $17,700 Active 21 DOM
-
2026-06-03days on market $17,700 Active 20 DOM
-
2026-06-01pricedays on market $17,700 Active 19 DOM
-
2026-05-31days on market $17,200 Active 18 DOM
-
2026-05-13$17,200 Active 406-char remark
ⓘ Source: listings_history table (triggers on properties + properties_extension) + one-shot
backfill from property_details.listing_events for pre-trigger history.
Nearby sold comps map
Loading sold comps map…
Walkable amenities ~0.75 mi
Loading nearby amenities…
Taxation est. · year 1
- Rental income
- $16,227
- − Mortgage interest
- −$991
- − Property taxes
- −$266
- − Insurance
- −$88
- − Repairs & maintenance
- −$1,298
- − Management
- −$1,298
- − Depreciation
- −$515
- Taxable income
- $11,770
- Est. tax owed @ 24.0%
- −$2,825
- After-tax cash flow
- $8,526/yr
For passive investors: Depreciation is non-cash, so a rental often shows a tax loss while cash-flowing — sheltering income. Rental losses are passive: they offset passive income freely, and up to $25,000/yr can offset ordinary (W-2) income if you actively participate and your MAGI is under $100k (phasing out to $0 by $150k); unused losses carry forward. On sale, claimed depreciation is recaptured at up to 25%, and gains may owe capital-gains tax (a 1031 exchange can defer both). Figures are a year-1 estimate at your 24.0% rate — not tax advice; consult a CPA.
Schools (NCES district)
- District
- Byron Center Public Schools
- NCES district ID
- 2607560
- Math proficiency
- 69% ▼ -2.00%
- Reading proficiency
- 73% ▼ -4.00%
- Median HH income
- $63,763
- Composite
- 61.5/100
- National rank
- #753
- State rank
- #15 of 540 in MI
Livability — Byron
- Score
- 66/100
- State rank
- #410
- US rank
- #11251
Category grades
Schools grade is shown separately in the Schools card above.
Census & demographics
- Census place
- Cutlerville, MI
- County
- Kent County · 533,805 people
- Metro
- Grand Rapids-Kentwood, MI
- Population (ZIP)
- 34,777
- Household income
- $61,636
- Rent vs Own
- Severe rent burden
- 781.0
Population outlook (Kent County) Hauer SSP2
- Today (2025)
- 712,484 people
- By 2030
- 748,618 · +5.1%
- By 2040
- 814,777 · +14.4%
- By 2050
- 868,556 · +21.9%
- By 2075
- 966,487 · +35.7%
- By 2100
- 967,975 · +35.9%
Race, ethnicity, and origin ACS 2023
- Neighborhood character
- Diverse neighborhood (Simpson 0.68)
- Race & ethnicity
- White 49% Hispanic / Latino 22% Two or more races 16% Black 15% Asian 6% Native American 1%
- Hispanic origin (detail)
- Mexican 15% Puerto Rican 4%
- Common ancestry
- Iranian 10% Romanian 4% Lithuanian 2%
- Foreign-born
- 13% · Canada, Vietnam, China
- Languages at home
- 78% English-only · Spanish 14% Vietnamese 2% French/Haitian/Cajun 1%
Political lean MEDSL · Kent
- 2024 margin
- Lean D (+5.4) · D 51.8% · R 46.5% · Other 1.7%
- 2008→2024 swing
- +4.8pp toward D · 2008: 0.5pp · 2024: 5.4pp
- All cycles
- 2024: D+5.4 2020: D+6.1 2016: R+3.1 2012: R+7.9 2008: D+0.5
Not yet ingested
- Civics
- —
Market trends
- HPI YoY
- ▼ -208.41%
- Current HPI
- 325.8096
- Rent YoY
- —
- Metro
- Grand Rapids-Kentwood, MI
- State GDP YoY
- ▲ 1.37%
- F500 in state
- 28
Industry mix (Fortune 500 HQ in MI)
| Industry | F500 HQs | Revenue |
|---|---|---|
| Automotive Parts | 3 | $48B |
|
||
| Automotive | 2 | $372B |
|
||
| Chemicals | 1 | $45B |
|
||
| Automotive Retail | 1 | $29B |
|
||
| Healthcare / Medical Devices | 1 | $23B |
|
||
| Automotive Technology | 1 | $20B |
|
||
Cash-flow waterfall
monthlySold comps — $/sqft
last 12 mo · ≤1 miLoading sold comps…