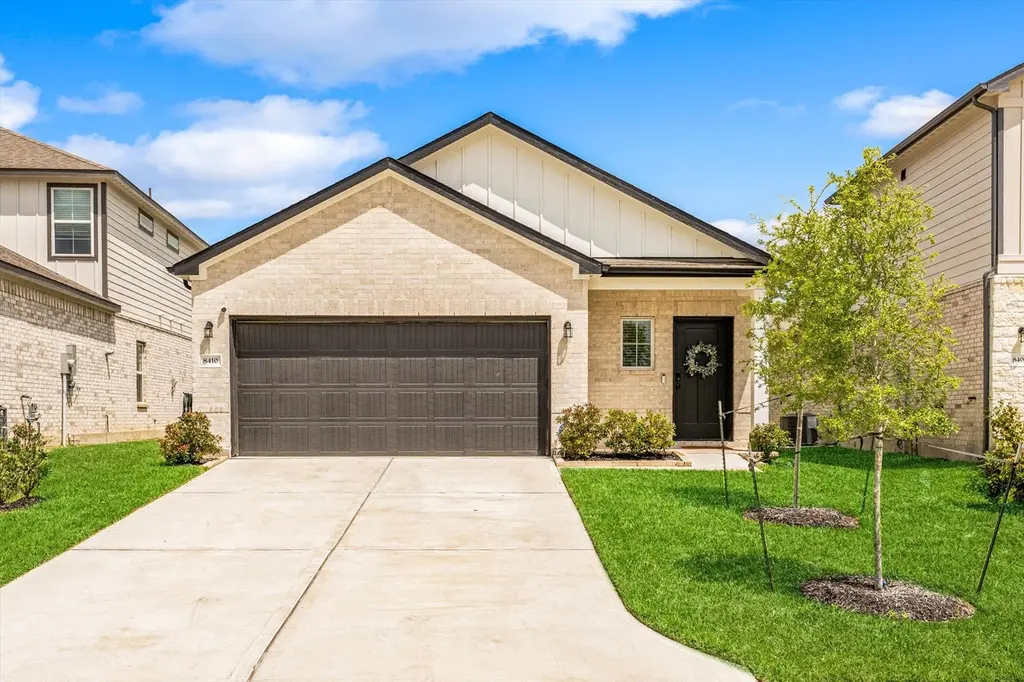
8410 Sweet Cherry Ln · The Woodlands, TX
Flood risk No data
- FEMA flood zone
- —
- Chance of flooding over 30 yrs
- —
- Est. flood insurance / yr
- —
Fire risk No data
- Est. fire insurance / yr
- —
Heat risk No data
- Hot days now (above threshold)
- —
- Hot days in 30 yrs
- —
Wind risk No data
- Chance of severe wind over 30 yrs
- —
Air-quality risk No data
- Unhealthy air days now
- —
- Unhealthy air days in 30 yrs
- —
Risk factors via First Street. Map © Google.
Why this score? — see what drove the F grade
The composite is a weighted blend of 9 inputs, each scored 0–100. Each bar is that input's sub-score; the figure is the points it added to the 100-point composite (weight × sub-score).
- Appreciation +10.0/10.0
- Cash flow +5.0/30.0
- Livability +4.5/5.0
- Schools +3.9/10.0
- Rent growth +2.6/5.0
- Condition / age +2.5/5.0
- 1% rule +2.2/10.0
- ARV discount +2.2/15.0
- DSCR +0.0/10.0
$285,000
🖨 Deal sheet (PDF) 📄 Offer letter ✓ Due diligence
Listing remarks
This stunning Magnolia home blends style, comfort, and thoughtful upgrades into one move-in ready package. From the timeless fully bricked exterior to the elevated interior finishes, every detail is designed to impress. Inside, you’ll find a bright, open layout with upgraded flooring, designer touches, and a beautifully appointed kitchen featuring a pot filler and included appliances, perfect for both everyday living and entertaining. The spacious primary suite offers a spa-like feel with upgraded finishes, while smart home features and added details throughout provide convenience and peace of mind. A true standout in today’s market—this home offers the perfect balance of
Key facts
- Upgraded flooring
- Pot filler
- Included appliances
Tags
Neighborhood map
What this means for you Summary
Snapshot
- This is a 3-bed/2.0-bath single-family listed at $285k.
Deal economics
- At list price, monthly cash flow is $-670 ($-8k/yr) — negative.
- To cash-flow at today's rent, offer at most $167k (41.5% below list).
- To meet the 1% rule (rent ≥ 1% of price), the offer needs to be $206k (27.9% below list).
- Recommended offer: $167k (41.5% below list) — sets the bar for cash-flow.
- Cap rate 3.5% vs local median 2.3% in The Woodlands — top-decile yield for the area; either an underpriced asset or a hidden risk that comps aren't pricing in. Stress-test before assuming the spread holds.
Location & tenants
- Location reads 91/100 on livability (#1 in TX, #47 nationally) — a professional / high-income tenant draw. Strengths: amenities A+, commute A+, employment A+; Watch: cost of living D-.
- Magnolia ISD (rural): math 42% / reading 45% proficiency, ranked #247 of 826 in TX (top 30%) — families likely to look elsewhere, expect single-tenant / working-renter base with shorter leases.
- Zoned schools: Tom R Ellisor El (math 44% / reading 44%, grade F, #1,243 of 4,322 statewide, top 29%, 492 students, 40% FRL); Bear Branch J H (math 44% / reading 46%, grade D, #479 of 1,662 statewide, top 29%, 1,076 students, 37% FRL); Magnolia H S (math 47% / reading 62%, grade C-, #379 of 1,632 statewide, top 26%, 2,248 students, 31% FRL) — zoned schools at 36% FRL track the district average.
- Market conditions: Rents flat; 1622 active listings in the ZIP; 18 comparable units currently listed for rent nearby; rentals at typical pace (median 14d on market — plan ~3-4 weeks tenant-placement turnaround); high-income renter base; 13,259 units permitted in Montgomery County in 2024 (1,402 in 5+ unit buildings).
Forward outlook
- In year one you build about $30k of equity ($2k loan paydown + $28k appreciation (10.0% local appreciation)).
- Montgomery County population projected at +65% by 2050 — long-run rental-demand tailwind backs the buy-and-hold thesis.
- By year 2, paydown + projected appreciation supports a ~$49k cash-out refi (75% LTV) — recoverable capital for the next deal without selling this one.
Negotiation context
- It's been on market 15 days — a 2% lower offer ($281k) is reasonable based on typical stale-listing flexibility.
Risks & watch-outs
- Watch-outs: property tax is 2.6% of price.
Questions for the listing agent
- What do current leases actually rent for vs. the listed asking? Can we see a recent rent roll and the last 12 months of T-12 income?
- Property tax is high relative to price — has the assessment been appealed recently, and will the sale trigger a re-assessment?
- What does the HOA fee cover, when was the last increase, and are there any pending special assessments or reserve-fund shortfalls?
- Is there a deadline driving the sale (1031 exchange, divorce, estate, relocation)? That informs how much negotiation room exists.
- Schools are A-rated — typically a magnet for longer-tenancy family renters. What's the average tenant stay here, and is there a school-zone premium baked into asking?
- The area grade is low — what's the realistic commute time and amenity access for the typical tenant pool here? Any planned neighborhood developments (good or bad) we should know about?
- What's the average days-on-market for RENTAL listings here right now (not sales)? A rising rental-DOM trend means longer vacancies and softer asking-rent achievability than the comps imply.
- What's the recent tenant-quality profile in this submarket — average credit score on applications, eviction rate, late-payment / NSF rate, and stable-employment percentage? A property-management company in the area should have these aggregated.
- How much new for-sale + rental construction is in the pipeline within 1–3 miles? Heavy new supply typically softens prices + rents 12–24 months out; constrained supply supports both.
Investment metrics
- 1% rule
- 0.72% ✗
- Cap rate
- 3.47%
- Cash-on-cash
- -10.07%
- DSCR
- 0.55
- GRM
- 11.6
CMA / ARV
- ARV (on-the-fly)
- $255,000
- Comps found
- 12
Show comp detail 12 sales within ~0.75 mi
| Address | Dist | Beds/Ba | Sqft | Sold | Price | $/sf | Match |
|---|---|---|---|---|---|---|---|
| 8410 Sweet Cherry Ln | 0.00mi | 3/2.0 | 1,500 (0%) | 1mo | $285,000 | $190 | 99 |
| 162 Courageous Side Way | 0.32mi | 3/2.0 | 1,477 (-2%) | 3mo | $235,000 | $159 | 80 |
| 20 Courageous Side Way | 0.04mi | 3/2.5 | 1,708 (+14%) | 1mo | $288,990 | $169 | 72 |
| 175 Courageous Side Way | 0.33mi | 4/2.5 (+1) | 1,666 (+11%) | 1mo | $279,900 | $168 | 58 |
| 158 S Star Ridge Cir | 0.60mi | 3/2.0 | 1,605 (+7%) | 4mo | $330,000 | $206 | 57 |
| 209 Valiant Ridge Trl | 0.45mi | 3/2.5 | 1,678 (+12%) | 2mo | $284,900 | $170 | 56 |
| 203 Brazen Forest Trl | 0.47mi | 3/2.5 | 1,678 (+12%) | 2mo | $279,900 | $167 | 54 |
| 7906 Alset Dr | 0.45mi | 3/2.5 | 1,678 (+12%) | 6mo | $289,900 | $173 | 52 |
| 294 Brazen Forest Trl | 0.47mi | 3/2.5 | 1,678 (+12%) | 5mo | $274,900 | $164 | 52 |
| 282 Brazen Forest Trl | 0.49mi | 3/2.5 | 1,678 (+12%) | 5mo | $269,900 | $161 | 52 |
| 7823 Bergamot Cir | 0.65mi | 3/2.5 | 1,678 (+12%) | 1mo | $284,900 | $170 | 47 |
| 7745 Bergamot Cir | 0.66mi | 3/2.5 | 1,678 (+12%) | 1mo | $284,900 | $170 | 47 |
Match score weights: distance 35% · size 25% · config 20% · recency 20%. Top-matched comps best support the ARV.
Projected returns pro-forma
10.0% appreciation · 0.32% rent growth · sell at horizon
- IRR
- 16.5%
- Equity multiple
- 2.35×
- Total profit
- $107,386
- Equity at exit
- $256,751
- IRR
- 15.3%
- Equity multiple
- 5.27×
- Total profit
- $340,447
- Equity at exit
- $553,692
Cash invested: $79,800 (down + closing). Projections, not guarantees.
Landlord ↔ Tenant lean methodology
- Overall (STATE)
- 87 Strongly Landlord-Friendly
- State Texas
- 87 Strongly Landlord-Friendly · R+5
- County
- — inherits STATE
- City
- — inherits STATE
ZIP-level market 77354
- Home prices YoY
- 2.4%
- Rents YoY
- 0.3%
- Active inventory
- 1622
- Price-to-rent
- 11.6×
Monthly cashflow live
- Estimated rent
- $2,055 high interval (Pro) →
- Mortgage (P&I)
- −$1,495
- Tax from tax record
- −$618 /mo · $7,417/yr
- Insurance
- −$119
- HOA
- −$62
- Vacancy / Maint / Mgmt
- −$432
- Net cashflow
- $-670
Break-even live
Sensitivity live
| Price | -10% $-509 | -5% $-589 | +0% $-670 | +5% $-751 | +10% $-831 |
|---|---|---|---|---|---|
| Rent | -10% $-832 | -5% $-751 | +0% $-670 | +5% $-589 | +10% $-508 |
| Rate | -1.0pp $-526 | -0.5pp $-597 | base $-670 | +0.5pp $-744 | +1.0pp $-819 |
UW: 25.0% down · 7.5% · 30yr · 1.5% tax · 5.0% vac · 8.0% maint · 8.0% mgmt
Financing live
Cash to close
- Down payment
- $71,250
- Closing costs
- $8,550
- Reserves months
- —
- Total cash needed
- —
Loan-product check · same deal, 3 products live
Conventional
25% down · 7.5% · 30yr
- Down + closing
- —
- Monthly P&I
- —
- Monthly cashflow
- —
- DSCR
- —
- Eligible?
- —
Personal DTI + credit; lowest rate.
DSCR
20% down · 8.5% · 30yr
- Down + closing
- —
- Monthly P&I
- —
- Monthly cashflow
- —
- DSCR
- —
- Eligible?
- —
No personal income docs; deal must DSCR.
Hard money
10% down · 12.0% · 12mo
- Down + closing
- —
- Monthly P&I
- —
- Monthly cashflow
- —
- DSCR
- —
- Eligible?
- —
Short-term bridge; refi at stabilization.
Rent comps 18 comps
| Address | Beds | Baths | Sqft | Rent | $/sqft | DOM | Units | Dist |
|---|---|---|---|---|---|---|---|---|
| 260 Gallant Front Ln Magnolia, TX | 3.0 | 2.0 | 1410 | $1,975 | $1.40 | 26d | 1 | 0.21mi |
| 260 Gallant Front Ln Magnolia, TX | 3.0 | 2.0 | 1410 | $2,000 | $1.42 | 46d | 1 | 0.21mi |
| 131 Valiant Ridge Trl Magnolia, TX | 4.0 | 2.0 | 1840 | $2,280 | $1.24 | 1d | 1 | 0.26mi |
| 139 Valiant Ridge Trl Magnolia, TX | 3.0 | 2.0 | 1511 | $1,846 | $1.22 | 15d | 1 | 0.29mi |
| 7910 Alset Dr Magnolia, TX | 4.0 | 3.0 | 1897 | $2,320 | $1.22 | 46d | 1 | 0.45mi |
| 9396 Woodlands Pkwy Unit EASR Spring, TX | 2.0 | 2.0 | 1259 | $1,649 | $1.31 | 14d | 1 | 0.91mi |
| 9396 Woodlands Pkwy Unit EASR Spring, TX | 2.0 | 2.0 | 1259 | $1,649 | $1.31 | 26d | 1 | 0.91mi |
| 29980 Farm to Market Road 2978 Unit 2162 Magnolia, TX | 2.0 | 2.0 | 1177 | $1,883 | $1.60 | 7d | 1 | 1.14mi |
| 29980 Farm to Market Road 2978 Unit 2228 Magnolia, TX | 2.0 | 2.0 | 1177 | $1,867 | $1.59 | 1d | 1 | 1.14mi |
| 29980 Farm to Market Road 2978 Unit 3228 Magnolia, TX | 3.0 | 2.0 | 1578 | $2,320 | $1.47 | 1d | 1 | 1.14mi |
| 29980 Farm to Market Road 2978 Unit 2047 Magnolia, TX | 2.0 | 2.0 | 1177 | $1,918 | $1.63 | 13d | 1 | 1.16mi |
| 29980 Farm to Market Road 2978 Unit 3047 Magnolia, TX | 3.0 | 2.0 | 1578 | $2,371 | $1.50 | 13d | 1 | 1.16mi |
| 30000 FM 2978 Rd Magnolia, TX | 1.0–4.0 | 1.0–4.0 | 1175 | $1,768 | $1.50 | 0d | 47 | 1.18mi |
| 29980 Farm to Market Road 2978 Unit 30013 Magnolia, TX | 3.0 | 2.0 | 1578 | $2,360 | $1.50 | 12d | 1 | 1.19mi |
| 29980 Farm to Market Road 2978 Unit 30017 Magnolia, TX | 2.0 | 2.0 | 1177 | $1,907 | $1.62 | 12d | 1 | 1.19mi |
| 3 Peachridge Pl Unit 1 Spring, TX | 3.0 | 2.5 | 1657 | $1,950 | $1.18 | 23d | 1 | 1.25mi |
| 30006 Farm to Market Road 2978 Magnolia, TX | 2.0 | 1.0 | 1088 | $1,766 | $1.62 | 46d | 1 | 1.32mi |
| 10851 W Montfair Blvd The Woodlands, TX | 1.0–3.0 | 1.0–2.0 | 1067 | $2,339 | $2.19 | 15d | 45 | 1.41mi |
HOA detail
- Monthly dues
- $62 · $744/yr
Listing history 3 events
-
2026-04-18status Pending
-
2026-04-10status Pending
-
2026-04-02$285,000 Active
ⓘ Source: listings_history table (triggers on properties + properties_extension) + one-shot
backfill from property_details.listing_events for pre-trigger history.
Tax reassessment forecast TX · Resets to sale price
- Current annual tax
- $7,417 · $618/mo
- Projected year-2 tax
- $7,417 · $618/mo
- Expected delta
- $0/yr ($0/mo · 0.0%)
ⓘ Screening estimate from a state-policy table — verify with the county assessor before closing.
Nearby sold comps map
Loading sold comps map…
Walkable amenities ~0.75 mi
Loading nearby amenities…
Taxation est. · year 1
- Rental income
- $24,661
- − Mortgage interest
- −$15,964
- − Property taxes
- −$7,417
- − Insurance
- −$1,425
- − Repairs & maintenance
- −$1,973
- − Management
- −$1,973
- − HOA
- −$744
- − Depreciation
- −$8,291
- Taxable loss
- −$13,126
- Est. tax savings @ 24.0%
- +$3,150
- After-tax cash flow
- $-4,888/yr
For passive investors: Depreciation is non-cash, so a rental often shows a tax loss while cash-flowing — sheltering income. Rental losses are passive: they offset passive income freely, and up to $25,000/yr can offset ordinary (W-2) income if you actively participate and your MAGI is under $100k (phasing out to $0 by $150k); unused losses carry forward. On sale, claimed depreciation is recaptured at up to 25%, and gains may owe capital-gains tax (a 1031 exchange can defer both). Figures are a year-1 estimate at your 24.0% rate — not tax advice; consult a CPA.
Schools (NCES district)
- District
- Magnolia ISD
- NCES district ID
- 4828740
- Math proficiency
- 42% ▼ -7.00%
- Reading proficiency
- 45% ▼ -4.00%
- Median HH income
- $71,692
- Composite
- 39.46/100
- National rank
- #3958
- State rank
- #247 of 826 in TX
Livability — The Woodlands
- Score
- 91/100
- State rank
- #1
- US rank
- #47
Category grades
Schools grade is shown separately in the Schools card above.
Census & demographics
- County
- Montgomery County · 663,713 people
- City population
- 106,505
- Metro
- Houston-The Woodlands-Sugar Land, TX
- Population (ZIP)
- 44,900
- Household income
- $112,504
- Rent vs Own
- Severe rent burden
- 586.0
Population outlook (Montgomery County) Hauer SSP2
- Today (2025)
- 713,896 people
- By 2030
- 805,263 · +12.8%
- By 2040
- 992,708 · +39.1%
- By 2050
- 1,179,590 · +65.2%
- By 2075
- 1,628,084 · +128.1%
- By 2100
- 1,937,880 · +171.5%
Race, ethnicity, and origin ACS 2023
- Neighborhood character
- Predominantly White (66%)
- Race & ethnicity
- White 66% Hispanic / Latino 25% Two or more races 18% Black 3% Asian 1%
- Hispanic origin (detail)
- Mexican 14% Puerto Rican 1%
- Common ancestry
- Lithuanian 4% Slovak 2% Italian 2%
- Foreign-born
- 11% · Canada, Vietnam
- Languages at home
- 83% English-only · Spanish 15% Other Indo-European 1% German/W. Germanic 1%
Political lean MEDSL · Montgomery
- 2024 margin
- Solid R (+45.5) · D 26.8% · R 72.3%
- 2008→2024 swing
- +7.2pp toward D · 2008: -52.7pp · 2024: -45.5pp
- All cycles
- 2024: R+45.5 2020: R+43.8 2016: R+51.4 2012: R+60.7 2008: R+52.7
Not yet ingested
- Civics
- —
Market trends
- HPI YoY
- ▲ 12.09%
- Current HPI
- 512.87
- Rent YoY
- ▲ 0.32%
- Metro
- Houston-The Woodlands-Sugar Land, TX
- State GDP YoY
- ▲ 3.95%
- F500 in state
- 110
Industry mix (Fortune 500 HQ in TX)
| Industry | F500 HQs | Revenue |
|---|---|---|
| Energy | 16 | $1,198B |
|
||
| Technology | 5 | $198B |
|
||
| Engineering / Construction | 4 | $72B |
|
||
| Energy Services | 3 | $60B |
|
||
| Utilities | 3 | $41B |
|
||
| Healthcare | 2 | $330B |
|
||
Price history
3 events — show timeline
- 2026-04-18 Pending — HARMLS
- 2026-04-10 Pending — HARMLS
- 2026-04-02 Listed $285,000 HARMLS
Property tax history
+354.6%/yrLatest (2025): $7,417 · +354.6% YoY. Source: county tax records.
Cash-flow waterfall
monthlySold comps — $/sqft
last 12 mo · ≤1 miLoading sold comps…