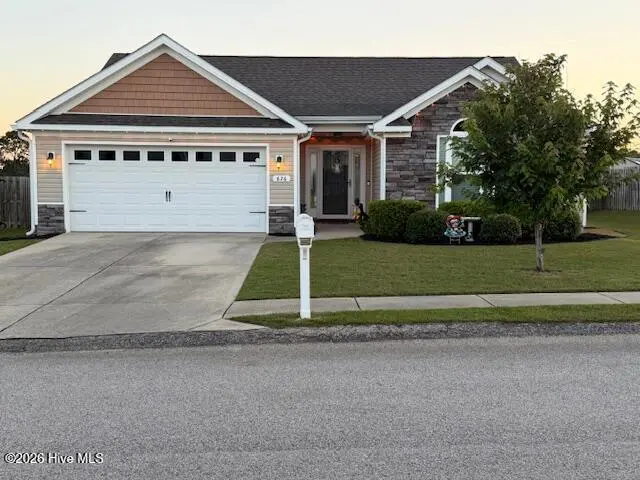
626 Wade Way · Burnettown, SC
Flood risk 1/10 · Minimal
- FEMA flood zone
- X (unshaded)
- Chance of flooding over 30 yrs
- 0.0%
- Est. flood insurance / yr
- $507 – $1,088
Fire risk 5/10 · Moderate
- Est. fire insurance / yr
- $783 – $1,453
Heat risk 7/10 · Major
- Hot days now (above 109°F)
- 7 days/yr
- Hot days in 30 yrs
- 17 days/yr
Wind risk 6/10 · Moderate
- Chance of severe wind over 30 yrs
- 66.0%
Air-quality risk 3/10 · Minor
- Unhealthy air days now
- 3 days/yr
- Unhealthy air days in 30 yrs
- 4 days/yr
Risk factors via First Street. Map © Google.
Why this score? — see what drove the C- grade
The composite is a weighted blend of 9 inputs, each scored 0–100. Each bar is that input's sub-score; the figure is the points it added to the 100-point composite (weight × sub-score).
- Cash flow +15.8/30.0
- Appreciation +9.2/10.0
- ARV discount +7.0/15.0
- DSCR +4.9/10.0
- 1% rule +3.2/10.0
- Schools +3.2/10.0
- Livability +3.2/5.0
- Rent growth +2.5/5.0
- Condition / age +2.5/5.0
$297,000
🖨 Deal sheet (PDF) 📄 Offer letter ✓ Due diligence
Listing remarks MLS
Fantastic 3BD 2BA ranch home featuring upgraded hardwoods in foyer, family room and sunroom. Family room has high ceilings with fireplace. Large kitchen includes granite countertops, tiled backsplash, built in speaker system and stainless steel appliances with built in microwave & refrigerator to remain with acceptable offer. Large master suite with walk in closet, garden tub, and separate shower. Sunroom least large privacy fenced backyard with gutters around the house. This home has many upgrades! Schedule your showing today!
Key facts
- Easy access
- Great location
- Upgraded hardwoods
Tags
Property features AI
Finance
- Other: Zoning: R-15
- HOA & community: Homeowners association with annual fee; Annual association fee: $295 (approximately $24.58/month); Community cabana; Community pool; Sidewalks and street lights
Exterior
- Parking: Attached 2-car garage; Concrete parking; Garage door opener
- Security: Smoke detectors
- Utilities: Public water; Public sewer; Cable available; Natural gas for heating and water heater
- Home design: Single-family residence; One story; Entry level: 1; Construction: Stone, vinyl siding, and frame; Foundation: Slab
- Construction: Built with stone, vinyl siding, and frame; Slab foundation; Shingle roof
- Exterior features: Covered rear porch; Privacy fencing; Fenced yard; Shingle roof; Landscaped yard; Front and rear sprinklers; Paved road access; Has a view
Interior
- Kitchen: Gas cooktop; Electric oven; Range; Dishwasher; Microwave; Disposal; Vented exhaust fan; Pantry; Eat-in kitchen
- Bedrooms: Total rooms: 6
- Flooring: Carpet; Vinyl; Hardwood
- Bathrooms: 2 full bathrooms
- Heating & cooling: Forced air heating (natural gas); Fireplace(s); Central air; Ceiling fans
- Interior features: Sound system; Walk-in closets; Entrance foyer; Pantry; Eat-in kitchen; Window coverings
- Laundry & utility: Washer hookup; Laundry room; Gas water heater
Neighborhood map
What this means for you Summary
Snapshot
- This is a 3-bed/2.0-bath single-family listed at $297k.
Deal economics
- At list price, monthly cash flow is $133 ($2k/yr) — positive.
- The deal already cash-flows at list — no discount required.
- To meet the 1% rule (rent ≥ 1% of price), the offer needs to be $243k (18.3% below list).
- Recommended offer: $243k (18.3% below list) — sets the bar for 1% rule.
- Cap rate 6.8% vs local median 5.5% in Burnettown — meaningfully above typical; check what's discounted (condition, days-on-market, listing class) to confirm the premium yield is real.
Location & tenants
- Location reads 64/100 on livability (#159 in SC) — a middle-class / working-renter tenant base. Strengths: crime A+, cost of living A+, housing A+; Watch: amenities F, commute F, employment D-.
- Aiken 01 (suburban): math 31% / reading 44% proficiency, ranked #36 of 80 in SC (top 45%) — families likely to look elsewhere, expect single-tenant / working-renter base with shorter leases.
- Zoned schools: Byrd Elementary (math 28% / reading 36%, grade F, #369 of 597 statewide, top 64%, 657 students, 37% FRL); Leavelle Mccampbell Middle (math 19% / reading 32%, grade F, #162 of 229 statewide, top 71%, 650 students, 55% FRL); Midland Valley High (math 31% / reading 83%, grade C, #120 of 196 statewide, top 64%, 1,477 students, 62% FRL) — zoned schools at 51% FRL track the district average.
- Market conditions: 298 active listings in the ZIP; 2 comparable units currently listed for rent nearby; solid renter incomes; 2,500 units permitted in Aiken County in 2024 (1,023 in 5+ unit buildings).
Forward outlook
- In year one you build about $27k of equity ($2k loan paydown + $25k appreciation (8.4% local appreciation)).
- Aiken County population projected at +9% by 2050 — modest demand growth; plan on rents tracking national, not racing it.
- At projected returns (8.4% appreciation + 3.0% rent growth), your $83k cash investment doubles in ~3 years — after that, you're playing with house money.
- By year 2, paydown + projected appreciation supports a ~$43k cash-out refi (75% LTV) — recoverable capital for the next deal without selling this one.
Negotiation context
- It's been on market 16 days — a 2% lower offer ($293k) is reasonable based on typical stale-listing flexibility.
- 7 sale attempts since 11y ago with the ask held roughly flat each time — persistent listings suggest the price (not the market) is what's stuck; bring a comps-based counter.
- Current owner paid $200k; 49% above their basis — modest negotiation headroom, anchor on the comps not their cost.
Risks & watch-outs
- Climate carrying-cost: major wind risk, 66% chance of damaging wind over 30y; moderate wildfire risk; extreme-heat days projected 7→17/yr by 2055 (HVAC capex compounding) — expect insurance premiums to compound above CPI over the hold.
Questions for the listing agent
- What does the HOA fee cover, when was the last increase, and are there any pending special assessments or reserve-fund shortfalls?
- Is there a deadline driving the sale (1031 exchange, divorce, estate, relocation)? That informs how much negotiation room exists.
- Schools are D-rated, which usually means shorter tenancies and higher turnover. Who's the typical renter profile here, and what's been the actual vacancy rate?
- What's the average days-on-market for RENTAL listings here right now (not sales)? A rising rental-DOM trend means longer vacancies and softer asking-rent achievability than the comps imply.
- What's the recent tenant-quality profile in this submarket — average credit score on applications, eviction rate, late-payment / NSF rate, and stable-employment percentage? A property-management company in the area should have these aggregated.
- How much new for-sale + rental construction is in the pipeline within 1–3 miles? Heavy new supply typically softens prices + rents 12–24 months out; constrained supply supports both.
Investment metrics
- 1% rule
- 0.82% ✗
- Cap rate
- 6.83%
- Cash-on-cash
- 1.93%
- DSCR
- 1.09
- GRM
- 10.2
CMA / ARV
- ARV (on-the-fly)
- $293,415
- Comps found
- 12
Show comp detail 12 sales within ~0.75 mi
| Address | Dist | Beds/Ba | Sqft | Sold | Price | $/sf | Match |
|---|---|---|---|---|---|---|---|
| 462 Country Glen Ave | 0.18mi | 3/2.0 | 1,765 (-7%) | 1mo | $277,500 | $157 | 80 |
| 224 Baylor Dr | 0.07mi | 3/2.0 | 1,672 (-12%) | 2mo | $292,000 | $175 | 76 |
| 182 Sutton Ct | 0.40mi | 3/2.0 | 1,862 (-2%) | 8mo | $300,000 | $161 | 72 |
| 7121 Grayson Dr | 0.20mi | 3/2.0 | 1,693 (-11%) | 7mo | $289,900 | $171 | 67 |
| 209 Country Glen Ave | 0.42mi | 3/2.0 | 1,768 (-7%) | 6mo | $265,000 | $150 | 64 |
| 870 Tess St | 0.72mi | 3/2.5 | 1,890 (-0%) | 2mo | $292,295 | $155 | 62 |
| 167 Midland Pines Dr | 0.62mi | 3/2.0 | 1,926 (+2%) | 8mo | $310,000 | $161 | 62 |
| 3145 Camden Way | 0.74mi | 3/2.5 | 1,880 (-1%) | 2mo | $265,000 | $141 | 61 |
| 300 Country Glen Avenue Ave | 0.40mi | 3/3.0 | 2,128 (+12%) | 9mo | $325,000 | $153 | 49 |
| 871 Tess St | 0.70mi | 4/2.5 (+1) | 2,046 (+8%) | 3mo | $275,900 | $135 | 44 |
| 902 Tess St | 0.74mi | 4/2.5 (+1) | 2,046 (+8%) | 2mo | $275,900 | $135 | 43 |
| 925 Tess St | 0.74mi | 4/2.5 (+1) | 2,046 (+8%) | 4mo | $286,900 | $140 | 42 |
Match score weights: distance 35% · size 25% · config 20% · recency 20%. Top-matched comps best support the ARV.
Projected returns pro-forma
8.38% appreciation · 3.0% rent growth · sell at horizon
- IRR
- 22.3%
- Equity multiple
- 2.66×
- Total profit
- $137,980
- Equity at exit
- $233,362
- IRR
- 20.3%
- Equity multiple
- 5.74×
- Total profit
- $394,209
- Equity at exit
- $470,786
Cash invested: $83,160 (down + closing). Projections, not guarantees.
Landlord ↔ Tenant lean methodology
- Overall (STATE)
- 90 Strongly Landlord-Friendly
- State South Carolina
- 90 Strongly Landlord-Friendly · R+6
- County
- — inherits STATE
- City
- — inherits STATE
ZIP-level market 29829
- Home prices YoY
- 3.0%
- Active inventory
- 298
- Price-to-rent
- 10.2×
Monthly cashflow live
- Estimated rent
- $2,427 medium interval (Pro) →
- Mortgage (P&I)
- −$1,558
- Tax from tax record
- −$78 /mo · $932/yr
- Insurance
- −$124
- HOA
- −$25
- Vacancy / Maint / Mgmt
- −$510
- Net cashflow
- $133
Break-even live
Sensitivity live
| Price | -10% $302 | -5% $218 | +0% $133 | +5% $49 | +10% $-35 |
|---|---|---|---|---|---|
| Rent | -10% $-58 | -5% $38 | +0% $133 | +5% $229 | +10% $325 |
| Rate | -1.0pp $283 | -0.5pp $209 | base $133 | +0.5pp $57 | +1.0pp $-22 |
UW: 25.0% down · 7.5% · 30yr · 1.5% tax · 5.0% vac · 8.0% maint · 8.0% mgmt
Financing live
Cash to close
- Down payment
- $74,250
- Closing costs
- $8,910
- Reserves months
- —
- Total cash needed
- —
Loan-product check · same deal, 3 products live
Conventional
25% down · 7.5% · 30yr
- Down + closing
- —
- Monthly P&I
- —
- Monthly cashflow
- —
- DSCR
- —
- Eligible?
- —
Personal DTI + credit; lowest rate.
DSCR
20% down · 8.5% · 30yr
- Down + closing
- —
- Monthly P&I
- —
- Monthly cashflow
- —
- DSCR
- —
- Eligible?
- —
No personal income docs; deal must DSCR.
Hard money
10% down · 12.0% · 12mo
- Down + closing
- —
- Monthly P&I
- —
- Monthly cashflow
- —
- DSCR
- —
- Eligible?
- —
Short-term bridge; refi at stabilization.
Rent comps 2 comps
| Address | Beds | Baths | Sqft | Rent | $/sqft | DOM | Units | Dist |
|---|---|---|---|---|---|---|---|---|
| 618 Count Fleet Ct Graniteville, SC | 4.0 | 2.5 | 2362 | $2,299 | $0.97 | 23d | 1 | 1.00mi |
| 6279 Whirlaway Rd Graniteville, SC | 3.0 | 2.0 | 1295 | $1,900 | $1.47 | 23d | 1 | 1.02mi |
HOA detail
- Monthly dues
- $25 · $300/yr
Listing history 12 events
-
2026-06-21days on market $297,000 Active 16 DOM
-
2026-06-18days on market $297,000 Active 13 DOM
-
2026-06-17days on market $297,000 Active 12 DOM
-
2026-06-16days on market $297,000 Active 11 DOM
-
2026-06-15days on market $297,000 Active 10 DOM
-
2026-06-14days on market $297,000 Active 8 DOM
-
2026-06-13days on market $297,000 Active 7 DOM
-
2026-06-10days on market $297,000 Active 5 DOM
-
2026-06-09days on market $297,000 Active 4 DOM
-
2026-06-08days on market $297,000 Active 3 DOM
-
2026-06-07remarks 618-char remark
-
2026-06-07$297,000 Active 2 DOM
ⓘ Source: listings_history table (triggers on properties + properties_extension) + one-shot
backfill from property_details.listing_events for pre-trigger history.
Tax reassessment forecast SC · Resets to sale price
- Current annual tax
- $932 · $78/mo
- Projected year-2 tax
- $1,693 · $141/mo
- Expected delta
- +$761/yr (+$63/mo · 81.6%)
ⓘ Screening estimate from a state-policy table — verify with the county assessor before closing.
Climate risk First Street
- Flood 1/10 Low FEMA zone X (unshaded) · 0% chance over 30 yrs
- Wildfire 5/10 Major
- Heat 7/10 Severe 7 d/yr ≥109°F today · 17 d/yr by 30 yrs out
- Wind 6/10 Major 66% chance of damaging wind over 30 yrs
- Air quality 3/10 Moderate 3 unhealthy d/yr today · 4 by 30 yrs out
Nearby sold comps map
Loading sold comps map…
Walkable amenities ~0.75 mi
Loading nearby amenities…
Taxation est. · year 1
- Rental income
- $29,125
- − Mortgage interest
- −$16,637
- − Property taxes
- −$932
- − Insurance
- −$1,485
- − Repairs & maintenance
- −$2,330
- − Management
- −$2,330
- − HOA
- −$300
- − Depreciation
- −$8,640
- Taxable loss
- −$3,529
- Est. tax savings @ 24.0%
- +$847
- After-tax cash flow
- $2,449/yr
For passive investors: Depreciation is non-cash, so a rental often shows a tax loss while cash-flowing — sheltering income. Rental losses are passive: they offset passive income freely, and up to $25,000/yr can offset ordinary (W-2) income if you actively participate and your MAGI is under $100k (phasing out to $0 by $150k); unused losses carry forward. On sale, claimed depreciation is recaptured at up to 25%, and gains may owe capital-gains tax (a 1031 exchange can defer both). Figures are a year-1 estimate at your 24.0% rate — not tax advice; consult a CPA.
Schools (NCES district)
- District
- Aiken 01
- NCES district ID
- 4500720
- Math proficiency
- 31% ▼ -11.00%
- Reading proficiency
- 44% ▼ -1.00%
- Median HH income
- $45,081
- Composite
- 31.91/100
- National rank
- #5857
- State rank
- #36 of 80 in SC
Livability — Burnettown
- Score
- 64/100
- State rank
- #159
- US rank
- #14711
Category grades
Schools grade is shown separately in the Schools card above.
Census & demographics
- County
- Aiken County · 116,534 people
- City population
- 12,385
- Metro
- Augusta-Richmond County, GA-SC
- Population (ZIP)
- 12,385
- Household income
- $84,228
- Rent vs Own
- Severe rent burden
- 213.0
Population outlook (Aiken County) Hauer SSP2
- Today (2025)
- 178,003 people
- By 2030
- 182,876 · +2.7%
- By 2040
- 189,970 · +6.7%
- By 2050
- 193,840 · +8.9%
- By 2075
- 199,453 · +12.1%
- By 2100
- 192,403 · +8.1%
Race, ethnicity, and origin ACS 2023
- Neighborhood character
- Diverse neighborhood (Simpson 0.58)
- Race & ethnicity
- White 59% Black 26% Hispanic / Latino 12% Two or more races 9% Asian 1%
- Hispanic origin (detail)
- Mexican 8% Puerto Rican 1%
- Common ancestry
- Italian 2% Swedish 2% Slovak 1%
- Foreign-born
- 6% · Canada
- Languages at home
- 89% English-only · Spanish 10% Other Indo-European 1%
Political lean MEDSL · Aiken
- 2024 margin
- Strong R (+25.9) · D 36.4% · R 62.2% · Other 1.4%
- 2008→2024 swing
- -1.9pp toward R · 2008: -24.0pp · 2024: -25.9pp
- All cycles
- 2024: R+25.9 2020: R+22.7 2016: R+27.5 2012: R+26.0 2008: R+24.0
Not yet ingested
- Civics
- —
Market trends
- HPI YoY
- ▲ 8.38%
- Current HPI
- 286.4155
- Rent YoY
- —
- Metro
- Augusta-Richmond County, GA-SC
- State GDP YoY
- ▲ 4.51%
- F500 in state
- 2
Industry mix (Fortune 500 HQ in SC)
| Industry | F500 HQs | Revenue |
|---|---|---|
| Packaging | 1 | $7B |
|
||
Price history
+75.8% since first listed14 events — show timeline
- 2026-06-05 Listed $297,000 Hive MLS
- 2020-06-30 Sold (MLS) $199,500 AMLS
- 2020-06-24 Sold (Public Records) $199,500 Public Records
- 2020-06-22 Sold (MLS) $199,500 Hive MLS
- 2020-06-22 Sold (MLS) $199,500 Hive MLS
- 2020-03-04 Listed $199,500 Hive MLS
- 2020-03-04 Listed $199,500 Hive MLS
- 2020-03-04 Listed $199,500 AMLS
- 2015-04-01 Sold (MLS) $170,741 AMLS
- 2015-04-01 Sold (MLS) $170,741 Hive MLS
- 2015-04-01 Sold (MLS) $170,741 Hive MLS
- 2015-01-02 Listed $168,900 AMLS
- 2015-01-02 Listed $168,900 Hive MLS
- 2015-01-02 Listed $168,900 Hive MLS
Property tax history
+3.1%/yrLatest (2025): $932 · +0.0% YoY. Source: county tax records.
Cash-flow waterfall
monthlySold comps — $/sqft
last 12 mo · ≤1 miLoading sold comps…