 15-Plex
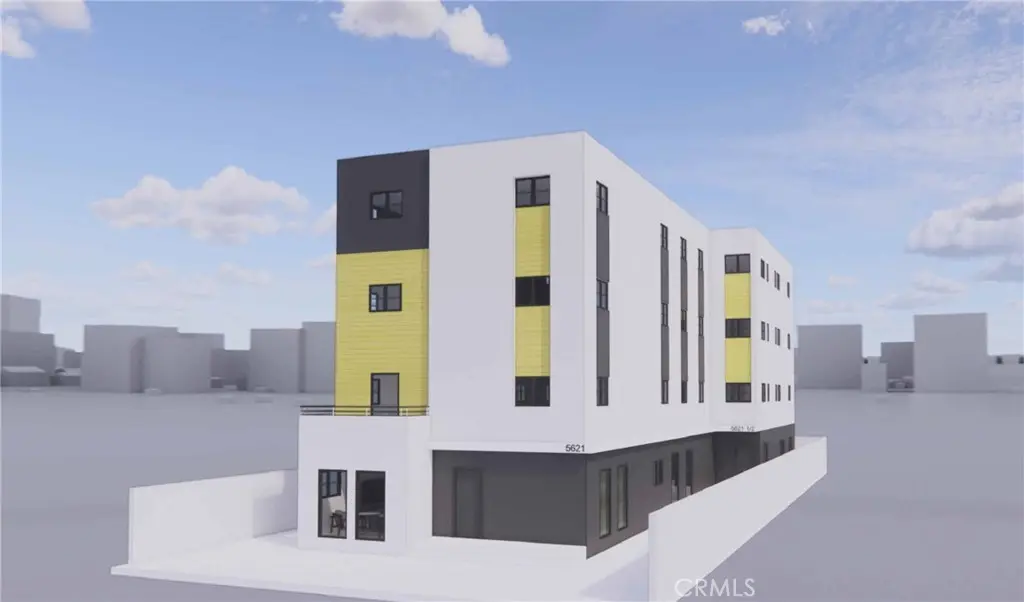
5621 La Mirada Ave · Los Angeles, CA
Flood risk 1/10 · Minimal
- FEMA flood zone
- X (unshaded)
- Chance of flooding over 30 yrs
- 0.0%
- Est. flood insurance / yr
- $507 – $1,088
Fire risk 1/10 · Minimal
- Est. fire insurance / yr
- $659 – $1,223
Heat risk 6/10 · Moderate
- Hot days now (above 90°F)
- 7 days/yr
- Hot days in 30 yrs
- 21 days/yr
Wind risk 1/10 · Minimal
- Chance of severe wind over 30 yrs
- —
Air-quality risk 5/10 · Moderate
- Unhealthy air days now
- 8 days/yr
- Unhealthy air days in 30 yrs
- 8 days/yr
Risk factors via First Street. Map © Google.
Why this score? — see what drove the B- grade
The composite is a weighted blend of 9 inputs, each scored 0–100. Each bar is that input's sub-score; the figure is the points it added to the 100-point composite (weight × sub-score).
- Cash flow +30.0/30.0
- 1% rule +10.0/10.0
- DSCR +10.0/10.0
- ARV discount +7.5/15.0
- Schools +3.6/10.0
- Livability +3.4/5.0
- Rent growth +2.7/5.0
- Condition / age +2.5/5.0
- Appreciation +0.0/10.0
$1,870,000
🖨 Deal sheet (PDF) 📄 Offer letter ✓ Due diligence
Multi-family units
County records classify this as Multi-Family (2-4 Unit). Listing-text estimate: 15 units. estimate disagrees with records
Listing remarks MLS
RTI ready! This Hollywood project offers an excellent investment opportunity in a high-demand rental market. Situated in the heart of Hollywood, close to major job centers, schools, and public transportation. With a modern co-living design, 45 private bedrooms, each with ensuite bathrooms—ideal for young professionals or transitional housing program. Walking distance to Netflix headquarter and near the Walk of Fame, TCL Chinese Theatre, Hollywood Bowl, Sunset Boulevard & Hollywood Nightlife , Downtown Los Angeles, and everything else Los Angeles has to offer. This is a great opportunity for housing groups specializing in student housing, young professionals entering the workforce, corporate housing, healthcare assisted living, transition and affordable housing. Tenants will enjoy all the benefits of modern living in a prime area of Hollywood near the 110 Fwy. It has a strong rental income potential, the project is positioned to generate significant returns for investors through both rental revenue and appreciation upon sale. This Hollywood Project represents a rare opportunity to invest in a new, fully entitled, high-density residential building designed for long-term rental income or resale. With a proven co-living business model, low vacancy risk, and prime Los Angeles location, this project offers investors stable cash flow and significant upside potential.
Key facts
- Private bedrooms
- Ensuite bathrooms
- Near hollywood bowl
Tags
Neighborhood map
What this means for you Summary
Snapshot
- This is a 15 × 1-bed/?-bath units multifamily listed at $1.87M.
Deal economics
- At list price, monthly cash flow is $12k ($144k/yr) — positive. Per door: $802/mo.
- The deal already cash-flows at list — no discount required.
- Meets the 1% rule at list price ($30k rent vs $1.87M).
- Recommended offer: $1.65M (12.0% below list) — sets the bar for market timing.
- Cap rate 14.0% vs local median 2.1% in Los Angeles — top-decile yield for the area; either an underpriced asset or a hidden risk that comps aren't pricing in. Stress-test before assuming the spread holds.
Location & tenants
- Location reads 68/100 on livability (#273 in CA) — a middle-class / working-renter tenant base. Strengths: amenities A+, commute A+, employment B; Watch: health & safety C-, crime F, cost of living F.
- Los Angeles Unified (urban): math 29% / reading 54% proficiency, ranked #223 of 517 in CA (top 43%) — families likely to look elsewhere, expect single-tenant / working-renter base with shorter leases; 67% free/reduced lunch — lower-income household profile, screen leases tightly.
- Zoned schools: Joseph Le Conte Middle (659 students, 94% FRL); Valley Academy of Arts And Sciences (math 22% / reading 52%, grade F, #578 of 1,170 statewide, top 51%, 868 students, 64% FRL).
- Market conditions: Rents flat; 88 active listings in the ZIP; 40 comparable units currently listed for rent nearby; rentals at typical pace (median 24d on market — plan ~3-4 weeks tenant-placement turnaround); 19,697 units permitted in Los Angeles County in 2024 (9,426 in 5+ unit buildings).
Forward outlook
- Local home prices are declining (-3.0%/yr); year-one equity from $13k of loan paydown is wiped out by about $56k of value loss. Plan a longer hold.
- Los Angeles County population projected at +9% by 2050 — modest demand growth; plan on rents tracking national, not racing it.
- At projected returns (-3.0% appreciation + 0.7% rent growth), your $524k cash investment doubles in ~5 years — after that, you're playing with house money.
Negotiation context
- It's been on market 223 days — a 12% lower offer ($1.65M) is reasonable based on typical stale-listing flexibility.
- 9 sale attempts since 8y ago with the ask held roughly flat each time — persistent listings suggest the price (not the market) is what's stuck; bring a comps-based counter.
- Current owner paid $1.30M; 44% above their basis — modest negotiation headroom, anchor on the comps not their cost.
Risks & watch-outs
- Watch-outs: built in 1920 — expect roof / HVAC / electrical / plumbing capex.
- Climate carrying-cost: extreme-heat days projected 7→21/yr by 2055 (HVAC capex compounding) — expect insurance premiums to compound above CPI over the hold.
Questions for the listing agent
- It's been on market 223 days. Have you received any prior offers? Is the seller open to a 12% concession, seller financing, or rate buy-down credit?
- Can we see the unit-by-unit rent roll, current vacancy, and any below-market leases? What's the average tenancy length?
- What capital expenditures (roof, boiler, parking lot, exteriors) have been made in the last 5 years, and what's planned in the next 2?
- Built in 1920 — when were the roof, HVAC, electrical panel, plumbing, and water heater last replaced?
- Why hasn't it sold? Are there any deal-killer items the seller is aware of (foundation, flood, title, zoning, code violations)?
- Is there a deadline driving the sale (1031 exchange, divorce, estate, relocation)? That informs how much negotiation room exists.
- Schools are D-rated, which usually means shorter tenancies and higher turnover. Who's the typical renter profile here, and what's been the actual vacancy rate?
- Crime grade is F in this area — have there been break-ins, vandalism, or insurance claims at this property in the last 3 years? What carrier currently insures it and at what premium?
- What's the average days-on-market for RENTAL listings here right now (not sales)? A rising rental-DOM trend means longer vacancies and softer asking-rent achievability than the comps imply.
- What's the recent tenant-quality profile in this submarket — average credit score on applications, eviction rate, late-payment / NSF rate, and stable-employment percentage? A property-management company in the area should have these aggregated.
- How much new apartment / multifamily construction is in the pipeline within 1–3 miles? Heavy new supply (>2% of stock underway) typically softens rents 12–24 months out; light construction supports rent growth.
Investment metrics
- 1% rule
- 1.62% ✓
- Cap rate
- 14.02%
- Cash-on-cash
- 27.58%
- DSCR
- 2.23
- GRM
- 5.1
CMA / ARV
- ARV (median comp)
- $3,833,800
- List price
- $1,870,000
- Delta
- -51.22%
- Verdict
- UNDERPRICED
- Comps
- 20 within 1.0 mi
Projected returns pro-forma
-3.0% appreciation · 0.67% rent growth · sell at horizon
- IRR
- 19.1%
- Equity multiple
- 1.75×
- Total profit
- $393,758
- Equity at exit
- $278,823
- IRR
- 25.8%
- Equity multiple
- 3.02×
- Total profit
- $1,056,964
- Equity at exit
- $161,683
Cash invested: $523,600 (down + closing). Projections, not guarantees.
Landlord ↔ Tenant lean methodology
- Overall (CITY)
- 0 Strongly Tenant-Friendly
- State California
- 18 Strongly Tenant-Friendly · D+13
- County
- — inherits STATE
- City Los Angeles
- 0 Strongly Tenant-Friendly · D+22
ZIP-level market 90038
- Rents YoY
- 0.7%
- Active inventory
- 88
- Price-to-rent
- 77.0×
Monthly cashflow live
- Estimated rent
- $30,339 high interval (Pro) →
- Mortgage (P&I)
- −$9,806
- Tax from tax record
- −$1,348 /mo · $16,180/yr
- Insurance
- −$779
- HOA
- −$0
- Vacancy / Maint / Mgmt
- −$6,371
- Net cashflow
- $12,034
Break-even live
Sensitivity live
| Price | -10% $13,092 | -5% $12,563 | +0% $12,034 | +5% $11,505 | +10% $10,975 |
|---|---|---|---|---|---|
| Rent | -10% $9,637 | -5% $10,835 | +0% $12,034 | +5% $13,232 | +10% $14,431 |
| Rate | -1.0pp $12,976 | -0.5pp $12,509 | base $12,034 | +0.5pp $11,549 | +1.0pp $11,056 |
15-unit breakdown (identical units grouped — click to expand)
| Units | Beds | Baths | Est. rent |
|---|---|---|---|
| 15× units | 1 | — | $30,345 |
| #1 | 1 | — | $2,023 |
| #2 | 1 | — | $2,023 |
| #3 | 1 | — | $2,023 |
| #4 | 1 | — | $2,023 |
| #5 | 1 | — | $2,023 |
| #6 | 1 | — | $2,023 |
| #7 | 1 | — | $2,023 |
| #8 | 1 | — | $2,023 |
| #9 | 1 | — | $2,023 |
| #10 | 1 | — | $2,023 |
| #11 | 1 | — | $2,023 |
| #12 | 1 | — | $2,023 |
| #13 | 1 | — | $2,023 |
| #14 | 1 | — | $2,023 |
| #15 | 1 | — | $2,023 |
| Total (15 units) | $30,339 | ||
UW: 25.0% down · 7.5% · 30yr · 1.5% tax · 5.0% vac · 8.0% maint · 8.0% mgmt
Financing live
Cash to close
- Down payment
- $467,500
- Closing costs
- $56,100
- Reserves months
- —
- Total cash needed
- —
Loan-product check · same deal, 3 products live
Conventional
25% down · 7.5% · 30yr
- Down + closing
- —
- Monthly P&I
- —
- Monthly cashflow
- —
- DSCR
- —
- Eligible?
- —
Personal DTI + credit; lowest rate.
DSCR
20% down · 8.5% · 30yr
- Down + closing
- —
- Monthly P&I
- —
- Monthly cashflow
- —
- DSCR
- —
- Eligible?
- —
No personal income docs; deal must DSCR.
Hard money
10% down · 12.0% · 12mo
- Down + closing
- —
- Monthly P&I
- —
- Monthly cashflow
- —
- DSCR
- —
- Eligible?
- —
Short-term bridge; refi at stabilization.
Rent comps 40 comps
| Address | Beds | Baths | Sqft | Rent | $/sqft | DOM | Units | Dist |
|---|---|---|---|---|---|---|---|---|
| 5667 La Mirada Ave Los Angeles, CA | 2.0 | 1.0 | 700 | $2,295 | $3.28 | 45d | 1 | 0.07mi |
| 5639 Lexington Ave Los Angeles, CA | 4.0 | 1.0–4.0 | 725 | $2,400 | $3.31 | 26d | 8 | 0.08mi |
| 5662 La Mirada Ave Los Angeles, CA | 2.0 | 2.0–2.5 | 1150 | $2,772 | $2.41 | 45d | 1 | 0.08mi |
| 5612 Lexington Ave Unit 203 Los Angeles, CA | 1.0 | 1.0 | 536 | $2,249 | $4.20 | 26d | 1 | 0.10mi |
| 5612 Lexington Ave Unit 204 Los Angeles, CA | 2.0 | 2.0 | 950 | $3,195 | $3.36 | 26d | 1 | 0.11mi |
| 1275 N Wilton Pl Unit C Los Angeles, CA | 1.0 | 1.0 | 1100 | $2,200 | $2.00 | 26d | 1 | 0.11mi |
| 1275 N Wilton Pl Los Angeles, CA | 1.0 | 1.0 | 1100 | $2,800 | $2.55 | 45d | 1 | 0.11mi |
| 5657 Virginia Ave Unit 202 Los Angeles, CA | 1.0 | 1.0 | 626 | $2,399 | $3.83 | 26d | 1 | 0.15mi |
| 5620 De Longpre Ave Los Angeles, CA | 1.0–2.0 | 1.0–2.0 | 1052 | $4,971 | $4.72 | 1d | 10 | 0.18mi |
| 5460 Fountain Ave Los Angeles, CA | 1.0–5.0 | 1.0–4.0 | 925 | $1,824 | $1.97 | 20d | 10 | 0.19mi |
| 5753 Lexington Ave Los Angeles, CA | 1.0 | 1.0 | 620 | $1,600 | $2.58 | 18d | 1 | 0.21mi |
| 5753 Lexington Ave Unit 4 Los Angeles, CA | 1.0 | 1.0 | 620 | $1,699 | $2.74 | 45d | 1 | 0.21mi |
| 5750 Lexington Ave Los Angeles, CA | 1.0 | 1.0 | 670 | $2,236 | $3.34 | 23d | 1 | 0.22mi |
| 5437 Virginia Ave Unit 106 Los Angeles, CA | 2.0 | 1.0 | 650 | $2,250 | $3.46 | 16d | 1 | 0.25mi |
| 5442 Virginia Ave Unit 6 Los Angeles, CA | 2.0 | 1.0 | 785 | $2,350 | $2.99 | 26d | 1 | 0.27mi |
| 5421 Flemish Ln Unit 5437 Los Angeles, CA | 1.0 | 1.0 | 612 | $1,950 | $3.19 | 5d | 1 | 0.31mi |
| 5425 Santa Monica Blvd Los Angeles, CA | 1.0 | 1.0 | 738 | $1,362 | $1.85 | 5d | 1 | 0.32mi |
| 5522 Sierra Vista Ave Los Angeles, CA | 1.0 | 1.0 | 550 | $1,695 | $3.08 | 45d | 1 | 0.32mi |
| 5837 Virginia Ave Los Angeles, CA | 1.0 | 1.0 | 625 | $1,895 | $3.03 | 1d | 1 | 0.32mi |
| 5612 Harold Way Unit 11 Los Angeles, CA | 2.0 | 1.5 | 1000 | $2,495 | $2.50 | 16d | 1 | 0.34mi |
| 5618 Harold Way Unit 2 Los Angeles, CA | 1.0 | 1.0 | 680 | $2,095 | $3.08 | 16d | 1 | 0.34mi |
| 5420 W Sunset Blvd Los Angeles, CA | 2.0 | 1.0–2.0 | 878 | $10,005 | $11.40 | 4d | 90 | 0.35mi |
| 1170 N Bronson Ave Los Angeles, CA | 1.0 | 1.0 | 650 | $2,200 | $3.38 | 45d | 1 | 0.35mi |
| 1376 N Serrano Ave Los Angeles, CA | 1.0 | 1.0 | 680 | $1,950 | $2.87 | 9d | 1 | 0.35mi |
| 1323 N Bronson Ave Unit 11 Hollywood, CA | 2.0 | 1.0 | 1000 | $2,495 | $2.50 | 16d | 1 | 0.37mi |
| 5555 Harold Way Los Angeles, CA | 1.0–2.0 | 1.0–2.0 | 675 | $2,775 | $4.11 | 45d | 1 | 0.39mi |
| 1417 N Bronson Ave Los Angeles, CA | 1.0 | 1.0 | 550 | $1,895 | $3.45 | 13d | 3 | 0.39mi |
| 1415 N Hobart Blvd Los Angeles, CA | 2.0 | 1.0 | 900 | $2,287 | $2.54 | 3d | 1 | 0.40mi |
| 1415 N Hobart Blvd Los Angeles, CA | 3.0 | 1.0 | 1100 | $2,582 | $2.35 | 14d | 1 | 0.40mi |
| 1433 N Bronson Ave Unit 6 Los Angeles, CA | 1.0 | 1.0 | 600 | $1,650 | $2.75 | 45d | 1 | 0.40mi |
| 5800 Harold Way Los Angeles, CA | 3.0 | 1.0–2.0 | 1036 | $3,445 | $3.32 | 1d | 7 | 0.41mi |
| 5837 W Sunset Blvd Los Angeles, CA | 2.0 | 2.0 | 1052 | $3,170 | $3.01 | 1d | 1 | 0.42mi |
| 1422 Tamarind Ave Los Angeles, CA | 1.0–2.0 | 1.0–2.0 | 782 | $3,185 | $4.07 | 23d | 4 | 0.42mi |
| 5426 Harold Way Los Angeles, CA | 2.0 | 2.0 | 1000 | $2,503 | $2.50 | 26d | 1 | 0.42mi |
| 955 Saint Andrews Pl #1 Los Angeles, CA | 1.0 | 1.0 | 750 | $1,795 | $2.39 | 45d | 1 | 0.43mi |
| 1258 N Hobart Blvd Unit 1258 Los Angeles, CA | 2.0 | 2.5 | 1040 | $2,750 | $2.64 | 45d | 1 | 0.43mi |
| 1339 Tamarind Ave Los Angeles, CA | 3.0–4.0 | 3.0–4.0 | 1251 | $3,600 | $2.88 | 4d | 39 | 0.43mi |
| 1446 Tamarind Ave Los Angeles, CA | 2.0 | 2.0 | 970 | $2,925 | $3.02 | 45d | 1 | 0.44mi |
| 915 N Wilton Pl Unit 309 Los Angeles, CA | 1.0 | 1.0 | 850 | $2,100 | $2.47 | 45d | 1 | 0.45mi |
| 915 N Wilton Pl Apt 304 Los Angeles, CA | 1.0 | 1.0 | 850 | $1,975 | $2.32 | 23d | 1 | 0.45mi |
Listing history 41 events
-
2026-06-21days on market $1,870,000 Active 223 DOM
-
2026-06-18days on market $1,870,000 Active 220 DOM
-
2026-06-17days on market $1,870,000 Active 219 DOM
-
2026-06-16days on market $1,870,000 Active 218 DOM
-
2026-06-15days on market $1,870,000 Active 217 DOM
-
2026-06-13days on market $1,870,000 Active 215 DOM
-
2026-06-09days on market $1,870,000 Active 211 DOM
-
2026-06-08days on market $1,870,000 Active 210 DOM
-
2026-06-07days on market $1,870,000 Active 209 DOM
-
2026-06-04days on market $1,870,000 Active 206 DOM
-
2026-06-03days on market $1,870,000 Active 205 DOM
-
2026-06-02days on market $1,870,000 Active 204 DOM
-
2026-06-01days on market $1,870,000 Active 203 DOM
-
2026-05-31days on market $1,870,000 Active 202 DOM
-
2025-11-10$1,870,000 Active 1393-char remark
Show marketing remark (1393 chars)
RTI ready! This Hollywood project offers an excellent investment opportunity in a high-demand rental market. Situated in the heart of Hollywood, close to major job centers, schools, and public transportation. With a modern co-living design, 45 private bedrooms, each with ensuite bathrooms—ideal for young professionals or transitional housing program. Walking distance to Netflix headquarter and near the Walk of Fame, TCL Chinese Theatre, Hollywood Bowl, Sunset Boulevard & Hollywood Nightlife , Downtown Los Angeles, and everything else Los Angeles has to offer. This is a great opportunity for housing groups specializing in student housing, young professionals entering the workforce, corporate housing, healthcare assisted living, transition and affordable housing. Tenants will enjoy all the benefits of modern living in a prime area of Hollywood near the 110 Fwy. It has a strong rental income potential, the project is positioned to generate significant returns for investors through both rental revenue and appreciation upon sale. This Hollywood Project represents a rare opportunity to invest in a new, fully entitled, high-density residential building designed for long-term rental income or resale. With a proven co-living business model, low vacancy risk, and prime Los Angeles location, this project offers investors stable cash flow and significant upside potential.
-
2025-08-21historical
-
2025-08-09price $1,400,000
-
2025-05-02historical
-
2025-05-01$2,170,000 Active
-
2025-04-30$2,170,000 Active
-
2023-05-31historical
-
2023-03-29status Active
-
2023-03-29price $1,490,000
-
2023-03-28historical
-
2023-02-25$1,650,000 Active
-
2023-02-23historical
-
2021-12-16historical
-
2021-11-10$2,250,000 Active
-
2021-11-10historical
-
2020-04-02status Active
-
2020-04-02historical
-
2020-03-26historical
-
2020-01-31$2,050,000 Active
-
2018-12-07soldstatus $1,300,000 Closed Sale
-
2018-12-07soldstatus $1,300,000
-
2018-11-21status Pending Sale
-
2018-10-20$1,500,000 Active
-
2003-10-23soldstatus $250,000
-
2003-10-22soldstatus $250,000
-
1996-04-01soldstatus $135,000
-
1990-01-22soldstatus $260,000
ⓘ Source: listings_history table (triggers on properties + properties_extension) + one-shot
backfill from property_details.listing_events for pre-trigger history.
Tax reassessment forecast CA · Resets to sale price
- Current annual tax
- $16,180 · $1,348/mo
- Projected year-2 tax
- $16,180 · $1,348/mo
- Expected delta
- $0/yr ($0/mo · 0.0%)
ⓘ Screening estimate from a state-policy table — verify with the county assessor before closing.
Climate risk First Street
- Flood 1/10 Low FEMA zone X (unshaded) · 0% chance over 30 yrs
- Wildfire 1/10 Low
- Heat 6/10 Major 7 d/yr ≥90°F today · 21 d/yr by 30 yrs out
- Wind 1/10 Low
- Air quality 5/10 Major 8 unhealthy d/yr today · 8 by 30 yrs out
Nearby sold comps map
Loading sold comps map…
Walkable amenities ~0.75 mi
Loading nearby amenities…
Taxation est. · year 1
- Rental income
- $364,068
- − Mortgage interest
- −$104,749
- − Property taxes
- −$16,180
- − Insurance
- −$9,350
- − Repairs & maintenance
- −$29,125
- − Management
- −$29,125
- − Depreciation
- −$54,400
- Taxable income
- $121,138
- Est. tax owed @ 24.0%
- −$29,073
- After-tax cash flow
- $115,333/yr
For passive investors: Depreciation is non-cash, so a rental often shows a tax loss while cash-flowing — sheltering income. Rental losses are passive: they offset passive income freely, and up to $25,000/yr can offset ordinary (W-2) income if you actively participate and your MAGI is under $100k (phasing out to $0 by $150k); unused losses carry forward. On sale, claimed depreciation is recaptured at up to 25%, and gains may owe capital-gains tax (a 1031 exchange can defer both). Figures are a year-1 estimate at your 24.0% rate — not tax advice; consult a CPA.
Schools (NCES district)
- District
- Los Angeles Unified
- NCES district ID
- 0622710
- Math proficiency
- 29% ▼ -4.00%
- Reading proficiency
- 54% ▲ 10.00%
- Median HH income
- $50,403
- Composite
- 35.67/100
- National rank
- #4875
- State rank
- #223 of 517 in CA
Livability — Los Angeles
- Score
- 68/100
- State rank
- #273
- US rank
- #9237
Category grades
Schools grade is shown separately in the Schools card above.
Census & demographics
- Census place
- Los Angeles, CA
- County
- Los Angeles County · 9,444,647 people
- City population
- 3,838,149
- Metro
- Los Angeles-Long Beach-Anaheim, CA
- Population (ZIP)
- 27,127
- Household income
- $61,454
- Rent vs Own
- Severe rent burden
- 4038.0
Population outlook (Los Angeles County) Hauer SSP2
- Today (2025)
- 10,940,515 people
- By 2030
- 11,256,481 · +2.9%
- By 2040
- 11,729,929 · +7.2%
- By 2050
- 11,948,407 · +9.2%
- By 2075
- 11,818,114 · +8.0%
- By 2100
- 10,842,928 · -0.9%
Race, ethnicity, and origin ACS 2023
- Neighborhood character
- Diverse neighborhood (Simpson 0.66)
- Race & ethnicity
- Hispanic / Latino 49% White 31% Two or more races 15% Asian 7% Black 7% Native American 2%
- Hispanic origin (detail)
- Mexican 21%
- Common ancestry
- Romanian 2% Scotch-Irish 1% Lithuanian 1%
- Foreign-born
- 39% · Canada, South Korea, Jamaica
- Languages at home
- 44% English-only · Spanish 43% Other Indo-European 4% Tagalog/Filipino 2%
Political lean MEDSL · Los Angeles
- 2024 margin
- Solid D (+32.9) · D 64.8% · R 31.9% · Other 3.3%
- 2008→2024 swing
- -7.4pp toward R · 2008: 40.4pp · 2024: 32.9pp
- All cycles
- 2024: D+32.9 2020: D+44.2 2016: D+48.0 2012: D+40.0 2008: D+40.4
Not yet ingested
- Civics
- —
Market trends
- HPI YoY
- ▼ -461.01%
- Current HPI
- 349.1001
- Rent YoY
- ▲ 0.67%
- Metro
- Los Angeles-Long Beach-Anaheim, CA
- State GDP YoY
- ▲ 3.21%
- F500 in state
- 116
Industry mix (Fortune 500 HQ in CA)
| Industry | F500 HQs | Revenue |
|---|---|---|
| Technology | 27 | $1,492B |
|
||
| Financial Services | 3 | $174B |
|
||
| Retail | 3 | $44B |
|
||
| Insurance | 3 | $26B |
|
||
| Media / Entertainment | 2 | $115B |
|
||
| Pharmaceuticals / Biotech | 2 | $62B |
|
||
Price history
+619.2% since first listed27 events — show timeline
- 2025-11-10 Listed $1,870,000 CRMLS
- 2025-08-21 Listing Removed — CRMLS
- 2025-08-09 Price Changed $1,400,000 CRMLS
- 2025-05-02 Listing Removed — CRMLS
- 2025-05-01 Listed $2,170,000 CRMLS
- 2025-04-30 Listed $2,170,000 CRMLS
- 2023-05-31 Listing Removed — CRMLS
- 2023-03-29 Relisted — CRMLS
- 2023-03-29 Price Changed $1,490,000 CRMLS
- 2023-03-28 Listing Removed — CRMLS
- 2023-02-25 Listed $1,650,000 CRMLS
- 2023-02-23 Coming Soon — CRMLS
- 2021-12-16 Listing Removed — CRMLS
- 2021-11-10 Listed $2,250,000 CRMLS
- 2021-11-10 Coming Soon — CRMLS
- 2020-04-02 Relisted — CRMLS
- 2020-04-02 Listing Removed — CRMLS
- 2020-03-26 Listing Removed — CRMLS
- 2020-01-31 Listed $2,050,000 CRMLS
- 2018-12-07 Sold (Public Records) $1,300,000 Public Records
- 2018-12-07 Sold (MLS) $1,300,000 CRMLS
- 2018-11-21 Pending — CRMLS
- 2018-10-20 Listed $1,500,000 CRMLS
- 2003-10-23 Sold (Public Records) $250,000 Public Records
- 2003-10-22 Sold (Public Records) $250,000 Public Records
- 1996-04-01 Sold (Public Records) $135,000 Public Records
- 1990-01-22 Sold (Public Records) $260,000 Public Records
Property tax history
+2.5%/yrLatest (2025): $16,180 · -7.5% YoY. Source: county tax records.
Cash-flow waterfall
monthlySold comps — $/sqft
last 12 mo · ≤1 miLoading sold comps…