11828 Xavri Ln · Preston, TX
Flood risk No data
- FEMA flood zone
- —
- Chance of flooding over 30 yrs
- —
- Est. flood insurance / yr
- —
Fire risk No data
- Est. fire insurance / yr
- —
Heat risk No data
- Hot days now (above threshold)
- —
- Hot days in 30 yrs
- —
Wind risk No data
- Chance of severe wind over 30 yrs
- —
Air-quality risk No data
- Unhealthy air days now
- —
- Unhealthy air days in 30 yrs
- —
Risk factors via First Street. Map © Google.
Why this score? — see what drove the D- grade
The composite is a weighted blend of 9 inputs, each scored 0–100. Each bar is that input's sub-score; the figure is the points it added to the 100-point composite (weight × sub-score).
- Appreciation +10.0/10.0
- ARV discount +8.5/15.0
- Cash flow +7.7/30.0
- Livability +2.8/5.0
- Rent growth +2.5/5.0
- Schools +2.5/10.0
- Condition / age +2.5/5.0
- DSCR +1.8/10.0
- 1% rule +1.6/10.0
$349,000
🖨 Deal sheet 📄 Offer letter ✓ Due diligence
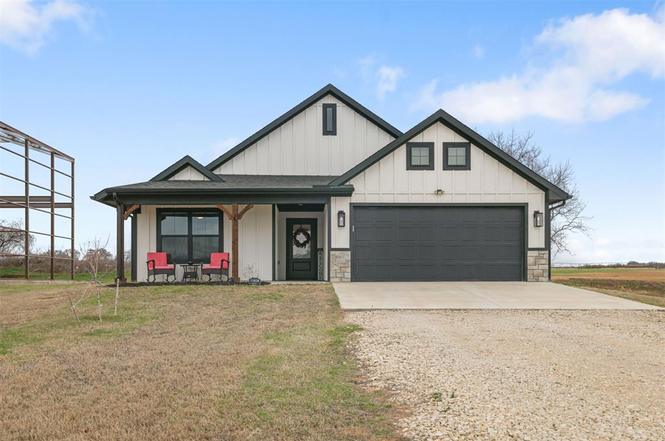
Listing remarks
This beautiful 2024 construction home is located in the Lakeside Trails subdivision near Lake Texoma and offers modern style with peaceful country living on a spacious 0.52-acre lot. The home features 3 bedrooms, 2 full bathrooms, and approximately 1,550 square feet of living space with an open-concept layout designed for comfortable living and entertaining. Interior highlights include 9-foot ceilings, durable vinyl flooring throughout, storm windows, quartz countertops, and a well-appointed kitchen with a built-in oven, electric cooktop, and ample space for dining. The living area features a fireplace insert and large windows that provide abundant natural light and scenic views of the surr
Key facts
- 0.52-acre lot
- Quartz countertops
- Open-concept layout
Tags
Property features AI
Finance
- Other: Property located in Lakeside Trls addition; Homestead not indicated
- Financial info: Loan qualifying allowed; Not assumable
- HOA & community: No mandatory association dues
Exterior
- Parking: 2-car garage
- Home design: Single-family residence; One-story; Residential property; Existing property
- Construction: Brick and frame construction; Composition roof; Slab foundation; Built (existing)
- Exterior features: Open patio; Interior lot
Interior
- Bedrooms: 3 bedrooms
- Bathrooms: 2 full bathrooms
- Interior features: Open patio access; Single living area; One fireplace
Neighborhood map
What this means for you Summary
Snapshot
- This is a 3-bed/2.0-bath single-family listed at $349k.
Deal economics
- At list price, monthly cash flow is $-406 ($-5k/yr) — negative.
- To cash-flow at today's rent, offer at most $277k (20.6% below list).
- To meet the 1% rule (rent ≥ 1% of price), the offer needs to be $230k (34.1% below list).
- Recommended offer: $230k (34.1% below list) — sets the bar for 1% rule.
- Cap rate 4.9% vs local median 2.9% in Preston — top-decile yield for the area; either an underpriced asset or a hidden risk that comps aren't pricing in. Stress-test before assuming the spread holds.
Location & tenants
- Location reads 56/100 on livability (#1,306 in TX) — a working-class tenant base; expect higher turnover. Strengths: crime A+, cost of living A+, housing A+; Watch: employment D, amenities F, commute F.
- Kingston (rural): math 27% / reading 32% proficiency, ranked #70 of 270 in OK (top 26%) — low school quality limits family demand, transient renter base, plan for 1-2y turnover; 76% free/reduced lunch — lower-income household profile, screen leases tightly.
- Zoned schools: Kingston Es (math 33% / reading 32%, grade F, #210 of 845 statewide, top 25%, 620 students, 0% FRL); Kingston Hs (math 22% / reading 27%, grade F, #150 of 447 statewide, top 48%, 362 students, 0% FRL) — zoned schools average 0% FRL vs 76% district-wide (76 pts lower); this property's tenant base skews higher-income than the district average.
- Market conditions: 42 units permitted in Marshall County in 2024 (0 in 5+ unit buildings).
Forward outlook
- In year one you build about $37k of equity ($2k loan paydown + $35k appreciation (10.0% local appreciation)).
- Marshall County population projected at +22% by 2050 — long-run rental-demand tailwind backs the buy-and-hold thesis.
- By year 2, paydown + projected appreciation supports a ~$60k cash-out refi (75% LTV) — recoverable capital for the next deal without selling this one.
Negotiation context
- It's been on market 106 days — a 9% lower offer ($318k) is reasonable based on typical stale-listing flexibility.
Questions for the listing agent
- What do current leases actually rent for vs. the listed asking? Can we see a recent rent roll and the last 12 months of T-12 income?
- It's been on market 106 days. Have you received any prior offers? Is the seller open to a 34% concession, seller financing, or rate buy-down credit?
- Why hasn't it sold? Are there any deal-killer items the seller is aware of (foundation, flood, title, zoning, code violations)?
- Is there a deadline driving the sale (1031 exchange, divorce, estate, relocation)? That informs how much negotiation room exists.
- Schools are F-rated, which usually means shorter tenancies and higher turnover. Who's the typical renter profile here, and what's been the actual vacancy rate?
- The area grade is low — what's the realistic commute time and amenity access for the typical tenant pool here? Any planned neighborhood developments (good or bad) we should know about?
- What's the average days-on-market for RENTAL listings here right now (not sales)? A rising rental-DOM trend means longer vacancies and softer asking-rent achievability than the comps imply.
- What's the recent tenant-quality profile in this submarket — average credit score on applications, eviction rate, late-payment / NSF rate, and stable-employment percentage? A property-management company in the area should have these aggregated.
- How much new for-sale + rental construction is in the pipeline within 1–3 miles? Heavy new supply typically softens prices + rents 12–24 months out; constrained supply supports both.
Investment metrics
- 1% rule
- 0.66% ✗
- Cap rate
- 4.90%
- Cash-on-cash
- -4.99%
- DSCR
- 0.78
- GRM
- 12.6
CMA / ARV
- ARV (on-the-fly)
- $356,965
- Comps found
- 7
Show comp detail 7 sales within ~0.75 mi
| Address | Dist | Beds/Ba | Sqft | Sold | Price | $/sf | Match |
|---|---|---|---|---|---|---|---|
| 11893 Xavri Ln | 0.08mi | 3/2.0 | 1,500 (-1%) | 7mo | $352,000 | $235 | 89 |
| 11828 Xavri | 0.00mi | 3/2.0 | 1,500 (-1%) | 19mo | $349,900 | $233 | 82 |
| 11852 Xavri St | 0.02mi | 3/2.0 | 1,450 (-4%) | 16mo | $388,000 | $268 | 78 |
| 11979 Xavri Ln | 0.16mi | 3/2.0 | 1,500 (-1%) | 20mo | $358,000 | $239 | 74 |
| 12181 Drew Ave | 0.51mi | 2/2.0 (-1) | 1,521 (+0%) | 4mo | $215,000 | $141 | 68 |
| 11978 Xander Ln | 0.18mi | 3/2.0 | 1,577 (+4%) | 24mo | $365,000 | $231 | 66 |
| 1908 Rhynes-childress Loop | 0.62mi | 3/2.0 | 1,624 (+7%) | 2mo | $385,000 | $237 | 58 |
Match score weights: distance 35% · size 25% · config 20% · recency 20%. Top-matched comps best support the ARV.
Projected returns pro-forma
10.0% appreciation · 3.0% rent growth · sell at horizon
- IRR
- 20.7%
- Equity multiple
- 2.68×
- Total profit
- $164,114
- Equity at exit
- $314,407
- IRR
- 18.8%
- Equity multiple
- 6.15×
- Total profit
- $503,477
- Equity at exit
- $678,030
Cash invested: $97,720 (down + closing). Projections, not guarantees.
Landlord ↔ Tenant lean methodology
- Overall (STATE)
- 87 Strongly Landlord-Friendly
- State Texas
- 87 Strongly Landlord-Friendly · R+5
- County
- — inherits STATE
- City
- — inherits STATE
ZIP-level market 73439
- Home prices YoY
- 12.3%
- Price-to-rent
- 12.6×
Monthly cashflow live
- Estimated rent
- $2,299 medium interval (Pro) →
- Mortgage (P&I)
- −$1,830
- Tax from tax record
- −$247 /mo · $2,964/yr
- Insurance
- −$145
- HOA
- −$0
- Vacancy / Maint / Mgmt
- −$483
- Net cashflow
- $-406
Break-even live
UW: 25.0% down · 7.5% · 30yr · 1.5% tax · 5.0% vac · 8.0% maint · 8.0% mgmt
Financing live
Cash to close
- Down payment
- $87,250
- Closing costs
- $10,470
- Reserves months
- —
- Total cash needed
- —
Loan-product check · same deal, 3 products live
Conventional
25% down · 7.5% · 30yr
- Down + closing
- —
- Monthly P&I
- —
- Monthly cashflow
- —
- DSCR
- —
- Eligible?
- —
Personal DTI + credit; lowest rate.
DSCR
20% down · 8.5% · 30yr
- Down + closing
- —
- Monthly P&I
- —
- Monthly cashflow
- —
- DSCR
- —
- Eligible?
- —
No personal income docs; deal must DSCR.
Hard money
10% down · 12.0% · 12mo
- Down + closing
- —
- Monthly P&I
- —
- Monthly cashflow
- —
- DSCR
- —
- Eligible?
- —
Short-term bridge; refi at stabilization.
Listing history 19 events
-
2026-06-19days on market $349,000 Active 106 DOM
-
2026-06-18days on market $349,000 Active 105 DOM
-
2026-06-17days on market $349,000 Active 104 DOM
-
2026-06-16days on market $349,000 Active 103 DOM
-
2026-06-15days on market $349,000 Active 102 DOM
-
2026-06-14days on market $349,000 Active 100 DOM
-
2026-06-13days on market $349,000 Active 99 DOM
-
2026-06-10days on market $349,000 Active 97 DOM
-
2026-06-09days on market $349,000 Active 96 DOM
-
2026-06-08days on market $349,000 Active 95 DOM
-
2026-06-07days on market $349,000 Active 94 DOM
-
2026-06-05days on market $349,000 Active 91 DOM
-
2026-06-02days on market $349,000 Active 89 DOM
-
2026-06-01days on market $349,000 Active 88 DOM
-
2026-05-31days on market $349,000 Active 87 DOM
-
2026-05-30days on market $349,000 Active 86 DOM
-
2026-05-21price $355,000
-
2026-04-01price $357,500
-
2026-03-05$359,900 Active
ⓘ Source: listings_history table (triggers on properties + properties_extension) + one-shot
backfill from property_details.listing_events for pre-trigger history.
Tax reassessment forecast TX · Resets to sale price
- Current annual tax
- $2,964 · $247/mo
- Projected year-2 tax
- $6,387 · $532/mo
- Expected delta
- +$3,423/yr (+$285/mo · 115.5%)
ⓘ Screening estimate from a state-policy table — verify with the county assessor before closing.
Nearby sold comps map
Loading sold comps map…
Walkable amenities ~0.75 mi
Loading nearby amenities…
Taxation est. · year 1
- Rental income
- $27,589
- − Mortgage interest
- −$19,549
- − Property taxes
- −$2,964
- − Insurance
- −$1,745
- − Repairs & maintenance
- −$2,207
- − Management
- −$2,207
- − Depreciation
- −$10,153
- Taxable loss
- −$11,236
- Est. tax savings @ 24.0%
- +$2,697
- After-tax cash flow
- $-2,179/yr
For passive investors: Depreciation is non-cash, so a rental often shows a tax loss while cash-flowing — sheltering income. Rental losses are passive: they offset passive income freely, and up to $25,000/yr can offset ordinary (W-2) income if you actively participate and your MAGI is under $100k (phasing out to $0 by $150k); unused losses carry forward. On sale, claimed depreciation is recaptured at up to 25%, and gains may owe capital-gains tax (a 1031 exchange can defer both). Figures are a year-1 estimate at your 24.0% rate — not tax advice; consult a CPA.
Schools (NCES district)
- District
- Kingston
- NCES district ID
- 4016590
- Math proficiency
- 27% ▼ -7.00%
- Reading proficiency
- 32% ▼ -7.00%
- Median HH income
- $40,655
- Composite
- 24.88/100
- National rank
- #7585
- State rank
- #70 of 270 in OK
Livability — Preston
- Score
- 56/100
- State rank
- #1306
- US rank
- #22637
Category grades
Schools grade is shown separately in the Schools card above.
Census & demographics
- Population (ZIP)
- 7,011
Population outlook (Marshall County) Hauer SSP2
- Today (2025)
- 17,405 people
- By 2030
- 18,038 · +3.6%
- By 2040
- 19,513 · +12.1%
- By 2050
- 21,283 · +22.3%
- By 2075
- 27,884 · +60.2%
- By 2100
- 35,435 · +103.6%
Race, ethnicity, and origin ACS 2023
- Neighborhood character
- Predominantly White (75%)
- Race & ethnicity
- White 75% Two or more races 16% Native American 5% Hispanic / Latino 4%
- Common ancestry
- Lithuanian 3% Italian 2% Serbian 1%
- Foreign-born
- 1% · Canada
- Languages at home
- 97% English-only · Spanish 3%
Political lean MEDSL · Marshall
- 2024 margin
- Solid R (+63.4) · D 17.7% · R 81.2% · Other 1.1%
- 2008→2024 swing
- -24.6pp toward R · 2008: -38.8pp · 2024: -63.4pp
- All cycles
- 2024: R+63.4 2020: R+62.5 2016: R+56.6 2012: R+45.7 2008: R+38.8
Not yet ingested
- Civics
- —
Market trends
- HPI YoY
- ▲ 26.96%
- Current HPI
- 246.2253
- Rent YoY
- —
- Metro
- —
- State GDP YoY
- ▲ 3.95%
- F500 in state
- 110
Industry mix (Fortune 500 HQ in TX)
| Industry | F500 HQs | Revenue |
|---|---|---|
| Energy | 16 | $1,198B |
|
||
| Technology | 5 | $198B |
|
||
| Engineering / Construction | 4 | $72B |
|
||
| Energy Services | 3 | $60B |
|
||
| Utilities | 3 | $41B |
|
||
| Healthcare | 2 | $330B |
|
||
Price history
-1.4% since first listed3 events — show timeline
- 2026-05-21 Price Changed $355,000 MLSOK
- 2026-04-01 Price Changed $357,500 MLSOK
- 2026-03-05 Listed $359,900 MLSOK
Property tax history
+240.6%/yrLatest (2025): $2,964 · +566.1% YoY. Source: county tax records.
Cash-flow waterfall
monthlySold comps — $/sqft
last 12 mo · ≤1 miLoading sold comps…