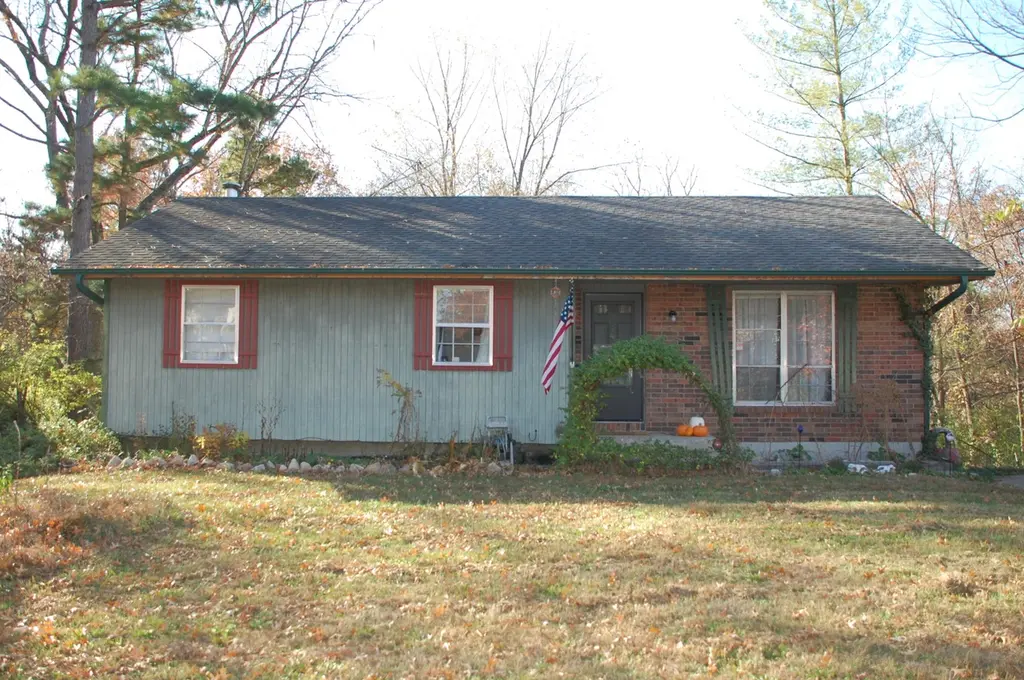
5335 N Rocky Fork Dr · Columbia, MO
Flood risk 1/10 · Minimal
- FEMA flood zone
- X (unshaded)
- Chance of flooding over 30 yrs
- 0.0%
- Est. flood insurance / yr
- $473 – $860
Fire risk 1/10 · Minimal
- Est. fire insurance / yr
- $1,054 – $1,958
Heat risk 4/10 · Minor
- Hot days now (above 108°F)
- 7 days/yr
- Hot days in 30 yrs
- 19 days/yr
Wind risk 2/10 · Minimal
- Chance of severe wind over 30 yrs
- —
Air-quality risk 1/10 · Minimal
- Unhealthy air days now
- 0 days/yr
- Unhealthy air days in 30 yrs
- 0 days/yr
Risk factors via First Street. Map © Google.
Why this score? — see what drove the B- grade
The composite is a weighted blend of 9 inputs, each scored 0–100. Each bar is that input's sub-score; the figure is the points it added to the 100-point composite (weight × sub-score).
- Cash flow +24.7/30.0
- ARV discount +15.0/15.0
- DSCR +8.0/10.0
- 1% rule +5.7/10.0
- Livability +4.2/5.0
- Rent growth +4.0/5.0
- Schools +3.1/10.0
- Condition / age +2.5/5.0
- Appreciation +0.0/10.0
$165,000
🖨 Deal sheet 📄 Offer letter ✓ Due diligence
Listing remarks MLS
Great investment opportunity. Solid home with newer roof and hvac. Long term tenants. Great room for a few improvements and increased rents.
Key facts
- Newer roof
- Newer hvac
- 0.36 acre lot
Tags
Neighborhood map
What this means for you Summary
Snapshot
- This is a 4-bed/2.0-bath single-family listed at $165k.
Deal economics
- At list price, monthly cash flow is $345 ($4k/yr) — positive.
- The deal already cash-flows at list — no discount required.
- Meets the 1% rule at list price ($2k rent vs $165k).
- Recommended offer: $145k (12.0% below list) — sets the bar for market timing.
- Cap rate 8.8% vs local median 2.9% in Columbia — top-decile yield for the area; either an underpriced asset or a hidden risk that comps aren't pricing in. Stress-test before assuming the spread holds.
Location & tenants
- Location reads 83/100 on livability (#9 in MO, #862 nationally) — a professional / high-income tenant draw. Strengths: amenities A+, commute A+, cost of living A+; Watch: crime D+.
- Columbia 93 (urban): math 30% / reading 43% proficiency, ranked #194 of 324 in MO (top 60%) — families likely to look elsewhere, expect single-tenant / working-renter base with shorter leases.
- Market conditions: Rents rising fast (+6.0%/yr); 351 active listings in the ZIP; 40 comparable units currently listed for rent nearby; rentals lingering (median 44d on market — plan ~5-8 weeks vacancy on turnover, expect pricing pressure); 70% of comp listings sitting > 30 days — soft ceiling on asking rent; 1,303 units permitted in Boone County in 2024 (549 in 5+ unit buildings).
Forward outlook
- Local home prices are declining (-3.0%/yr); year-one equity from $1k of loan paydown is wiped out by about $5k of value loss. Plan a longer hold.
- Boone County population projected at +36% by 2050 — long-run rental-demand tailwind backs the buy-and-hold thesis.
- At projected returns (-3.0% appreciation + 6.0% rent growth), your $46k cash investment doubles in ~9 years — after that, you're playing with house money.
Negotiation context
- It's been on market 204 days — a 12% lower offer ($145k) is reasonable based on typical stale-listing flexibility.
- 3 sale attempts since 29y ago; this cycle's ask has dropped $15k (8%) from the opening price — seller is motivated, your offer sets the floor, not the list.
Questions for the listing agent
- It's been on market 204 days. Have you received any prior offers? Is the seller open to a 12% concession, seller financing, or rate buy-down credit?
- Built in 1975 — when were the roof, HVAC, electrical panel, plumbing, and water heater last replaced?
- Why hasn't it sold? Are there any deal-killer items the seller is aware of (foundation, flood, title, zoning, code violations)?
- Is there a deadline driving the sale (1031 exchange, divorce, estate, relocation)? That informs how much negotiation room exists.
- Schools are B-rated — typically a magnet for longer-tenancy family renters. What's the average tenant stay here, and is there a school-zone premium baked into asking?
- Crime grade is D in this area — have there been break-ins, vandalism, or insurance claims at this property in the last 3 years? What carrier currently insures it and at what premium?
- What's the average days-on-market for RENTAL listings here right now (not sales)? A rising rental-DOM trend means longer vacancies and softer asking-rent achievability than the comps imply.
- What's the recent tenant-quality profile in this submarket — average credit score on applications, eviction rate, late-payment / NSF rate, and stable-employment percentage? A property-management company in the area should have these aggregated.
- How much new for-sale + rental construction is in the pipeline within 1–3 miles? Heavy new supply typically softens prices + rents 12–24 months out; constrained supply supports both.
Investment metrics
- 1% rule
- 1.07% ✓
- Cap rate
- 8.80%
- Cash-on-cash
- 8.96%
- DSCR
- 1.40
- GRM
- 7.8
CMA / ARV
- ARV (median comp)
- $213,897
- List price
- $165,000
- Delta
- -20.52%
- Verdict
- UNDERPRICED
- Comps
- 2 within 1.0 mi
Show comp detail 12 sales within ~0.75 mi
| Address | Dist | Beds/Ba | Sqft | Sold | Price | $/sf | Match |
|---|---|---|---|---|---|---|---|
| 5 Copper Mountain Dr | 0.20mi | 3/2.0 (-1) | 1,377 (-1%) | 6mo | $225,000 | $163 | 79 |
| 215 E Tully Ct | 0.13mi | 3/2.0 (-1) | 1,335 (-4%) | 9mo | $230,000 | $172 | 75 |
| 154 E Tully Ct | 0.15mi | 3/2.0 (-1) | 1,292 (-7%) | 2mo | $235,000 | $182 | 74 |
| 5304 Aspen Ridge Dr | 0.36mi | 3/2.0 (-1) | 1,414 (+2%) | 2mo | $285,000 | $202 | 74 |
| 460 E Cedar Ct | 0.41mi | 3/2.5 (-1) | 1,391 (-0%) | 1mo | $235,000 | $169 | 73 |
| 235 E Murphy Dr | 0.19mi | 3/2.0 (-1) | 1,320 (-5%) | 6mo | $235,000 | $178 | 72 |
| 576 E Clearview Dr | 0.37mi | 3/2.0 (-1) | 1,326 (-5%) | 5mo | $236,000 | $178 | 66 |
| 547 E Clearview Dr | 0.30mi | 3/2.0 (-1) | 1,336 (-4%) | 10mo | $225,000 | $168 | 66 |
| 5212 Silver Mill Dr | 0.45mi | 3/2.0 (-1) | 1,360 (-2%) | 8mo | $249,900 | $184 | 64 |
| 5290 N Burning Bush Rd | 0.52mi | 3/2.0 (-1) | 1,445 (+4%) | 1mo | $285,000 | $197 | 63 |
| 184 E Tully Ct | 0.15mi | 3/2.0 (-1) | 1,192 (-14%) | 2mo | $230,000 | $193 | 63 |
| 240 E Tully Ct | 0.16mi | 3/2.0 (-1) | 1,192 (-14%) | 7mo | $229,900 | $193 | 58 |
Match score weights: distance 35% · size 25% · config 20% · recency 20%. Top-matched comps best support the ARV.
Projected returns pro-forma
-3.0% appreciation · 5.96% rent growth · sell at horizon
- IRR
- 0.3%
- Equity multiple
- 1.01×
- Total profit
- $623
- Equity at exit
- $24,602
- IRR
- 12.7%
- Equity multiple
- 2.13×
- Total profit
- $52,344
- Equity at exit
- $14,266
Cash invested: $46,200 (down + closing). Projections, not guarantees.
Landlord ↔ Tenant lean methodology
- Overall (STATE)
- 81 Strongly Landlord-Friendly
- State Missouri
- 81 Strongly Landlord-Friendly · R+10
- County
- — inherits STATE
- City
- — inherits STATE
ZIP-level market 65202
- Rents YoY
- 6.0%
- Active inventory
- 351
- Price-to-rent
- 7.8×
Monthly cashflow live
- Estimated rent
- $1,767 high interval (Pro) →
- Mortgage (P&I)
- −$865
- Tax from tax record
- −$117 /mo · $1,403/yr
- Insurance
- −$69
- HOA
- −$0
- Vacancy / Maint / Mgmt
- −$371
- Net cashflow
- $345
Break-even live
UW: 25.0% down · 7.5% · 30yr · 1.5% tax · 5.0% vac · 8.0% maint · 8.0% mgmt
Financing live
Cash to close
- Down payment
- $41,250
- Closing costs
- $4,950
- Reserves months
- —
- Total cash needed
- —
Loan-product check · same deal, 3 products live
Conventional
25% down · 7.5% · 30yr
- Down + closing
- —
- Monthly P&I
- —
- Monthly cashflow
- —
- DSCR
- —
- Eligible?
- —
Personal DTI + credit; lowest rate.
DSCR
20% down · 8.5% · 30yr
- Down + closing
- —
- Monthly P&I
- —
- Monthly cashflow
- —
- DSCR
- —
- Eligible?
- —
No personal income docs; deal must DSCR.
Hard money
10% down · 12.0% · 12mo
- Down + closing
- —
- Monthly P&I
- —
- Monthly cashflow
- —
- DSCR
- —
- Eligible?
- —
Short-term bridge; refi at stabilization.
Rent comps 40 comps
| Address | Beds | Baths | Sqft | Rent | $/sqft | DOM | Units | Dist |
|---|---|---|---|---|---|---|---|---|
| 6 Copper Mountain Dr Columbia, MO | 3.0 | 2.0 | 1430 | $1,750 | $1.22 | 13d | 1 | 0.22mi |
| 5205 Silver Mill Dr Columbia, MO | 4.0 | 3.0 | 1800 | $1,950 | $1.08 | 21d | 1 | 0.44mi |
| 5113 Silver Mill Dr Columbia, MO | 4.0 | 3.0 | 1800 | $1,950 | $1.08 | 43d | 1 | 0.46mi |
| 4919 Silver Mill Dr Columbia, MO | 4.0 | 3.0 | 1800 | $1,950 | $1.08 | 43d | 1 | 0.53mi |
| 655 Country Squire Ct Unit 655 Columbia, MO | 3.0 | 2.0 | 1283 | $1,350 | $1.05 | 21d | 1 | 1.03mi |
| 5309-5311 Currituck Ln Columbia, MO | 4.0 | 3.0 | 1402 | $1,495 | $1.07 | 43d | 1 | 1.12mi |
| 1405 Greensboro Dr Columbia, MO | 4.0 | 3.0 | 1420 | $1,495 | $1.05 | 21d | 1 | 1.12mi |
| 5307 Currituck Ln Columbia, MO | 4.0 | 3.0 | 1402 | $1,495 | $1.07 | 43d | 1 | 1.12mi |
| 5305 Currituck Ln Unit 5305 Columbia, MO | 4.0 | 3.0 | 1402 | $1,495 | $1.07 | 13d | 1 | 1.12mi |
| 5305 Currituck Ln Columbia, MO | 4.0 | 3.0 | 1402 | $1,495 | $1.07 | 43d | 1 | 1.13mi |
| 5301 Currituck Ln Columbia, MO | 4.0 | 3.0 | 1374 | $1,495 | $1.09 | 43d | 1 | 1.13mi |
| 1403 Bodie Dr Columbia, MO | 4.0 | 3.0 | 1402 | $1,495 | $1.07 | 43d | 1 | 1.14mi |
| 1401-1403 Bodie Dr Columbia, MO | 4.0 | 3.0 | 1402 | $1,495 | $1.07 | 21d | 1 | 1.14mi |
| 5211 Currituck Ln Columbia, MO | 4.0 | 3.0 | 1402 | $1,495 | $1.07 | 43d | 1 | 1.14mi |
| 1413 Greensboro Dr Columbia, MO | 4.0 | 3.0 | 1420 | $1,495 | $1.05 | 13d | 1 | 1.15mi |
| 1417 Bodie Dr Columbia, MO | 4.0 | 3.0 | 1402 | $1,495 | $1.07 | 44d | 1 | 1.18mi |
| 1419 Bodie Dr Columbia, MO | 4.0 | 3.0 | 1402 | $1,495 | $1.07 | 43d | 1 | 1.18mi |
| 1427 Greensboro Dr Columbia, MO | 4.0 | 3.0 | 1420 | $1,495 | $1.05 | 13d | 1 | 1.20mi |
| 1302 E Brown School Rd Columbia, MO | 4.0 | 2.0 | 1603 | $1,625 | $1.01 | 43d | 1 | 1.21mi |
| 1424 Bodie Dr Columbia, MO | 3.0 | 2.0 | 1393 | $1,750 | $1.26 | 43d | 1 | 1.21mi |
| 214 Arctic Wolf Ct Columbia, MO | 4.0 | 3.0 | 1500 | $1,650 | $1.10 | 43d | 1 | 1.22mi |
| 1432 Bodie Dr Columbia, MO | 3.0 | 2.0 | 1393 | $1,750 | $1.26 | 43d | 1 | 1.23mi |
| 1507 Bodie Dr Columbia, MO | 4.0 | 3.0 | 1402 | $1,495 | $1.07 | 43d | 1 | 1.23mi |
| 1500 Bodie Dr Columbia, MO | 3.0 | 2.0 | 1393 | $1,750 | $1.26 | 21d | 1 | 1.23mi |
| 1505 Greensboro Dr Columbia, MO | 4.0 | 3.0 | 1402 | $1,600 | $1.14 | 13d | 1 | 1.24mi |
| 4014 Arctic Fox Dr Columbia, MO | 4.0 | 3.0 | 1663 | $1,695 | $1.02 | 43d | 1 | 1.24mi |
| 1311 Raleigh Dr Columbia, MO | 4.0 | 2.0 | 1603 | $1,625 | $1.01 | 13d | 1 | 1.24mi |
| 4016 Snowy Owl Dr Columbia, MO | 4.0 | 3.0 | 1464 | $1,650 | $1.13 | 43d | 1 | 1.26mi |
| 4013 Snowy Owl Dr Columbia, MO | 4.0 | 3.0 | 1500 | $1,695 | $1.13 | 43d | 1 | 1.26mi |
| 4014 Snowy Owl Dr Columbia, MO | 4.0 | 3.0 | 1464 | $1,650 | $1.13 | 43d | 1 | 1.27mi |
| 1524 Bodie Dr Columbia, MO | 3.0 | 2.0 | 1393 | $1,750 | $1.26 | 43d | 1 | 1.29mi |
| 4006 Snowy Owl Dr Columbia, MO | 4.0 | 3.0 | 1464 | $1,650 | $1.13 | 43d | 1 | 1.30mi |
| 4001 Snowy Owl Dr Columbia, MO | 4.0 | 3.0 | 1500 | $1,695 | $1.13 | 43d | 1 | 1.31mi |
| 3927 Snowy Owl Dr Columbia, MO | 4.0 | 3.0 | 1500 | $1,695 | $1.13 | 43d | 1 | 1.32mi |
| 3922 Snowy Owl Dr Columbia, MO | 4.0 | 3.0 | 1464 | $1,650 | $1.13 | 43d | 1 | 1.35mi |
| 1516 Citadel Dr Columbia, MO | 4.0 | 3.0 | 1402 | $1,495 | $1.07 | 43d | 1 | 1.36mi |
| 3910 Snowy Owl Dr Columbia, MO | 4.0 | 3.0 | 1464 | $1,650 | $1.13 | 43d | 1 | 1.38mi |
| 708 Promenade Dr Columbia, MO | 3.0 | 2.0 | 1440 | $2,000 | $1.39 | 43d | 1 | 1.41mi |
| 1601-1603 Bold Ruler Dr Columbia, MO | 3.0 | 2.0 | 1128 | $1,425 | $1.26 | 13d | 1 | 1.43mi |
| 1605 Bold Ruler Ct Columbia, MO | 3.0 | 2.0 | 1140 | $1,425 | $1.25 | 43d | 1 | 1.43mi |
Listing history 15 events
-
2026-06-10status $165,000 Pending 204 DOM
-
2026-06-09days on market $165,000 Active 204 DOM
-
2026-06-08days on market $165,000 Active 203 DOM
-
2026-06-07days on market $165,000 Active 202 DOM
-
2026-06-05days on market $165,000 Active 199 DOM
-
2026-06-03days on market $165,000 Active 198 DOM
-
2026-06-02days on market $165,000 Active 197 DOM
-
2026-05-31days on market $165,000 Active 195 DOM
-
2026-05-30days on market $165,000 Active 194 DOM
-
2026-03-11price $170,000 140-char remark
Show marketing remark (151 chars)
Great starter home or investment property offering 4 bedrooms, 2 bathrooms and a great basement finish. Currently tenant occupied through mid July 2026
-
2026-03-11price $170,000 151-char remark
Show marketing remark (151 chars)
Great starter home or investment property offering 4 bedrooms, 2 bathrooms and a great basement finish. Currently tenant occupied through mid July 2026
-
2025-11-17$180,000 Active 151-char remark
Show marketing remark (140 chars)
Great investment opportunity. Solid home with newer roof and hvac. Long term tenants. Great room for a few improvements and increased rents.
-
2025-11-17$180,000 Active 140-char remark
Show marketing remark (140 chars)
Great investment opportunity. Solid home with newer roof and hvac. Long term tenants. Great room for a few improvements and increased rents.
-
1997-06-26soldstatus
-
1997-04-08$71,000
ⓘ Source: listings_history table (triggers on properties + properties_extension) + one-shot
backfill from property_details.listing_events for pre-trigger history.
Tax reassessment forecast MO · Resets to sale price
- Current annual tax
- $1,403 · $117/mo
- Projected year-2 tax
- $1,600 · $133/mo
- Expected delta
- +$198/yr (+$16/mo · 14.1%)
ⓘ Screening estimate from a state-policy table — verify with the county assessor before closing.
Climate risk First Street
- Flood 1/10 Low FEMA zone X (unshaded) · 0% chance over 30 yrs
- Wildfire 1/10 Low
- Heat 4/10 Moderate 7 d/yr ≥108°F today · 19 d/yr by 30 yrs out
- Wind 2/10 Low
- Air quality 1/10 Low 0 unhealthy d/yr today · 0 by 30 yrs out
Nearby sold comps map
Loading sold comps map…
Walkable amenities ~0.75 mi
Loading nearby amenities…
Taxation est. · year 1
- Rental income
- $21,203
- − Mortgage interest
- −$9,243
- − Property taxes
- −$1,403
- − Insurance
- −$825
- − Repairs & maintenance
- −$1,696
- − Management
- −$1,696
- − Depreciation
- −$4,800
- Taxable income
- $1,540
- Est. tax owed @ 24.0%
- −$370
- After-tax cash flow
- $3,770/yr
For passive investors: Depreciation is non-cash, so a rental often shows a tax loss while cash-flowing — sheltering income. Rental losses are passive: they offset passive income freely, and up to $25,000/yr can offset ordinary (W-2) income if you actively participate and your MAGI is under $100k (phasing out to $0 by $150k); unused losses carry forward. On sale, claimed depreciation is recaptured at up to 25%, and gains may owe capital-gains tax (a 1031 exchange can defer both). Figures are a year-1 estimate at your 24.0% rate — not tax advice; consult a CPA.
Schools (NCES district)
- District
- Columbia 93
- NCES district ID
- 2901000
- Math proficiency
- 30% ▼ -12.00%
- Reading proficiency
- 43% ▼ -4.00%
- Median HH income
- $46,547
- Composite
- 31.21/100
- National rank
- #6036
- State rank
- #194 of 324 in MO
Livability — Columbia
- Score
- 83/100
- State rank
- #9
- US rank
- #862
Category grades
Schools grade is shown separately in the Schools card above.
Census & demographics
- County
- Boone County · 158,877 people
- City population
- 158,877
- Metro
- Columbia, MO
- Population (ZIP)
- 47,327
- Household income
- $72,289
- Rent vs Own
- Severe rent burden
- 1326.0
Population outlook (Boone County) Hauer SSP2
- Today (2025)
- 202,891 people
- By 2030
- 217,799 · +7.3%
- By 2040
- 246,789 · +21.6%
- By 2050
- 276,116 · +36.1%
- By 2075
- 348,426 · +71.7%
- By 2100
- 400,856 · +97.6%
Race, ethnicity, and origin ACS 2023
- Neighborhood character
- Predominantly White (68%)
- Race & ethnicity
- White 68% Black 16% Two or more races 8% Hispanic / Latino 6% Asian 3%
- Hispanic origin (detail)
- Mexican 4%
- Common ancestry
- Lithuanian 2% Italian 2% Slovak 2%
- Foreign-born
- 6% · Canada, South Korea
- Languages at home
- 91% English-only · Spanish 3% Other Asian/Pacific 1% French/Haitian/Cajun 1%
Political lean MEDSL · Boone
- 2024 margin
- Lean D (+9.8) · D 53.9% · R 44.1% · Other 2.1%
- 2008→2024 swing
- -2.2pp toward R · 2008: 12.0pp · 2024: 9.8pp
- All cycles
- 2024: D+9.8 2020: D+12.5 2016: D+5.9 2012: D+3.1 2008: D+12.0
Not yet ingested
- Civics
- —
Market trends
- HPI YoY
- ▼ -171.32%
- Current HPI
- 205.5154
- Rent YoY
- ▲ 5.96%
- Metro
- Columbia, MO
- State GDP YoY
- ▲ 1.84%
- F500 in state
- 20
Industry mix (Fortune 500 HQ in MO)
| Industry | F500 HQs | Revenue |
|---|---|---|
| Healthcare | 1 | $163B |
|
||
| Insurance | 1 | $21B |
|
||
| Industrial Technology | 1 | $17B |
|
||
| Retail | 1 | $16B |
|
||
| Industrial Distribution | 1 | $10B |
|
||
| Utilities | 1 | $9B |
|
||
Price history
+139.4% since first listed6 events — show timeline
- 2026-03-11 Price Changed $170,000 CBORMLS
- 2026-03-11 Price Changed $170,000 CBORMLS
- 2025-11-17 Listed $180,000 CBORMLS
- 2025-11-17 Listed $180,000 CBORMLS
- 1997-06-26 Sold (MLS) — CBORMLS
- 1997-04-08 Listed $71,000 CBORMLS
Property tax history
+3.4%/yrLatest (2025): $1,403 · +6.9% YoY. Source: county tax records.
Cash-flow waterfall
monthlySold comps — $/sqft
last 12 mo · ≤1 miLoading sold comps…