 Triplex
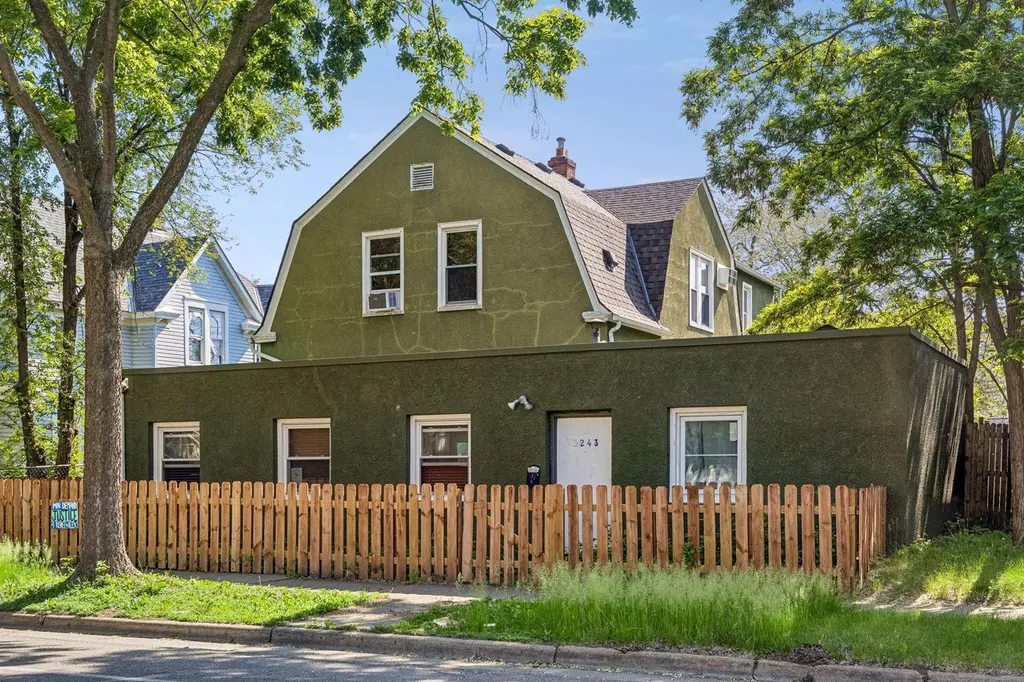
3241 Cedar Ave S · Minneapolis, MN
Flood risk 1/10 · Minimal
- FEMA flood zone
- X (unshaded)
- Chance of flooding over 30 yrs
- 0.0%
- Est. flood insurance / yr
- $473 – $860
Fire risk 1/10 · Minimal
- Est. fire insurance / yr
- $888 – $1,650
Heat risk 2/10 · Minimal
- Hot days now (above 99°F)
- 7 days/yr
- Hot days in 30 yrs
- 14 days/yr
Wind risk 2/10 · Minimal
- Chance of severe wind over 30 yrs
- —
Air-quality risk 2/10 · Minimal
- Unhealthy air days now
- 1 days/yr
- Unhealthy air days in 30 yrs
- 2 days/yr
Risk factors via First Street. Map © Google.
Why this score? — see what drove the B grade
The composite is a weighted blend of 9 inputs, each scored 0–100. Each bar is that input's sub-score; the figure is the points it added to the 100-point composite (weight × sub-score).
- Cash flow +30.0/30.0
- 1% rule +10.0/10.0
- DSCR +10.0/10.0
- ARV discount +7.5/15.0
- Livability +3.9/5.0
- Rent growth +3.6/5.0
- Schools +3.5/10.0
- Condition / age +2.5/5.0
- Appreciation +0.0/10.0
$399,900
🖨 Deal sheet (PDF) 📄 Offer letter ✓ Due diligence
Multi-family units
County records classify this as Multi-Family (2-4 Unit). Listing-text estimate: 3 units. confirmed
Listing remarks
Unique Triplex with 3 units fully occupied and eligible for FHA loan assumption for an owner-occupant! Enjoy the peaceful backyard that is fully enclosed with a wooden fence and features a patio. Perfect for dog owners. This building has plenty of space including a partially finished full basement, a 12x12 flex room in the backyard and a workshop attached to garage. Units have been nicely maintained and are rent ready! This is the perfect spot for an owner who would like to cut their living expenses by occupying 1 unit. $3725.00 gross monthly rents. Front unit adjacent to the street is licensed as an accessory dwelling unit.
Key facts
- 12x12 flex room
- Fully enclosed
- Peaceful backyard
Tags
Property features AI
Finance
- Other: Property type: Triplex (residential income); Above-grade finished area 3,000 sq ft; total living area reported as 3,000; Building total area 3,690; below-grade area 690; Lot dimensions approximately 50x125 (6,098 sq ft)
- Financial info: Owner pays fuel, repairs, sewer, taxes, trash collection, and water; Tenant pays electricity; Mortgage type reported as FHA
- HOA & community: Association amenities: Deck
Exterior
- Parking: Concrete parking; One garage space (20x20, 7' door height, 16' door width); Each unit listed with 1 parking space
- Utilities: City water connected; City sewer connected; Electric with circuit breakers; Natural gas fuel
- Home design: Residential income property (triplex); Two levels; Not owner-occupied
- Construction: Concrete construction materials; Block foundation; Foundation dimensions 30x23; Foundation area 690; Asphalt flat roof (over 8 years old)
- Exterior features: Stucco exterior; Deck/patio; Full wood fencing; Light tree coverage on lot; City street frontage; public maintained road
Interior
- Kitchen: Each unit includes dishwasher, range, and refrigerator
- Bedrooms: 5 bedrooms total; Unit breakdown: one 1-bedroom unit, two 2-bedroom units
- Flooring: Hardwood floors in one unit
- Bathrooms: Each unit has 1 full bathroom
- Heating & cooling: Baseboard heating; Boiler heating; No central cooling (units reported as having no cooling system)
- Interior features: Block basement; Community room and other shared rooms
- Laundry & utility: Laundry located in basement
Neighborhood map
What this means for you Summary
Snapshot
- This is a 3 × 5-bed/3.0-bath units multifamily listed at $400k.
Deal economics
- At list price, monthly cash flow is $2k ($28k/yr) — positive. Per door: $774/mo.
- The deal already cash-flows at list — no discount required.
- Meets the 1% rule at list price ($7k rent vs $400k).
- Recommended offer: $394k (1.5% below list) — sets the bar for market timing.
- Cap rate 13.3% vs local median 3.1% in Minneapolis — top-decile yield for the area; either an underpriced asset or a hidden risk that comps aren't pricing in. Stress-test before assuming the spread holds.
Location & tenants
- Location reads 78/100 on livability (#110 in MN, #2,525 nationally) — a middle-class / working-renter tenant base. Strengths: amenities A+, commute A+, housing A+; Watch: cost of living C-, crime F.
- Minneapolis Public School District (urban): math 35% / reading 46% proficiency, ranked #217 of 301 in MN (top 72%) — families likely to look elsewhere, expect single-tenant / working-renter base with shorter leases.
- Zoned schools: Cityview Elementary (math 2% / reading 2%, grade F, #856 of 857 statewide, top 100%, 200 students, 88% FRL); South High (reading 75%, 1,466 students, 66% FRL) — zoned schools average 77% FRL vs 58% district-wide (19 pts higher); higher-poverty schools than district average — tighter screening recommended.
- Zoned-school proficiency averages 2% at this address vs 40% district-wide (-38 pts) — the specific schools serving this property underperform the Minneapolis Public School District average; the district grade overstates school quality for this exact location.
- Market conditions: Rents rising fast (+4.3%/yr); 146 active listings in the ZIP; 1 comparable units currently listed for rent nearby; solid renter incomes; 4,651 units permitted in Hennepin County in 2024 (2,443 in 5+ unit buildings).
- At $6,531/mo this rent would consume 100% of the median local household income ($78k/yr) (locally 1583% of renters already pay >50% of income on rent) — very limited rent-growth headroom before tenants either downsize or default.
Forward outlook
- Local home prices are declining (-3.0%/yr); year-one equity from $3k of loan paydown is wiped out by about $12k of value loss. Plan a longer hold.
- Hennepin County population projected at +30% by 2050 — long-run rental-demand tailwind backs the buy-and-hold thesis.
- At projected returns (-3.0% appreciation + 4.3% rent growth), your $112k cash investment doubles in ~5 years — after that, you're playing with house money.
Negotiation context
- It's been on market 18 days — a 2% lower offer ($394k) is reasonable based on typical stale-listing flexibility.
- 10 sale attempts since 23y ago with the ask held roughly flat each time — persistent listings suggest the price (not the market) is what's stuck; bring a comps-based counter.
Risks & watch-outs
- Watch-outs: built in 1898 — expect roof / HVAC / electrical / plumbing capex.
Questions for the listing agent
- Can we see the unit-by-unit rent roll, current vacancy, and any below-market leases? What's the average tenancy length?
- What capital expenditures (roof, boiler, parking lot, exteriors) have been made in the last 5 years, and what's planned in the next 2?
- Built in 1898 — when were the roof, HVAC, electrical panel, plumbing, and water heater last replaced?
- Is there a deadline driving the sale (1031 exchange, divorce, estate, relocation)? That informs how much negotiation room exists.
- Crime grade is F in this area — have there been break-ins, vandalism, or insurance claims at this property in the last 3 years? What carrier currently insures it and at what premium?
- What's the average days-on-market for RENTAL listings here right now (not sales)? A rising rental-DOM trend means longer vacancies and softer asking-rent achievability than the comps imply.
- What's the recent tenant-quality profile in this submarket — average credit score on applications, eviction rate, late-payment / NSF rate, and stable-employment percentage? A property-management company in the area should have these aggregated.
- How much new apartment / multifamily construction is in the pipeline within 1–3 miles? Heavy new supply (>2% of stock underway) typically softens rents 12–24 months out; light construction supports rent growth.
Investment metrics
- 1% rule
- 1.63% ✓
- Cap rate
- 13.26%
- Cash-on-cash
- 24.88%
- DSCR
- 2.11
- GRM
- 5.1
CMA / ARV
No comps found within radius.
Projected returns pro-forma
-3.0% appreciation · 4.3% rent growth · sell at horizon
- IRR
- 19.8%
- Equity multiple
- 1.82×
- Total profit
- $91,858
- Equity at exit
- $59,626
- IRR
- 29.0%
- Equity multiple
- 3.75×
- Total profit
- $307,431
- Equity at exit
- $34,576
Cash invested: $111,972 (down + closing). Projections, not guarantees.
Landlord ↔ Tenant lean methodology
- Overall (CITY)
- 34 Tenant-Leaning
- State Minnesota
- 46 Balanced · D+2
- County
- — inherits STATE
- City Minneapolis
- 34 Tenant-Leaning · D+50
ZIP-level market 55407
- Rents YoY
- 4.3%
- Active inventory
- 146
- Price-to-rent
- 15.3×
Monthly cashflow live
- Estimated rent
- $6,531 medium interval (Pro) →
- Mortgage (P&I)
- −$2,097
- Tax from tax record
- −$574 /mo · $6,890/yr
- Insurance
- −$167
- HOA
- −$0
- Vacancy / Maint / Mgmt
- −$1,372
- Net cashflow
- $2,322
Break-even live
Sensitivity live
| Price | -10% $2,548 | -5% $2,435 | +0% $2,322 | +5% $2,208 | +10% $2,095 |
|---|---|---|---|---|---|
| Rent | -10% $1,806 | -5% $2,064 | +0% $2,322 | +5% $2,580 | +10% $2,838 |
| Rate | -1.0pp $2,523 | -0.5pp $2,423 | base $2,322 | +0.5pp $2,218 | +1.0pp $2,113 |
3-unit breakdown (identical units grouped — click to expand)
| Units | Beds | Baths | Est. rent |
|---|---|---|---|
| 3× units | 5 | 3 | $6,531 |
| #1 | 5 | 3 | $2,177 |
| #2 | 5 | 3 | $2,177 |
| #3 | 5 | 3 | $2,177 |
| Total (3 units) | $6,531 | ||
UW: 25.0% down · 7.5% · 30yr · 1.5% tax · 5.0% vac · 8.0% maint · 8.0% mgmt
Financing live
Cash to close
- Down payment
- $99,975
- Closing costs
- $11,997
- Reserves months
- —
- Total cash needed
- —
Loan-product check · same deal, 3 products live
Conventional
25% down · 7.5% · 30yr
- Down + closing
- —
- Monthly P&I
- —
- Monthly cashflow
- —
- DSCR
- —
- Eligible?
- —
Personal DTI + credit; lowest rate.
DSCR
20% down · 8.5% · 30yr
- Down + closing
- —
- Monthly P&I
- —
- Monthly cashflow
- —
- DSCR
- —
- Eligible?
- —
No personal income docs; deal must DSCR.
Hard money
10% down · 12.0% · 12mo
- Down + closing
- —
- Monthly P&I
- —
- Monthly cashflow
- —
- DSCR
- —
- Eligible?
- —
Short-term bridge; refi at stabilization.
Rent comps 1 comps
| Address | Beds | Baths | Sqft | Rent | $/sqft | DOM | Units | Dist |
|---|---|---|---|---|---|---|---|---|
| 220 E 27th St #1 Minneapolis, MN | 4.0 | 1.0 | 2516 | $3,100 | $1.23 | 20d | 1 | 1.48mi |
Listing history 11 events
-
2026-06-21days on market $399,900 Active 18 DOM
-
2026-06-18days on market $399,900 Active 15 DOM
-
2026-06-17days on market $399,900 Active 14 DOM
-
2026-06-16days on market $399,900 Active 13 DOM
-
2026-06-15days on market $399,900 Active 12 DOM
-
2026-06-13days on market $399,900 Active 10 DOM
-
2026-06-09days on market $399,900 Active 6 DOM
-
2026-06-08days on market $399,900 Active 5 DOM
-
2026-06-07days on market $399,900 Active 4 DOM
-
2026-06-04remarks 632-char remark
-
2026-06-04$399,900 Active 1 DOM
ⓘ Source: listings_history table (triggers on properties + properties_extension) + one-shot
backfill from property_details.listing_events for pre-trigger history.
Tax reassessment forecast MN · Partial reset (capped growth)
- Current annual tax
- $6,890 · $574/mo
- Projected year-2 tax
- $6,890 · $574/mo
- Expected delta
- $0/yr ($0/mo · 0.0%)
ⓘ Screening estimate from a state-policy table — verify with the county assessor before closing.
Climate risk First Street
- Flood 1/10 Low FEMA zone X (unshaded) · 0% chance over 30 yrs
- Wildfire 1/10 Low
- Heat 2/10 Low 7 d/yr ≥99°F today · 14 d/yr by 30 yrs out
- Wind 2/10 Low
- Air quality 2/10 Low 1 unhealthy d/yr today · 2 by 30 yrs out
Nearby sold comps map
Loading sold comps map…
Walkable amenities ~0.75 mi
Loading nearby amenities…
Taxation est. · year 1
- Rental income
- $78,372
- − Mortgage interest
- −$22,401
- − Property taxes
- −$6,890
- − Insurance
- −$2,000
- − Repairs & maintenance
- −$6,270
- − Management
- −$6,270
- − Depreciation
- −$11,633
- Taxable income
- $22,909
- Est. tax owed @ 24.0%
- −$5,498
- After-tax cash flow
- $22,361/yr
For passive investors: Depreciation is non-cash, so a rental often shows a tax loss while cash-flowing — sheltering income. Rental losses are passive: they offset passive income freely, and up to $25,000/yr can offset ordinary (W-2) income if you actively participate and your MAGI is under $100k (phasing out to $0 by $150k); unused losses carry forward. On sale, claimed depreciation is recaptured at up to 25%, and gains may owe capital-gains tax (a 1031 exchange can defer both). Figures are a year-1 estimate at your 24.0% rate — not tax advice; consult a CPA.
Schools (NCES district)
- District
- Minneapolis Public School District
- NCES district ID
- 2721240
- Math proficiency
- 35% ▼ -7.00%
- Reading proficiency
- 46% ▼ -1.00%
- Median HH income
- $50,521
- Composite
- 34.92/100
- National rank
- #5067
- State rank
- #217 of 301 in MN
Livability — Minneapolis
- Score
- 78/100
- State rank
- #110
- US rank
- #2525
Category grades
Schools grade is shown separately in the Schools card above.
Census & demographics
- Census place
- Minneapolis, MN
- County
- Hennepin County · 1,150,272 people
- City population
- 417,555
- Metro
- Minneapolis-St. Paul-Bloomington, MN-WI
- Population (ZIP)
- 37,667
- Household income
- $78,464
- Rent vs Own
- Severe rent burden
- 1583.0
Population outlook (Hennepin County) Hauer SSP2
- Today (2025)
- 1,405,227 people
- By 2030
- 1,492,650 · +6.2%
- By 2040
- 1,660,157 · +18.1%
- By 2050
- 1,823,498 · +29.8%
- By 2075
- 2,221,283 · +58.1%
- By 2100
- 2,509,976 · +78.6%
Race, ethnicity, and origin ACS 2023
- Neighborhood character
- Diverse neighborhood (Simpson 0.66)
- Race & ethnicity
- White 50% Hispanic / Latino 23% Black 18% Two or more races 10% Asian 2% Native American 2%
- Hispanic origin (detail)
- Mexican 15%
- Common ancestry
- Portuguese 8% Romanian 3% Lithuanian 2%
- Foreign-born
- 18% · Canada, Jamaica
- Languages at home
- 68% English-only · Spanish 20% Other Asian/Pacific 1%
Political lean MEDSL · Hennepin
- 2024 margin
- Solid D (+42.6) · D 70.2% · R 27.5% · Other 2.3%
- 2008→2024 swing
- +14.0pp toward D · 2008: 28.6pp · 2024: 42.6pp
- All cycles
- 2024: D+42.6 2020: D+43.2 2016: D+35.3 2012: D+27.1 2008: D+28.6
Not yet ingested
- Civics
- —
Market trends
- HPI YoY
- ▼ -211.97%
- Current HPI
- 292.0322
- Rent YoY
- ▲ 4.30%
- Metro
- Minneapolis-St. Paul-Bloomington, MN-WI
- State GDP YoY
- ▲ 2.41%
- F500 in state
- 34
Industry mix (Fortune 500 HQ in MN)
| Industry | F500 HQs | Revenue |
|---|---|---|
| Healthcare | 2 | $407B |
|
||
| Retail | 2 | $150B |
|
||
| Consumer Goods | 2 | $32B |
|
||
| Industrial Machinery | 2 | $6B |
|
||
| Agriculture | 1 | $40B |
|
||
| Healthcare / Medical Devices | 1 | $32B |
|
||
Price history
+300.3% since first listed32 events — show timeline
- 2026-06-03 Listed $399,900 NORTHSTARMLS as Distributed by MLS Grid
- 2024-09-01 Listing Removed — NORTHSTARMLS as Distributed by MLS Grid
- 2024-07-19 Price Changed $389,900 NORTHSTARMLS as Distributed by MLS Grid
- 2024-05-22 Relisted — NORTHSTARMLS as Distributed by MLS Grid
- 2024-03-23 Contingent — NORTHSTARMLS as Distributed by MLS Grid
- 2024-03-13 Relisted — NORTHSTARMLS as Distributed by MLS Grid
- 2024-01-25 Listed $399,000 NORTHSTARMLS as Distributed by MLS Grid
- 2024-01-24 Coming Soon — NORTHSTARMLS as Distributed by MLS Grid
- 2023-09-02 Listing Removed — NORTHSTARMLS as Distributed by MLS Grid
- 2023-07-14 Price Changed $395,000 NORTHSTARMLS as Distributed by MLS Grid
- 2023-06-23 Price Changed $400,000 NORTHSTARMLS as Distributed by MLS Grid
- 2023-06-23 Listed $4,000,000 NORTHSTARMLS as Distributed by MLS Grid
- 2022-08-17 Listing Removed — NORTHSTARMLS as Distributed by MLS Grid
- 2022-08-02 Relisted — NORTHSTARMLS as Distributed by MLS Grid
- 2022-08-01 Listing Removed — NORTHSTARMLS as Distributed by MLS Grid
- 2022-07-06 Price Changed $410,000 NORTHSTARMLS as Distributed by MLS Grid
- 2022-05-08 Price Changed $420,000 NORTHSTARMLS as Distributed by MLS Grid
- 2022-02-03 Listed $460,000 NORTHSTARMLS as Distributed by MLS Grid
- 2018-04-02 Sold (Public Records) $382,000 Public Records
- 2018-03-28 Sold (MLS) $382,000 NORTHSTARMLS as Distributed by MLS Grid
- 2018-02-23 Pending — NORTHSTARMLS as Distributed by MLS Grid
- 2018-02-13 Contingent — NORTHSTARMLS as Distributed by MLS Grid
- 2017-11-03 Listed $399,900 NORTHSTARMLS as Distributed by MLS Grid
- 2016-10-23 Listing Removed — NORTHSTARMLS as Distributed by MLS Grid
- 2016-07-27 Price Changed $359,900 NORTHSTARMLS as Distributed by MLS Grid
- 2016-06-18 Price Changed $375,000 NORTHSTARMLS as Distributed by MLS Grid
- 2016-05-23 Listed $385,000 NORTHSTARMLS as Distributed by MLS Grid
- 2003-08-27 Sold (Public Records) $300,000 Public Records
- 2003-08-27 Sold (MLS) $300,000 NORTHSTARMLS as Distributed by MLS Grid
- 2003-07-15 Listing Removed — NORTHSTARMLS as Distributed by MLS Grid
- 2003-05-30 Listed $305,000 NORTHSTARMLS as Distributed by MLS Grid
- 1998-06-10 Sold (Public Records) $99,900 Public Records
Property tax history
-0.0%/yrLatest (2025): $6,890 · +16.9% YoY. Source: county tax records.
Cash-flow waterfall
monthlySold comps — $/sqft
last 12 mo · ≤1 miLoading sold comps…