 Fourplex
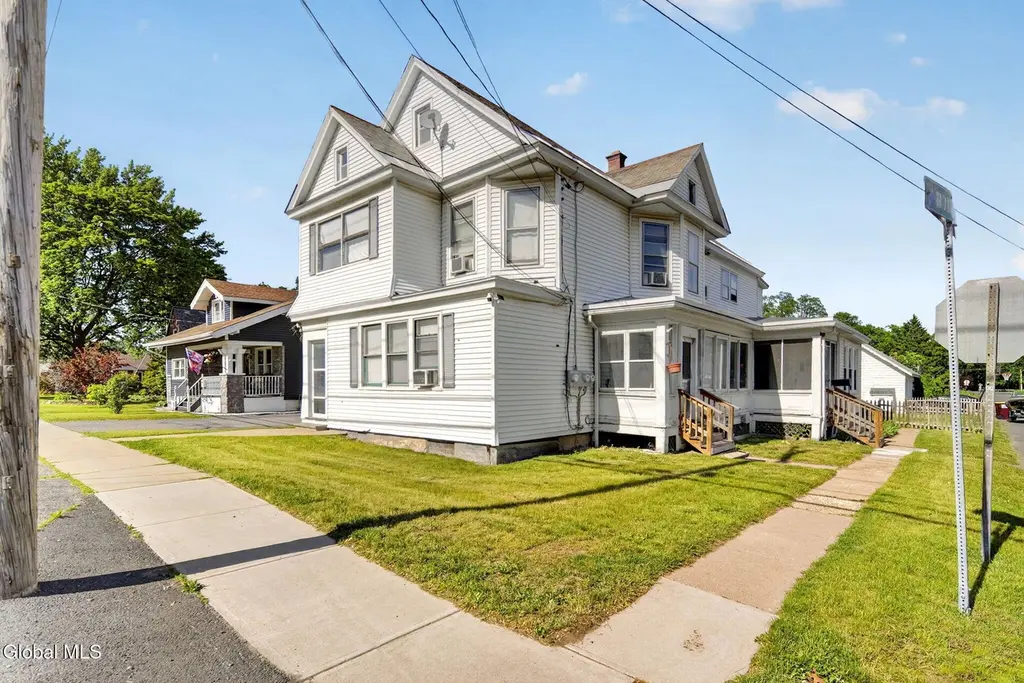
1374 Helderberg Ave · Rotterdam, NY
Flood risk 1/10 · Minimal
- FEMA flood zone
- X (unshaded)
- Chance of flooding over 30 yrs
- 0.0%
- Est. flood insurance / yr
- $473 – $860
Fire risk 3/10 · Minor
- Est. fire insurance / yr
- $691 – $1,283
Heat risk 4/10 · Minor
- Hot days now (above 96°F)
- 7 days/yr
- Hot days in 30 yrs
- 16 days/yr
Wind risk 3/10 · Minor
- Chance of severe wind over 30 yrs
- 5.0%
Air-quality risk 1/10 · Minimal
- Unhealthy air days now
- 0 days/yr
- Unhealthy air days in 30 yrs
- 0 days/yr
Risk factors via First Street. Map © Google.
Why this score? — see what drove the C+ grade
The composite is a weighted blend of 9 inputs, each scored 0–100. Each bar is that input's sub-score; the figure is the points it added to the 100-point composite (weight × sub-score).
- Cash flow +30.0/30.0
- 1% rule +10.0/10.0
- DSCR +10.0/10.0
- Schools +4.5/10.0
- Livability +3.9/5.0
- Rent growth +2.5/5.0
- Condition / age +2.5/5.0
- ARV discount +0.0/15.0
- Appreciation +0.0/10.0
$329,800
🖨 Deal sheet 📄 Offer letter ✓ Due diligence
Multi-family units
County records classify this as Multi-Family (2-4 Unit). Listing-text estimate: 4 units. confirmed
Listing remarks MLS
Great for investment or owner occupied! Fully rented 3 unit in Mohonasen schools with separate utilities. Three 100 amp electric services and three sets of washer/dryer hookups. Attic is partially finished. Large fenced corner lot with a 3 car garage has a loft for extra storage. Being sold to settle the estate.
Key facts
- Separate utilities
- 3-car garage
- Large fenced yard
Tags
Property features AI
Finance
- Other: Three total residential units
Exterior
- Parking: Detached garage; Three garage spaces (six parking spaces total)
- Utilities: Public water; Public sewer
- Home design: Triplex; Living area approximately 2,826
- Construction: Vinyl siding
- Exterior features: Slate roof; Wood fencing in the backyard
Interior
- Bedrooms: Unit 1: 1 bedroom; Unit 2: 2 bedrooms; Unit 3: 3 bedrooms
- Flooring: Carpet; Laminate
- Bathrooms: Three full bathrooms; One half bathroom; Full baths located on 1st and 2nd floors; half bath on 3rd floor
- Heating & cooling: Forced air heating; Natural gas
- Interior features: Carpet and laminate flooring; Unfinished basement
Neighborhood map
What this means for you Summary
Snapshot
- This is a 4 × 2-bed/?-bath units multifamily listed at $330k.
Deal economics
- At list price, monthly cash flow is $2k ($27k/yr) — positive. Per door: $564/mo.
- The deal already cash-flows at list — no discount required.
- Meets the 1% rule at list price ($6k rent vs $330k).
- Cap rate 14.5% vs local median 3.0% in Rotterdam — top-decile yield for the area; either an underpriced asset or a hidden risk that comps aren't pricing in. Stress-test before assuming the spread holds.
Location & tenants
- Location reads 78/100 on livability (#161 in NY, #2,455 nationally) — a middle-class / working-renter tenant base. Strengths: housing A+, health & safety A+, employment B+; Watch: schools D+, crime F.
- Rotterdam-Mohonasen Central School District (suburban): math 48% / reading 56% proficiency, ranked #333 of 590 in NY (top 56%) — acceptable for families but not a draw, mixed tenant base, ~2y average lease.
- Market conditions: 181 active listings in the ZIP; solid renter incomes; 154 units permitted in Schenectady County in 2024 (54 in 5+ unit buildings).
- At $5,937/mo this rent would consume 86% of the median local household income ($83k/yr) (locally 629% of renters already pay >50% of income on rent) — very limited rent-growth headroom before tenants either downsize or default.
Forward outlook
- Local home prices are declining (-3.0%/yr); year-one equity from $2k of loan paydown is wiped out by about $10k of value loss. Plan a longer hold.
- Schenectady County population projected to shrink 4% by 2050 — rents likely to lag national; underwrite the cash flow, not the appreciation.
- At projected returns (-3.0% appreciation + 3.0% rent growth), your $92k cash investment doubles in ~5 years — after that, you're playing with house money.
Negotiation context
- Only 2 days on market — expect competitive offers; lowballing is unlikely to land.
- 3 sale attempts since 9y ago with the ask held roughly flat each time — persistent listings suggest the price (not the market) is what's stuck; bring a comps-based counter.
- Current owner paid $250k; 32% above their basis — modest negotiation headroom, anchor on the comps not their cost.
Risks & watch-outs
- Watch-outs: built in 1938 — expect roof / HVAC / electrical / plumbing capex.
Questions for the listing agent
- Can we see the unit-by-unit rent roll, current vacancy, and any below-market leases? What's the average tenancy length?
- What capital expenditures (roof, boiler, parking lot, exteriors) have been made in the last 5 years, and what's planned in the next 2?
- Built in 1938 — when were the roof, HVAC, electrical panel, plumbing, and water heater last replaced?
- Is there a deadline driving the sale (1031 exchange, divorce, estate, relocation)? That informs how much negotiation room exists.
- Schools are D-rated, which usually means shorter tenancies and higher turnover. Who's the typical renter profile here, and what's been the actual vacancy rate?
- Crime grade is F in this area — have there been break-ins, vandalism, or insurance claims at this property in the last 3 years? What carrier currently insures it and at what premium?
- What's the average days-on-market for RENTAL listings here right now (not sales)? A rising rental-DOM trend means longer vacancies and softer asking-rent achievability than the comps imply.
- What's the recent tenant-quality profile in this submarket — average credit score on applications, eviction rate, late-payment / NSF rate, and stable-employment percentage? A property-management company in the area should have these aggregated.
- How much new apartment / multifamily construction is in the pipeline within 1–3 miles? Heavy new supply (>2% of stock underway) typically softens rents 12–24 months out; light construction supports rent growth.
Investment metrics
- 1% rule
- 1.80% ✓
- Cap rate
- 14.50%
- Cash-on-cash
- 29.33%
- DSCR
- 2.30
- GRM
- 4.6
CMA / ARV
- ARV (on-the-fly)
- $257,166
- Comps found
- 5
Show comp detail 5 sales within ~0.75 mi
| Address | Dist | Beds/Ba | Sqft | Sold | Price | $/sf | Match |
|---|---|---|---|---|---|---|---|
| 1005 Congress St | 0.70mi | 7/3.0 (+1) | 2,690 (-5%) | 5mo | $85,000 | $32 | 48 |
| 2122 Broadway | 0.65mi | 6/2.0 | 2,738 (-3%) | 13mo | $250,000 | $91 | 48 |
| 1017 Hegeman St | 0.41mi | 5/2.0 (-1) | 2,568 (-9%) | 13mo | $322,000 | $125 | 44 |
| 2030 Euclid Ave | 0.60mi | 6/2.0 | 2,496 (-12%) | 4mo | $300,000 | $120 | 43 |
| 1918 Euclid Ave | 0.61mi | 5/2.0 (-1) | 2,412 (-15%) | 13mo | $213,000 | $88 | 25 |
Match score weights: distance 35% · size 25% · config 20% · recency 20%. Top-matched comps best support the ARV.
Projected returns pro-forma
-3.0% appreciation · 3.0% rent growth · sell at horizon
- IRR
- 23.8%
- Equity multiple
- 1.98×
- Total profit
- $90,482
- Equity at exit
- $49,174
- IRR
- 31.7%
- Equity multiple
- 3.87×
- Total profit
- $264,627
- Equity at exit
- $28,515
Cash invested: $92,344 (down + closing). Projections, not guarantees.
Landlord ↔ Tenant lean methodology
- Overall (STATE)
- 15 Strongly Tenant-Friendly
- State New York
- 15 Strongly Tenant-Friendly · D+10
- County
- — inherits STATE
- City
- — inherits STATE
ZIP-level market 12306
- Home prices YoY
- -23.8%
- Active inventory
- 181
- Price-to-rent
- 18.5×
Monthly cashflow live
- Estimated rent
- $5,937 medium interval (Pro) →
- Mortgage (P&I)
- −$1,730
- Tax from tax record
- −$566 /mo · $6,798/yr
- Insurance
- −$137
- HOA
- −$0
- Vacancy / Maint / Mgmt
- −$1,247
- Net cashflow
- $2,257
Break-even live
4-unit breakdown (identical units grouped — click to expand)
| Units | Beds | Baths | Est. rent |
|---|---|---|---|
| 4× units | 2 | — | $5,936 |
| #1 | 2 | — | $1,484 |
| #2 | 2 | — | $1,484 |
| #3 | 2 | — | $1,484 |
| #4 | 2 | — | $1,484 |
| Total (4 units) | $5,937 | ||
UW: 25.0% down · 7.5% · 30yr · 1.5% tax · 5.0% vac · 8.0% maint · 8.0% mgmt
Financing live
Cash to close
- Down payment
- $82,450
- Closing costs
- $9,894
- Reserves months
- —
- Total cash needed
- —
Loan-product check · same deal, 3 products live
Conventional
25% down · 7.5% · 30yr
- Down + closing
- —
- Monthly P&I
- —
- Monthly cashflow
- —
- DSCR
- —
- Eligible?
- —
Personal DTI + credit; lowest rate.
DSCR
20% down · 8.5% · 30yr
- Down + closing
- —
- Monthly P&I
- —
- Monthly cashflow
- —
- DSCR
- —
- Eligible?
- —
No personal income docs; deal must DSCR.
Hard money
10% down · 12.0% · 12mo
- Down + closing
- —
- Monthly P&I
- —
- Monthly cashflow
- —
- DSCR
- —
- Eligible?
- —
Short-term bridge; refi at stabilization.
Listing history 3 events
-
2026-06-14statusdays on market $329,800 Pending 2 DOM
-
2026-06-09remarks 699-char remark
-
2026-06-09$329,800 Active 1 DOM
ⓘ Source: listings_history table (triggers on properties + properties_extension) + one-shot
backfill from property_details.listing_events for pre-trigger history.
Tax reassessment forecast NY · Partial reset (capped growth)
- Current annual tax
- $6,798 · $566/mo
- Projected year-2 tax
- $6,798 · $566/mo
- Expected delta
- $0/yr ($0/mo · 0.0%)
ⓘ Screening estimate from a state-policy table — verify with the county assessor before closing.
Climate risk First Street
- Flood 1/10 Low FEMA zone X (unshaded) · 0% chance over 30 yrs
- Wildfire 3/10 Moderate
- Heat 4/10 Moderate 7 d/yr ≥96°F today · 16 d/yr by 30 yrs out
- Wind 3/10 Moderate 5% chance of damaging wind over 30 yrs
- Air quality 1/10 Low 0 unhealthy d/yr today · 0 by 30 yrs out
Nearby sold comps map
Loading sold comps map…
Walkable amenities ~0.75 mi
Loading nearby amenities…
Taxation est. · year 1
- Rental income
- $71,244
- − Mortgage interest
- −$18,474
- − Property taxes
- −$6,798
- − Insurance
- −$1,649
- − Repairs & maintenance
- −$5,700
- − Management
- −$5,700
- − Depreciation
- −$9,594
- Taxable income
- $23,330
- Est. tax owed @ 24.0%
- −$5,599
- After-tax cash flow
- $21,483/yr
For passive investors: Depreciation is non-cash, so a rental often shows a tax loss while cash-flowing — sheltering income. Rental losses are passive: they offset passive income freely, and up to $25,000/yr can offset ordinary (W-2) income if you actively participate and your MAGI is under $100k (phasing out to $0 by $150k); unused losses carry forward. On sale, claimed depreciation is recaptured at up to 25%, and gains may owe capital-gains tax (a 1031 exchange can defer both). Figures are a year-1 estimate at your 24.0% rate — not tax advice; consult a CPA.
Schools (NCES district)
- District
- Rotterdam-Mohonasen Central School District
- NCES district ID
- 3600004
- Math proficiency
- 48% ▼ -4.00%
- Reading proficiency
- 56% ▲ 9.00%
- Median HH income
- $59,640
- Composite
- 45.34/100
- National rank
- #2638
- State rank
- #333 of 590 in NY
Livability — Rotterdam
- Score
- 78/100
- State rank
- #161
- US rank
- #2455
Category grades
Schools grade is shown separately in the Schools card above.
Census & demographics
- Census place
- Rotterdam, NY
- County
- Schenectady County · 141,369 people
- Metro
- Albany-Schenectady-Troy, NY
- Population (ZIP)
- 27,865
- Household income
- $83,202
- Rent vs Own
- Severe rent burden
- 629.0
Population outlook (Schenectady County) Hauer SSP2
- Today (2025)
- 155,046 people
- By 2030
- 154,322 · -0.5%
- By 2040
- 151,796 · -2.1%
- By 2050
- 148,621 · -4.1%
- By 2075
- 141,229 · -8.9%
- By 2100
- 126,014 · -18.7%
Race, ethnicity, and origin ACS 2023
- Neighborhood character
- Predominantly White (78%)
- Race & ethnicity
- White 78% Two or more races 8% Black 7% Hispanic / Latino 7% Asian 3%
- Hispanic origin (detail)
- Puerto Rican 4% Dominican 1%
- Common ancestry
- Romanian 7% Lithuanian 5% Iranian 3%
- Foreign-born
- 6% · Canada
- Languages at home
- 94% English-only · Spanish 3% Other Indo-European 1% Other Asian/Pacific 1%
Political lean MEDSL · Schenectady
- 2024 margin
- D (+10.8) · D 55.4% · R 44.6%
- 2008→2024 swing
- -1.8pp toward R · 2008: 12.7pp · 2024: 10.8pp
- All cycles
- 2024: D+10.8 2020: D+15.7 2016: D+5.8 2012: D+15.4 2008: D+12.7
Not yet ingested
- Civics
- —
Market trends
- HPI YoY
- ▼ -91.35%
- Current HPI
- 292.1229
- Rent YoY
- —
- Metro
- Albany-Schenectady-Troy, NY
- State GDP YoY
- ▲ 2.60%
- F500 in state
- 92
Industry mix (Fortune 500 HQ in NY)
| Industry | F500 HQs | Revenue |
|---|---|---|
| Financial Services | 10 | $950B |
|
||
| Consumer Goods | 9 | $162B |
|
||
| Insurance | 4 | $225B |
|
||
| Telecommunications | 2 | $144B |
|
||
| Pharmaceuticals | 2 | $112B |
|
||
| Media / Entertainment | 2 | $69B |
|
||
Price history
+32.0% since first listed7 events — show timeline
- 2026-06-09 Listed $329,800 Global MLS
- 2023-06-14 Sold (MLS) $250,000 Global MLS
- 2023-05-11 Pending — Global MLS
- 2023-05-09 Listed $249,900 Global MLS
- 2017-11-27 Listing Removed — Global MLS
- 2017-09-30 Price Changed $239,900 Global MLS
- 2017-05-27 Listed $249,900 Global MLS
Property tax history
-2.6%/yrLatest (2025): $6,798 · +1.9% YoY. Source: county tax records.
Cash-flow waterfall
monthlySold comps — $/sqft
last 12 mo · ≤1 miLoading sold comps…