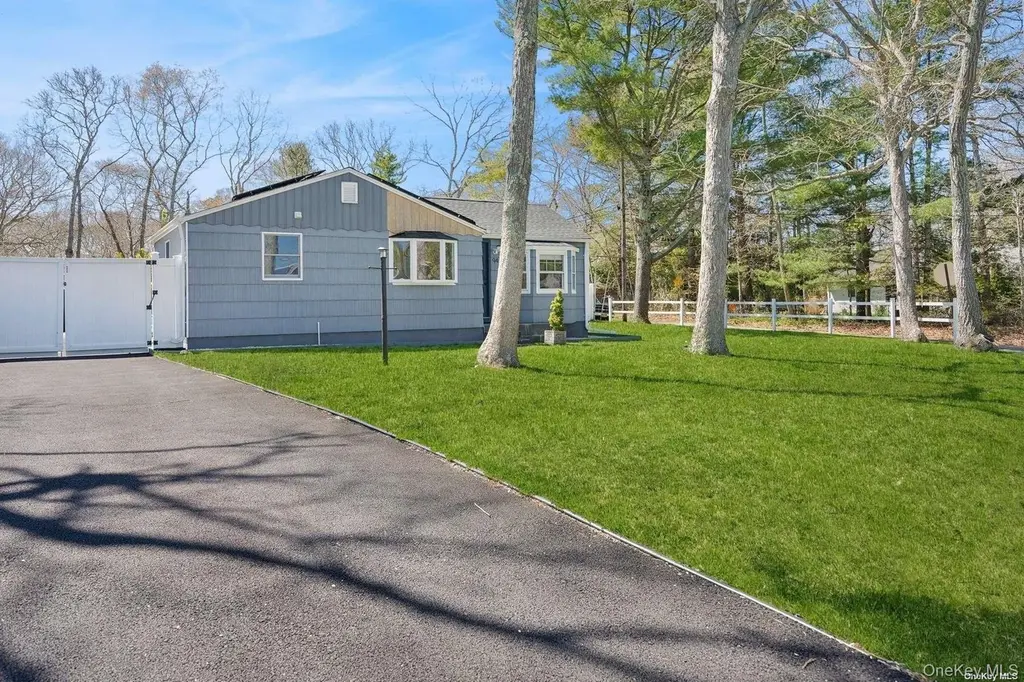
94 E Bay Ave · Hampton Bays, NY
Flood risk 1/10 · Minimal
- FEMA flood zone
- X (unshaded)
- Chance of flooding over 30 yrs
- 0.0%
- Est. flood insurance / yr
- $473 – $860
Fire risk 1/10 · Minimal
- Est. fire insurance / yr
- $691 – $1,283
Heat risk 4/10 · Minor
- Hot days now (above 90°F)
- 7 days/yr
- Hot days in 30 yrs
- 21 days/yr
Wind risk 8/10 · Major
- Chance of severe wind over 30 yrs
- 80.0%
Air-quality risk 3/10 · Minor
- Unhealthy air days now
- 2 days/yr
- Unhealthy air days in 30 yrs
- 3 days/yr
Risk factors via First Street. Map © Google.
Why this score? — see what drove the F grade
The composite is a weighted blend of 9 inputs, each scored 0–100. Each bar is that input's sub-score; the figure is the points it added to the 100-point composite (weight × sub-score).
- Cash flow +12.5/30.0
- Rent growth +5.0/5.0
- Schools +4.0/10.0
- DSCR +3.7/10.0
- Livability +3.4/5.0
- 1% rule +2.6/10.0
- Condition / age +2.5/5.0
- ARV discount +0.0/15.0
- Appreciation +0.0/10.0
$990,000
🖨 Deal sheet (PDF) 📄 Offer letter ✓ Due diligence
Listing remarks MLS
Gorgeous Renovation of L Shaped Ranch Near Shinnecock Bay. Totally Renovated From Head to Toe on Spacious .32 Acre Secluded Prop. w Room For Pool - Near Ocean Beach too. Redone Hardwood Floors, New Electric, HW Heater, Irrigation too! A Front Door Entrance Leads You to Your Lovely Living Room which is Open to a Bright Brand New E.I.K. with Stainless Steel Appliances. The Kitchen also Leads you to a Family Room off the Back of the House, which Could Easily Be a 3rd Bedroom, Office, or Dining Room. There is a Door From the Family Room that Leads to a Walking Patio and Beautiful Covered Entertaining Deck. The Lovely Grassed & Spacious Backyard is Fenced with a Storage Shed also. Inside There is a Large Master Bedroom with Double Closets, Bedroom 2 with a Bay Window, & Hallway with Pull Down Attic Stairs. Enjoy Your Brand New Beautiful Full Bath with Tiled Walk In Shower. Outside Bilco Door to a Partially Finished Basement w Washer & Dryer & New Driveway-6 Cars. Near Town & Starbucks!!, Additional information: Appearance:Excellent,Interior Features:Marble Bath,Separate Hotwater Heater:Yes
Key facts
- Covered porch
- Stone deck
- Solar panels
Tags
Property features AI
Exterior
- Parking: Driveway
- Utilities: Cesspool or septic tank; Cable available; Electricity available
- Home design: Single family residence; One story
- Construction: Frame construction
- Exterior features: In-ground private pool; Gas grill; Fenced yard; Sprinklers front and rear; Level lot; Near public transit; Near school; Covered patio
Interior
- Kitchen: Dishwasher; Microwave; Refrigerator; Granite counters; Eat-in kitchen
- Bedrooms: Primary bedroom located on the first floor
- Flooring: Hardwood
- Bathrooms: 2 full bathrooms
- Heating & cooling: Electric heating; Heat pump; Ductless cooling
- Interior features: Eat-in kitchen; Granite counters; Primary bathroom; First-floor bedroom; Master bedroom on main floor; Covered patio
- Laundry & utility: Washer; Dryer; Electric water heater
Neighborhood map
What this means for you Summary
Snapshot
- This is a 2-bed/1.0-bath single-family listed at $990k.
Deal economics
- At list price, monthly cash flow is $-137 ($-2k/yr) — negative.
- To cash-flow at today's rent, offer at most $966k (2.4% below list).
- To meet the 1% rule (rent ≥ 1% of price), the offer needs to be $748k (24.5% below list).
- Recommended offer: $748k (24.5% below list) — sets the bar for 1% rule.
Location & tenants
- Location reads 68/100 on livability (#551 in NY) — a middle-class / working-renter tenant base. Strengths: crime A+, employment A+, health & safety B+; Watch: amenities F, commute F, cost of living F.
- Hampton Bays Union Free School District (suburban): math 45% / reading 44% proficiency, ranked #434 of 590 in NY (top 74%) — families likely to look elsewhere, expect single-tenant / working-renter base with shorter leases.
- Zoned schools: Hampton Bays Elementary School (math 32% / reading 52%, grade F, #1,361 of 2,108 statewide, top 67%, 682 students, 55% FRL); Hampton Bays Middle School (math 25% / reading 38%, grade F, #522 of 729 statewide, top 73%, 597 students, 64% FRL); Hampton Bays High School (math 98% / reading 57%, grade A-, #580 of 1,100 statewide, top 53%, 769 students, 53% FRL) — zoned schools average 58% FRL vs 38% district-wide (20 pts higher); higher-poverty schools than district average — tighter screening recommended.
- Market conditions: Rents rising fast (+16.1%/yr); 173 active listings in the ZIP; 8 comparable units currently listed for rent nearby; rentals lingering (median 45d on market — plan ~5-8 weeks vacancy on turnover, expect pricing pressure); 62% of comp listings sitting > 30 days — soft ceiling on asking rent; high-income renter base; 1,366 units permitted in Suffolk County in 2024 (216 in 5+ unit buildings).
- At $7,477/mo this rent would consume 67% of the median local household income ($134k/yr) (locally 199% of renters already pay >50% of income on rent) — very limited rent-growth headroom before tenants either downsize or default.
Forward outlook
- Local home prices are declining (-3.0%/yr); year-one equity from $7k of loan paydown is wiped out by about $30k of value loss. Plan a longer hold.
- Suffolk County population projected to shrink 5% by 2050 — rents likely to lag national; underwrite the cash flow, not the appreciation.
Negotiation context
- Only 13 days on market — expect competitive offers; lowballing is unlikely to land.
- 5 sale attempts since 7y ago with the ask held roughly flat each time — persistent listings suggest the price (not the market) is what's stuck; bring a comps-based counter.
- Current owner paid $520k; list at $990k implies a 90% gain — meaningful room to come down on a strong offer.
Risks & watch-outs
- Watch-outs: built in 1952 — expect roof / HVAC / electrical / plumbing capex.
- Climate carrying-cost: severe wind risk, 80% chance of damaging wind over 30y — expect insurance premiums to compound above CPI over the hold.
Questions for the listing agent
- What do current leases actually rent for vs. the listed asking? Can we see a recent rent roll and the last 12 months of T-12 income?
- Built in 1952 — when were the roof, HVAC, electrical panel, plumbing, and water heater last replaced?
- Is there a deadline driving the sale (1031 exchange, divorce, estate, relocation)? That informs how much negotiation room exists.
- Schools are B-rated — typically a magnet for longer-tenancy family renters. What's the average tenant stay here, and is there a school-zone premium baked into asking?
- The area grade is low — what's the realistic commute time and amenity access for the typical tenant pool here? Any planned neighborhood developments (good or bad) we should know about?
- What's the average days-on-market for RENTAL listings here right now (not sales)? A rising rental-DOM trend means longer vacancies and softer asking-rent achievability than the comps imply.
- What's the recent tenant-quality profile in this submarket — average credit score on applications, eviction rate, late-payment / NSF rate, and stable-employment percentage? A property-management company in the area should have these aggregated.
- How much new for-sale + rental construction is in the pipeline within 1–3 miles? Heavy new supply typically softens prices + rents 12–24 months out; constrained supply supports both.
Investment metrics
- 1% rule
- 0.76% ✗
- Cap rate
- 6.13%
- Cash-on-cash
- -0.59%
- DSCR
- 0.97
- GRM
- 11.0
CMA / ARV
- ARV (on-the-fly)
- $735,816
- Comps found
- 10
Show comp detail 10 sales within ~0.75 mi
| Address | Dist | Beds/Ba | Sqft | Sold | Price | $/sf | Match |
|---|---|---|---|---|---|---|---|
| 12 Harvard Dr | 0.31mi | 3/1.0 (+1) | 1,016 (+3%) | 10mo | $717,000 | $706 | 68 |
| 28 Kyle Rd | 0.33mi | 3/2.0 (+1) | 1,008 (+2%) | 12mo | $770,000 | $764 | 62 |
| 32 Hampton Rd | 0.45mi | 2/1.0 | 900 (-9%) | 8mo | $635,000 | $706 | 57 |
| 8 Park Ln | 0.71mi | 2/2.0 | 1,000 (+1%) | 9mo | $685,000 | $685 | 53 |
| 4 Holiday Ct | 0.40mi | 3/2.0 (+1) | 1,097 (+11%) | 6mo | $700,000 | $638 | 49 |
| 39 Foster Ave | 0.46mi | 2/2.0 | 900 (-9%) | 14mo | $700,000 | $778 | 48 |
| 39 Lynncliff Rd | 0.51mi | 3/2.0 (+1) | 1,112 (+12%) | 0mo | $790,000 | $710 | 46 |
| 48 Foster Ave | 0.55mi | 1/1.0 (-1) | 855 (-14%) | 14mo | $740,000 | $865 | 36 |
| 18 Lovell Rd | 0.65mi | 3/1.5 (+1) | 1,100 (+11%) | 12mo | $818,000 | $744 | 34 |
| 94 Lynncliff Rd | 0.68mi | 3/1.5 (+1) | 1,130 (+14%) | 19mo | $910,000 | $805 | 22 |
Match score weights: distance 35% · size 25% · config 20% · recency 20%. Top-matched comps best support the ARV.
Projected returns pro-forma
-3.0% appreciation · 8.0% rent growth · sell at horizon
- IRR
- -12.5%
- Equity multiple
- 0.53×
- Total profit
- $-129,985
- Equity at exit
- $147,612
- IRR
- 2.3%
- Equity multiple
- 1.19×
- Total profit
- $53,930
- Equity at exit
- $85,597
Cash invested: $277,200 (down + closing). Projections, not guarantees.
Landlord ↔ Tenant lean methodology
- Overall (STATE)
- 15 Strongly Tenant-Friendly
- State New York
- 15 Strongly Tenant-Friendly · D+10
- County
- — inherits STATE
- City
- — inherits STATE
ZIP-level market 11946
- Home prices YoY
- -20.3%
- Rents YoY
- 16.1%
- Active inventory
- 173
- Price-to-rent
- 11.0×
Monthly cashflow live
- Estimated rent
- $7,477 medium interval (Pro) →
- Mortgage (P&I)
- −$5,192
- Tax from tax record
- −$440 /mo · $5,276/yr
- Insurance
- −$412
- HOA
- −$0
- Vacancy / Maint / Mgmt
- −$1,570
- Net cashflow
- $-137
Break-even live
Sensitivity live
| Price | -10% $424 | -5% $144 | +0% $-137 | +5% $-417 | +10% $-697 |
|---|---|---|---|---|---|
| Rent | -10% $-727 | -5% $-432 | +0% $-137 | +5% $159 | +10% $454 |
| Rate | -1.0pp $362 | -0.5pp $115 | base $-137 | +0.5pp $-393 | +1.0pp $-654 |
UW: 25.0% down · 7.5% · 30yr · 1.5% tax · 5.0% vac · 8.0% maint · 8.0% mgmt
Financing live
Cash to close
- Down payment
- $247,500
- Closing costs
- $29,700
- Reserves months
- —
- Total cash needed
- —
Loan-product check · same deal, 3 products live
Conventional
25% down · 7.5% · 30yr
- Down + closing
- —
- Monthly P&I
- —
- Monthly cashflow
- —
- DSCR
- —
- Eligible?
- —
Personal DTI + credit; lowest rate.
DSCR
20% down · 8.5% · 30yr
- Down + closing
- —
- Monthly P&I
- —
- Monthly cashflow
- —
- DSCR
- —
- Eligible?
- —
No personal income docs; deal must DSCR.
Hard money
10% down · 12.0% · 12mo
- Down + closing
- —
- Monthly P&I
- —
- Monthly cashflow
- —
- DSCR
- —
- Eligible?
- —
Short-term bridge; refi at stabilization.
Rent comps 8 comps
| Address | Beds | Baths | Sqft | Rent | $/sqft | DOM | Units | Dist |
|---|---|---|---|---|---|---|---|---|
| 94 Bay Ave E Hampton Bays, NY | 2.0 | 2.0 | 1000 | $20,000 | $20.00 | 16d | 1 | 0.02mi |
| 25 Gardners Ln Unit A Hampton Bays, NY | 2.0 | 1.5 | 1000 | $3,750 | $3.75 | 26d | 1 | 0.56mi |
| 28 Bay Ave W Hampton Bays, NY | 3.0 | 2.5 | 945 | $66,000 | $69.84 | 45d | 1 | 0.62mi |
| 68 Foster Ave #12 Hampton Bays, NY | 2.0 | 1.5 | 1125 | $18,000 | $16.00 | 45d | 1 | 0.66mi |
| 62 Canoe Place Rd #627 Hampton Bays, NY | 2.0 | 1.0 | 661 | $4,500 | $6.81 | 45d | 1 | 1.18mi |
| 49 Canoe Place Rd #212 Hampton Bays, NY | 1.0 | 1.0 | 672 | $3,700 | $5.51 | 45d | 1 | 1.22mi |
| 18 Old Riverhead Rd Hampton Bays, NY | 3.0 | 2.0 | 1056 | $13,500 | $12.78 | 26d | 1 | 1.49mi |
| 164 W Montauk Hwy Hampton Bays, NY | 1.0–2.0 | 1.0–1.5 | 610 | $4,195 | $6.88 | 45d | 1 | 1.50mi |
Listing history 9 events
-
2026-06-21days on market $990,000 Active 13 DOM
-
2026-06-18days on market $990,000 Active 10 DOM
-
2026-06-17days on market $990,000 Active 9 DOM
-
2026-06-16days on market $990,000 Active 8 DOM
-
2026-06-15days on market $990,000 Active 7 DOM
-
2026-06-13days on market $990,000 Active 5 DOM
-
2026-06-13days on market $990,000 Active 4 DOM
-
2026-06-08remarks 435-char remark
-
2026-06-08$990,000 Active 1 DOM
ⓘ Source: listings_history table (triggers on properties + properties_extension) + one-shot
backfill from property_details.listing_events for pre-trigger history.
Tax reassessment forecast NY · Partial reset (capped growth)
- Current annual tax
- $5,276 · $440/mo
- Projected year-2 tax
- $11,003 · $917/mo
- Expected delta
- +$5,728/yr (+$477/mo · 108.6%)
ⓘ Screening estimate from a state-policy table — verify with the county assessor before closing.
Climate risk First Street
- Flood 1/10 Low FEMA zone X (unshaded) · 0% chance over 30 yrs
- Wildfire 1/10 Low
- Heat 4/10 Moderate 7 d/yr ≥90°F today · 21 d/yr by 30 yrs out
- Wind 8/10 Severe 80% chance of damaging wind over 30 yrs
- Air quality 3/10 Moderate 2 unhealthy d/yr today · 3 by 30 yrs out
Nearby sold comps map
Loading sold comps map…
Walkable amenities ~0.75 mi
Loading nearby amenities…
Taxation est. · year 1
- Rental income
- $89,729
- − Mortgage interest
- −$55,455
- − Property taxes
- −$5,276
- − Insurance
- −$4,950
- − Repairs & maintenance
- −$7,178
- − Management
- −$7,178
- − Depreciation
- −$28,800
- Taxable loss
- −$19,108
- Est. tax savings @ 24.0%
- +$4,586
- After-tax cash flow
- $2,947/yr
For passive investors: Depreciation is non-cash, so a rental often shows a tax loss while cash-flowing — sheltering income. Rental losses are passive: they offset passive income freely, and up to $25,000/yr can offset ordinary (W-2) income if you actively participate and your MAGI is under $100k (phasing out to $0 by $150k); unused losses carry forward. On sale, claimed depreciation is recaptured at up to 25%, and gains may owe capital-gains tax (a 1031 exchange can defer both). Figures are a year-1 estimate at your 24.0% rate — not tax advice; consult a CPA.
Schools (NCES district)
- District
- Hampton Bays Union Free School District
- NCES district ID
- 3613530
- Math proficiency
- 45% ▼ -8.00%
- Reading proficiency
- 44% ▼ -1.00%
- Median HH income
- $70,274
- Composite
- 40.18/100
- National rank
- #3788
- State rank
- #434 of 590 in NY
Livability — Hampton Bays
- Score
- 68/100
- State rank
- #551
- US rank
- #9894
Category grades
Schools grade is shown separately in the Schools card above.
Census & demographics
- Census place
- Hampton Bays, NY
- County
- Suffolk County · 679,920 people
- City population
- 15,819
- Metro
- New York-Newark-Jersey City, NY-NJ-PA
- Population (ZIP)
- 15,819
- Household income
- $133,918
- Rent vs Own
- Severe rent burden
- 199.0
Population outlook (Suffolk County) Hauer SSP2
- Today (2025)
- 1,505,262 people
- By 2030
- 1,498,318 · -0.5%
- By 2040
- 1,471,101 · -2.3%
- By 2050
- 1,424,848 · -5.3%
- By 2075
- 1,337,157 · -11.2%
- By 2100
- 1,217,720 · -19.1%
Race, ethnicity, and origin ACS 2023
- Neighborhood character
- Majority White (62%)
- Race & ethnicity
- White 62% Hispanic / Latino 32% Two or more races 13% Asian 3% Black 2%
- Hispanic origin (detail)
- Mexican 6%
- Common ancestry
- Romanian 4% Slovak 2% Portuguese 2%
- Foreign-born
- 26% · Canada, Jamaica, Guatemala
- Languages at home
- 64% English-only · Spanish 29% Other Indo-European 2% French/Haitian/Cajun 2%
Political lean MEDSL · Suffolk
- 2024 margin
- Lean R (+10.0) · D 45.0% · R 55.0%
- 2008→2024 swing
- -16.0pp toward R · 2008: 6.0pp · 2024: -10.0pp
- All cycles
- 2024: R+10.0 2020: R+0.0 2016: R+8.2 2012: D+2.9 2008: D+6.0
Not yet ingested
- Civics
- —
Market trends
- HPI YoY
- ▼ -118.82%
- Current HPI
- 467.2466
- Rent YoY
- ▲ 16.07%
- Metro
- New York-Newark-Jersey City, NY-NJ-PA
- State GDP YoY
- ▲ 2.60%
- F500 in state
- 92
Industry mix (Fortune 500 HQ in NY)
| Industry | F500 HQs | Revenue |
|---|---|---|
| Financial Services | 10 | $950B |
|
||
| Consumer Goods | 9 | $162B |
|
||
| Insurance | 4 | $225B |
|
||
| Telecommunications | 2 | $144B |
|
||
| Pharmaceuticals | 2 | $112B |
|
||
| Media / Entertainment | 2 | $69B |
|
||
Price history
+900.0% since first listed16 events — show timeline
- 2026-06-08 Listed $990,000 OneKey® MLS as Distributed by MLS Grid
- 2026-06-05 Listed for Rent $20,000 ONEKEY
- 2024-08-16 Rental Removed $15,000 ONEKEY
- 2024-06-12 Price Changed $15,000 ONEKEY
- 2024-04-25 Price Changed $20,000 ONEKEY
- 2024-04-25 Listed for Rent $40,000 ONEKEY
- 2021-03-23 Sold (Public Records) $520,000 Public Records
- 2020-11-18 Sold (MLS) $20,000 OneKey® MLS as Distributed by MLS Grid
- 2020-08-08 Price Changed $539,000 OneKey® MLS as Distributed by MLS Grid
- 2020-07-14 Price Changed $575,000 OneKey® MLS as Distributed by MLS Grid
- 2020-05-29 Listed $599,000 OneKey® MLS as Distributed by MLS Grid
- 2019-09-13 Sold (Public Records) $305,000 Public Records
- 2019-08-21 Sold (MLS) $305,000 OneKey® MLS as Distributed by MLS Grid
- 2019-07-09 Pending — OneKey® MLS as Distributed by MLS Grid
- 2019-06-21 Listed $350,000 OneKey® MLS as Distributed by MLS Grid
- 1998-12-24 Sold (Public Records) $99,000 Public Records
Property tax history
+6.5%/yrLatest (2022): $5,276 · +0.0% YoY. Source: county tax records.
Cash-flow waterfall
monthlySold comps — $/sqft
last 12 mo · ≤1 miLoading sold comps…