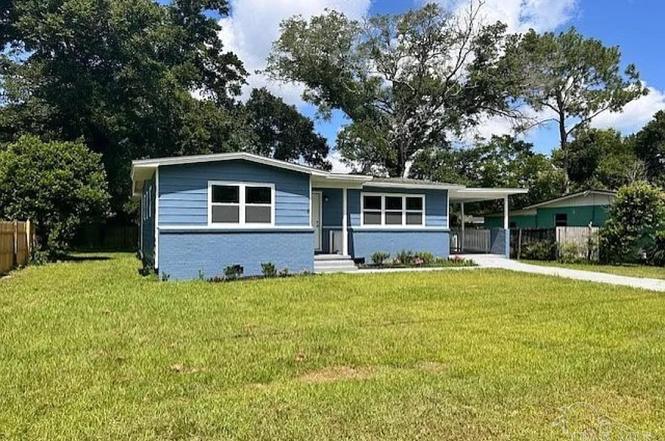
1011 Trenton Dr · West Pensacola, FL
Flood risk 1/10 · Minimal
- FEMA flood zone
- X (unshaded)
- Chance of flooding over 30 yrs
- 0.0%
- Est. flood insurance / yr
- $507 – $1,088
Fire risk 1/10 · Minimal
- Est. fire insurance / yr
- $947 – $1,759
Heat risk 10/10 · Severe
- Hot days now (above 105°F)
- 7 days/yr
- Hot days in 30 yrs
- 24 days/yr
Wind risk 9/10 · Severe
- Chance of severe wind over 30 yrs
- 99.0%
Air-quality risk 1/10 · Minimal
- Unhealthy air days now
- 0 days/yr
- Unhealthy air days in 30 yrs
- 0 days/yr
Risk factors via First Street. Map © Google.
Why this score? — see what drove the C+ grade
The composite is a weighted blend of 9 inputs, each scored 0–100. Each bar is that input's sub-score; the figure is the points it added to the 100-point composite (weight × sub-score).
- Cash flow +25.8/30.0
- ARV discount +10.1/15.0
- DSCR +8.6/10.0
- 1% rule +6.5/10.0
- Rent growth +3.7/5.0
- Schools +3.6/10.0
- Livability +3.3/5.0
- Condition / age +2.5/5.0
- Appreciation +0.0/10.0
$154,999
🖨 Deal sheet 📄 Offer letter ✓ Due diligence
Listing remarks
A completely fixed up traditional home, new roof, new kitchen, new floors, new everything! This home was completely redone in 2024 and into 2025, it turned out beautiful and has a great beach feel. There are 4 bedrooms, it's 100% modern and updated and priced to sell! Come and take a look today, if you need 4 bedrooms, a house where everything has been updated, and affordable we are top of the list!
Key facts
- 8,276 sq ft lot
- Parking
- Built 1959
Property features AI
Finance
- HOA & community: No association
Exterior
- Parking: Carport (1 covered space, total 1 parking space)
- Utilities: Public water; Public sewer; Circuit breaker electric service
- Home design: Single-story brick home; Resale property; Not attached to another unit; Slab foundation; Composition roof
- Construction: Brick construction; Slab foundation; Composition roof; One level
- Exterior features: Back yard fencing; Paved, public maintained road access
Interior
- Kitchen: Dishwasher; Refrigerator; Electric water heater; Solid surface countertops
- Bedrooms: Master bedroom on the first level, approximately 15 x 14
- Flooring: Vinyl; Carpet
- Bathrooms: 1 full bathroom (updated)
- Heating & cooling: Central heating; Central air; Ceiling fan(s)
- Interior features: Living/dining combo; Updated bathroom; Updated kitchen with solid surface countertops
Neighborhood map
What this means for you Summary
Snapshot
- This is a 4-bed/1.0-bath single-family listed at $155k.
Deal economics
- At list price, monthly cash flow is $374 ($4k/yr) — positive.
- The deal already cash-flows at list — no discount required.
- Meets the 1% rule at list price ($2k rent vs $155k).
- Recommended offer: $146k (6.0% below list) — sets the bar for market timing.
Location & tenants
- Location reads 66/100 on livability (#629 in FL) — a middle-class / working-renter tenant base. Strengths: cost of living A+, housing A+, health & safety B+; Watch: crime D, schools F, amenities F.
- Escambia (suburban): math 40% / reading 45% proficiency, ranked #56 of 73 in FL (top 77%) — families likely to look elsewhere, expect single-tenant / working-renter base with shorter leases.
- Market conditions: Rents rising fast (+4.9%/yr); 198 active listings in the ZIP; 9 comparable units currently listed for rent nearby; rentals at typical pace (median 24d on market — plan ~3-4 weeks tenant-placement turnaround); lower-income renter base — watch delinquency; 1,479 units permitted in Escambia County in 2024 (0 in 5+ unit buildings).
- At $1,786/mo this rent would consume 48% of the median local household income ($45k/yr) (locally 1458% of renters already pay >50% of income on rent) — very limited rent-growth headroom before tenants either downsize or default.
Forward outlook
- Local home prices are declining (-3.0%/yr); year-one equity from $1k of loan paydown is wiped out by about $5k of value loss. Plan a longer hold.
- Escambia County population projected at +13% by 2050 — modest demand growth; plan on rents tracking national, not racing it.
- At projected returns (-3.0% appreciation + 4.9% rent growth), your $43k cash investment doubles in ~9 years — after that, you're playing with house money.
Negotiation context
- It's been on market 65 days — a 6% lower offer ($146k) is reasonable based on typical stale-listing flexibility.
- 4 sale attempts since 2y ago; this cycle's ask has dropped $15k (9%) from the opening price — seller is motivated, your offer sets the floor, not the list.
- Current owner paid $65k; list at $155k implies a 138% gain — meaningful room to come down on a strong offer.
Risks & watch-outs
- Watch-outs: built in 1959 — expect roof / HVAC / electrical / plumbing capex.
- Climate carrying-cost: severe wind risk, 99% chance of damaging wind over 30y; extreme-heat days projected 7→24/yr by 2055 (HVAC capex compounding) — expect insurance premiums to compound above CPI over the hold.
Questions for the listing agent
- It's been on market 65 days. Have you received any prior offers? Is the seller open to a 6% concession, seller financing, or rate buy-down credit?
- Built in 1959 — when were the roof, HVAC, electrical panel, plumbing, and water heater last replaced?
- Why hasn't it sold? Are there any deal-killer items the seller is aware of (foundation, flood, title, zoning, code violations)?
- Is there a deadline driving the sale (1031 exchange, divorce, estate, relocation)? That informs how much negotiation room exists.
- Schools are F-rated, which usually means shorter tenancies and higher turnover. Who's the typical renter profile here, and what's been the actual vacancy rate?
- Crime grade is D in this area — have there been break-ins, vandalism, or insurance claims at this property in the last 3 years? What carrier currently insures it and at what premium?
- What's the average days-on-market for RENTAL listings here right now (not sales)? A rising rental-DOM trend means longer vacancies and softer asking-rent achievability than the comps imply.
- What's the recent tenant-quality profile in this submarket — average credit score on applications, eviction rate, late-payment / NSF rate, and stable-employment percentage? A property-management company in the area should have these aggregated.
- How much new for-sale + rental construction is in the pipeline within 1–3 miles? Heavy new supply typically softens prices + rents 12–24 months out; constrained supply supports both.
Investment metrics
- 1% rule
- 1.15% ✓
- Cap rate
- 9.19%
- Cash-on-cash
- 10.35%
- DSCR
- 1.46
- GRM
- 7.2
CMA / ARV
- ARV (on-the-fly)
- $164,340
- Comps found
- 12
Show comp detail 12 sales within ~0.75 mi
| Address | Dist | Beds/Ba | Sqft | Sold | Price | $/sf | Match |
|---|---|---|---|---|---|---|---|
| 832 S Madison Dr | 0.17mi | 4/1.0 | 1,290 (+4%) | 9mo | $131,000 | $102 | 79 |
| 117 Aquamarine Ave | 0.49mi | 3/1.0 (-1) | 1,243 (-0%) | 1mo | $82,500 | $66 | 71 |
| 6 Georgia Dr | 0.39mi | 4/2.0 | 1,206 (-3%) | 3mo | $157,000 | $130 | 70 |
| 923 S Madison Dr | 0.21mi | 4/2.0 | 1,368 (+10%) | 2mo | $180,000 | $132 | 68 |
| 1102 Revere Dr | 0.21mi | 3/1.5 (-1) | 1,396 (+12%) | 1mo | $95,000 | $68 | 62 |
| 305 N Madison Dr | 0.36mi | 4/2.0 | 1,373 (+10%) | 1mo | $200,000 | $146 | 62 |
| 10 Tennessee Dr | 0.43mi | 3/2.0 (-1) | 1,318 (+6%) | 1mo | $260,000 | $197 | 60 |
| 1026 Northview Dr | 0.11mi | 3/1.5 (-1) | 1,422 (+14%) | 10mo | $203,000 | $143 | 56 |
| 99 S Madison Dr | 0.60mi | 3/1.0 (-1) | 1,286 (+3%) | 8mo | $153,000 | $119 | 55 |
| 1023 W Webster Dr | 0.29mi | 3/1.0 (-1) | 1,393 (+12%) | 10mo | $229,000 | $164 | 53 |
| 203 Opal Ave | 0.38mi | 3/1.0 (-1) | 1,412 (+13%) | 9mo | $80,000 | $57 | 47 |
| 3320 Two Sisters Way | 0.74mi | 3/2.0 (-1) | 1,140 (-8%) | 0mo | $210,000 | $184 | 42 |
Match score weights: distance 35% · size 25% · config 20% · recency 20%. Top-matched comps best support the ARV.
Projected returns pro-forma
-3.0% appreciation · 4.92% rent growth · sell at horizon
- IRR
- 1.3%
- Equity multiple
- 1.05×
- Total profit
- $2,257
- Equity at exit
- $23,111
- IRR
- 12.7%
- Equity multiple
- 2.10×
- Total profit
- $47,707
- Equity at exit
- $13,401
Cash invested: $43,400 (down + closing). Projections, not guarantees.
Landlord ↔ Tenant lean methodology
- Overall (STATE)
- 87 Strongly Landlord-Friendly
- State Florida
- 87 Strongly Landlord-Friendly · R+3
- County
- — inherits STATE
- City
- — inherits STATE
ZIP-level market 32505
- Home prices YoY
- -26.5%
- Rents YoY
- 4.9%
- Active inventory
- 198
- Price-to-rent
- 7.2×
Monthly cashflow live
- Estimated rent
- $1,786 high interval (Pro) →
- Mortgage (P&I)
- −$813
- Tax from tax record
- −$159 /mo · $1,909/yr
- Insurance
- −$65
- HOA
- −$0
- Vacancy / Maint / Mgmt
- −$375
- Net cashflow
- $374
Break-even live
UW: 25.0% down · 7.5% · 30yr · 1.5% tax · 5.0% vac · 8.0% maint · 8.0% mgmt
Financing live
Cash to close
- Down payment
- $38,750
- Closing costs
- $4,650
- Reserves months
- —
- Total cash needed
- —
Loan-product check · same deal, 3 products live
Conventional
25% down · 7.5% · 30yr
- Down + closing
- —
- Monthly P&I
- —
- Monthly cashflow
- —
- DSCR
- —
- Eligible?
- —
Personal DTI + credit; lowest rate.
DSCR
20% down · 8.5% · 30yr
- Down + closing
- —
- Monthly P&I
- —
- Monthly cashflow
- —
- DSCR
- —
- Eligible?
- —
No personal income docs; deal must DSCR.
Hard money
10% down · 12.0% · 12mo
- Down + closing
- —
- Monthly P&I
- —
- Monthly cashflow
- —
- DSCR
- —
- Eligible?
- —
Short-term bridge; refi at stabilization.
Rent comps 9 comps
| Address | Beds | Baths | Sqft | Rent | $/sqft | DOM | Units | Dist |
|---|---|---|---|---|---|---|---|---|
| 221 Edison Dr Pensacola, FL | 3.0 | 1.0 | 1500 | $1,598 | $1.07 | 23d | 1 | 0.46mi |
| 3216 Two Sisters Way Pensacola, FL | 3.0 | 2.0 | 1117 | $1,700 | $1.52 | 23d | 1 | 0.83mi |
| 101 Vanderbilt Rd Pensacola, FL | 3.0 | 2.0 | 1104 | $1,850 | $1.68 | 21d | 1 | 0.87mi |
| 3417 W Fisher St Unit C Pensacola, FL | 3.0 | 2.0 | 1106 | $1,350 | $1.22 | 23d | 1 | 0.88mi |
| 2702 Massachusetts Ave Pensacola, FL | 1.0–3.0 | 1.0–2.5 | 1150 | $1,745 | $1.52 | 14d | 9 | 1.23mi |
| 918 Montclair Rd Pensacola, FL | 3.0 | 1.0 | 1012 | $1,500 | $1.48 | 14d | 1 | 1.24mi |
| 4519 Martha Ave Pensacola, FL | 3.0 | 1.0 | 1104 | $1,600 | $1.45 | 23d | 1 | 1.34mi |
| 852 Garnet St Pensacola, FL | 3.0 | 1.5 | 1150 | $1,150 | $1.00 | 14d | 1 | 1.44mi |
| 902 Lucerne Ave Pensacola, FL | 3.0 | 2.0 | 1276 | $1,600 | $1.25 | 23d | 1 | 1.45mi |
Listing history 23 events
-
2026-05-14status Pending
-
2026-04-21price $154,999
-
2026-04-02price $159,999
-
2026-03-20price $164,999
-
2026-03-10$169,999 Active
-
2025-08-22historical
-
2025-07-15price $164,999
-
2025-06-05price $168,400
-
2025-05-28status Active
-
2025-05-28price $169,900
-
2025-05-13status Pending
-
2025-04-07price $179,000
-
2025-04-01price $180,000
-
2025-03-27price $182,500
-
2025-02-21status Active
-
2025-02-21price $185,000
-
2025-01-18historical
-
2024-12-19price $191,500
-
2024-08-29price $199,900
-
2024-08-07price $209,000
-
2024-07-30price $219,900
-
2024-07-17$229,900 Active
-
2023-10-24soldstatus $65,000
ⓘ Source: listings_history table (triggers on properties + properties_extension) + one-shot
backfill from property_details.listing_events for pre-trigger history.
Tax reassessment forecast FL · Resets to sale price
- Current annual tax
- $1,909 · $159/mo
- Projected year-2 tax
- $1,909 · $159/mo
- Expected delta
- $0/yr ($0/mo · 0.0%)
ⓘ Screening estimate from a state-policy table — verify with the county assessor before closing.
Climate risk First Street
- Flood 1/10 Low FEMA zone X (unshaded) · 0% chance over 30 yrs
- Wildfire 1/10 Low
- Heat 10/10 Extreme 7 d/yr ≥105°F today · 24 d/yr by 30 yrs out
- Wind 9/10 Extreme 99% chance of damaging wind over 30 yrs
- Air quality 1/10 Low 0 unhealthy d/yr today · 0 by 30 yrs out
Nearby sold comps map
Loading sold comps map…
Walkable amenities ~0.75 mi
Loading nearby amenities…
Taxation est. · year 1
- Rental income
- $21,433
- − Mortgage interest
- −$8,682
- − Property taxes
- −$1,909
- − Insurance
- −$775
- − Repairs & maintenance
- −$1,715
- − Management
- −$1,715
- − Depreciation
- −$4,509
- Taxable income
- $2,128
- Est. tax owed @ 24.0%
- −$511
- After-tax cash flow
- $3,983/yr
For passive investors: Depreciation is non-cash, so a rental often shows a tax loss while cash-flowing — sheltering income. Rental losses are passive: they offset passive income freely, and up to $25,000/yr can offset ordinary (W-2) income if you actively participate and your MAGI is under $100k (phasing out to $0 by $150k); unused losses carry forward. On sale, claimed depreciation is recaptured at up to 25%, and gains may owe capital-gains tax (a 1031 exchange can defer both). Figures are a year-1 estimate at your 24.0% rate — not tax advice; consult a CPA.
Schools (NCES district)
- District
- Escambia
- NCES district ID
- 1200510
- Math proficiency
- 40% ▼ -9.00%
- Reading proficiency
- 45% ▼ -4.00%
- Median HH income
- $44,649
- Composite
- 36.04/100
- National rank
- #4773
- State rank
- #56 of 73 in FL
Livability — West Pensacola
- Score
- 66/100
- State rank
- #629
- US rank
- #12275
Category grades
Schools grade is shown separately in the Schools card above.
Census & demographics
- Census place
- West Pensacola, FL
- County
- Escambia County · 301,722 people
- Metro
- Pensacola-Ferry Pass-Brent, FL
- Population (ZIP)
- 27,877
- Household income
- $44,783
- Rent vs Own
- Severe rent burden
- 1458.0
Population outlook (Escambia County) Hauer SSP2
- Today (2025)
- 334,637 people
- By 2030
- 345,779 · +3.3%
- By 2040
- 364,828 · +9.0%
- By 2050
- 378,514 · +13.1%
- By 2075
- 403,220 · +20.5%
- By 2100
- 386,125 · +15.4%
Race, ethnicity, and origin ACS 2023
- Neighborhood character
- Diverse neighborhood (Simpson 0.66)
- Race & ethnicity
- Black 48% White 32% Hispanic / Latino 11% Two or more races 9% Asian 2%
- Hispanic origin (detail)
- Mexican 5% Cuban 2%
- Common ancestry
- Slovak 2% Italian 1% Serbian 1%
- Foreign-born
- 9% · Canada, Vietnam
- Languages at home
- 87% English-only · Spanish 9% Other Indo-European 1% Vietnamese 1%
Political lean MEDSL · Escambia
- 2024 margin
- R (+19.5) · D 39.7% · R 59.2% · Other 1.1%
- 2008→2024 swing
- -0.2pp no change · 2008: -19.3pp · 2024: -19.5pp
- All cycles
- 2024: R+19.5 2020: R+15.1 2016: R+20.6 2012: R+20.6 2008: R+19.3
Not yet ingested
- Civics
- —
Market trends
- HPI YoY
- ▼ -74.10%
- Current HPI
- 205.45
- Rent YoY
- ▲ 4.92%
- Metro
- Pensacola-Ferry Pass-Brent, FL
- State GDP YoY
- ▲ 3.28%
- F500 in state
- 36
Industry mix (Fortune 500 HQ in FL)
| Industry | F500 HQs | Revenue |
|---|---|---|
| Industrial Technology | 2 | $29B |
|
||
| Insurance | 2 | $17B |
|
||
| Retail | 1 | $60B |
|
||
| Technology Distribution | 1 | $58B |
|
||
| Homebuilding | 1 | $35B |
|
||
| Technology Manufacturing | 1 | $35B |
|
||
Price history
+138.5% since first listed23 events — show timeline
- 2026-05-14 Pending — PARMLS
- 2026-04-21 Price Changed $154,999 PARMLS
- 2026-04-02 Price Changed $159,999 PARMLS
- 2026-03-20 Price Changed $164,999 PARMLS
- 2026-03-10 Listed $169,999 PARMLS
- 2025-08-22 Listing Removed — PARMLS
- 2025-07-15 Price Changed $164,999 PARMLS
- 2025-06-05 Price Changed $168,400 PARMLS
- 2025-05-28 Relisted — PARMLS
- 2025-05-28 Price Changed $169,900 PARMLS
- 2025-05-13 Pending — PARMLS
- 2025-04-07 Price Changed $179,000 PARMLS
- 2025-04-01 Price Changed $180,000 PARMLS
- 2025-03-27 Price Changed $182,500 PARMLS
- 2025-02-21 Relisted — PARMLS
- 2025-02-21 Price Changed $185,000 PARMLS
- 2025-01-18 Listing Removed — PARMLS
- 2024-12-19 Price Changed $191,500 PARMLS
- 2024-08-29 Price Changed $199,900 PARMLS
- 2024-08-07 Price Changed $209,000 PARMLS
- 2024-07-30 Price Changed $219,900 PARMLS
- 2024-07-17 Listed $229,900 PARMLS
- 2023-10-24 Sold (Public Records) $65,000 Public Records
Property tax history
+20.3%/yrLatest (2025): $1,909 · +24.4% YoY. Source: county tax records.
Cash-flow waterfall
monthlySold comps — $/sqft
last 12 mo · ≤1 miLoading sold comps…