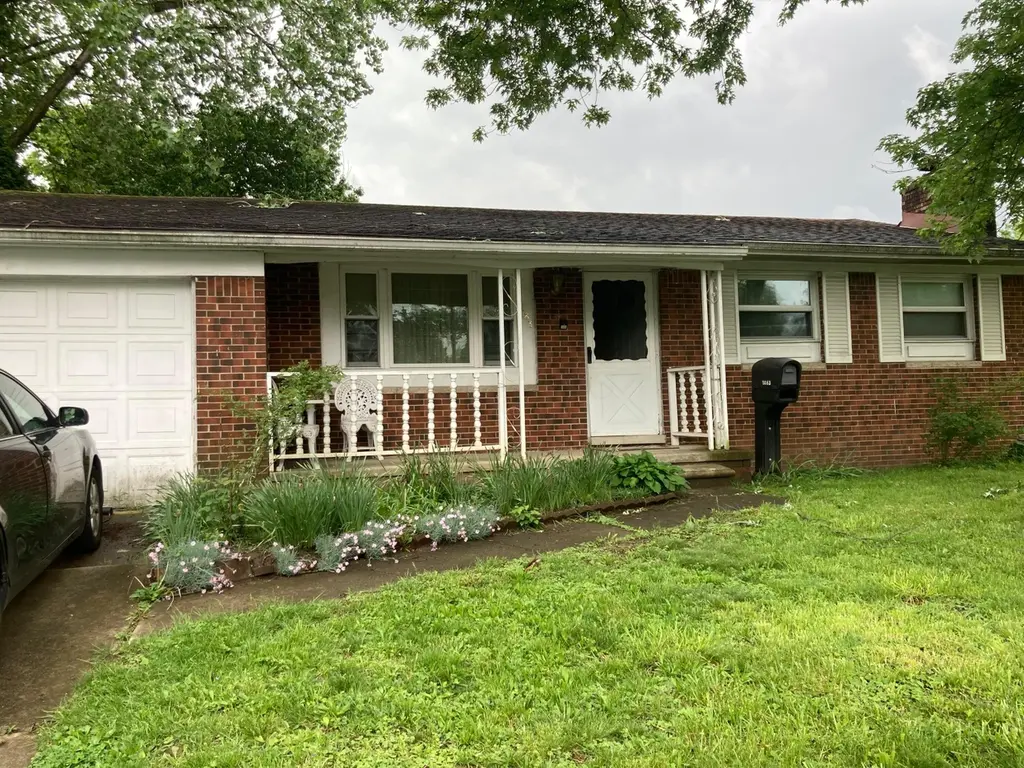
5083 Jameson Dr · Columbus, OH
Flood risk 1/10 · Minimal
- FEMA flood zone
- X (unshaded)
- Chance of flooding over 30 yrs
- 0.0%
- Est. flood insurance / yr
- $473 – $860
Fire risk 1/10 · Minimal
- Est. fire insurance / yr
- $713 – $1,323
Heat risk 4/10 · Minor
- Hot days now (above 99°F)
- 7 days/yr
- Hot days in 30 yrs
- 18 days/yr
Wind risk 2/10 · Minimal
- Chance of severe wind over 30 yrs
- 1.0%
Air-quality risk 2/10 · Minimal
- Unhealthy air days now
- 1 days/yr
- Unhealthy air days in 30 yrs
- 1 days/yr
Risk factors via First Street. Map © Google.
Why this score? — see what drove the D- grade
The composite is a weighted blend of 9 inputs, each scored 0–100. Each bar is that input's sub-score; the figure is the points it added to the 100-point composite (weight × sub-score).
- ARV discount +15.0/15.0
- Cash flow +7.1/30.0
- Livability +4.0/5.0
- Rent growth +3.1/5.0
- Condition / age +2.5/5.0
- 1% rule +1.8/10.0
- Schools +1.7/10.0
- DSCR +1.2/10.0
- Appreciation +0.0/10.0
$209,900
🖨 Deal sheet (PDF) 📄 Offer letter ✓ Due diligence
Listing remarks
Welcome to 5083 Jameson - a well-maintained ranch offering comfort, functionality, and endless potential. Major mechanical updates have already been completed, including a new furnace (2024) and water heater (2025), providing added peace of mind for the next owner. Step outside to enjoy a nice backyard featuring a spacious deck--perfect for summer barbecues, entertaining guests, or simply relaxing in your own private outdoor retreat. The lower level expands the living space with a generous recreation room centered around a cozy fireplace, making it an ideal setting for movie nights, game days, a home office, or a personal fitness area. Whether you're a first-time homebuyer, downsizing, or s
Key facts
- New furnace
- Water heater
- Spacious deck
Tags
Property features AI
Finance
- HOA & community: Sidewalk (association amenity)
Exterior
- Parking: Attached garage (1 car)
- Utilities: Public water; Public sewer
- Home design: Single family residence; One level; Built in 1966; No common walls
- Construction: Block foundation
- Exterior features: Deck; Fenced yard; Shed(s)
Interior
- Bedrooms: Three main-level bedrooms
- Flooring: Wood flooring
- Bathrooms: One full bathroom
- Heating & cooling: Central air conditioning
- Interior features: Insulated windows throughout; Wood-burning fireplace (one)
Neighborhood map
What this means for you Summary
Snapshot
- This is a 3-bed/1.0-bath single-family listed at $210k.
Deal economics
- At list price, monthly cash flow is $-303 ($-4k/yr) — negative.
- To cash-flow at today's rent, offer at most $156k (25.5% below list).
- To meet the 1% rule (rent ≥ 1% of price), the offer needs to be $142k (32.2% below list).
- Recommended offer: $142k (32.2% below list) — sets the bar for 1% rule.
- Cap rate 4.6% vs local median 3.8% in Columbus — meaningfully above typical; check what's discounted (condition, days-on-market, listing class) to confirm the premium yield is real.
Location & tenants
- Location reads 81/100 on livability (#97 in OH, #1,491 nationally) — a professional / high-income tenant draw. Strengths: commute A+, cost of living A+, housing A+; Watch: employment C-, crime F.
- Columbus City School District (urban): math 15% / reading 26% proficiency, ranked #626 of 656 in OH (top 95%) — low school quality limits family demand, transient renter base, plan for 1-2y turnover; 72% free/reduced lunch — lower-income household profile, screen leases tightly.
- Zoned schools: Indianola Informal K-8 School (math 43% / reading 58%, grade D+, #896 of 1,584 statewide, top 57%, 684 students, 0% FRL); Arts Impact Middle School (Aims) (math 17% / reading 25%, grade F, #608 of 654 statewide, top 93%, 532 students, 0% FRL); Columbus Alternative High School (math 27% / reading 74%, grade D+, #380 of 781 statewide, top 49%, 758 students, 0% FRL) — zoned schools average 0% FRL vs 72% district-wide (72 pts lower); this property's tenant base skews higher-income than the district average.
- Zoned-school proficiency averages 41% at this address vs 20% district-wide (+20 pts) — the actual schools serving this property are materially stronger than the Columbus City School District average implies; a family-tenant draw the district grade alone would hide.
- Market conditions: Rents rising (+2.4%/yr); 92 active listings in the ZIP; 14 comparable units currently listed for rent nearby; rentals leasing fast (median 10d on market — plan ~1-2 weeks tenant-placement turnaround); 8,139 units permitted in Franklin County in 2024 (5,940 in 5+ unit buildings).
- This rent runs 33% of the median local income ($51k/yr) — at the standard rent-burdened threshold; future hikes will face affordability resistance.
Forward outlook
- Local home prices are declining (-3.0%/yr); year-one equity from $1k of loan paydown is wiped out by about $6k of value loss. Plan a longer hold.
- Franklin County population projected at +34% by 2050 — long-run rental-demand tailwind backs the buy-and-hold thesis.
Negotiation context
- It's been on market 25 days — a 2% lower offer ($207k) is reasonable based on typical stale-listing flexibility.
- 5 sale attempts since 31y ago with the ask held roughly flat each time — persistent listings suggest the price (not the market) is what's stuck; bring a comps-based counter.
- Current owner paid $72k; list at $210k implies a 190% gain — meaningful room to come down on a strong offer.
Questions for the listing agent
- What do current leases actually rent for vs. the listed asking? Can we see a recent rent roll and the last 12 months of T-12 income?
- Built in 1966 — when were the roof, HVAC, electrical panel, plumbing, and water heater last replaced?
- Is there a deadline driving the sale (1031 exchange, divorce, estate, relocation)? That informs how much negotiation room exists.
- Crime grade is F in this area — have there been break-ins, vandalism, or insurance claims at this property in the last 3 years? What carrier currently insures it and at what premium?
- The area grade is low — what's the realistic commute time and amenity access for the typical tenant pool here? Any planned neighborhood developments (good or bad) we should know about?
- What's the average days-on-market for RENTAL listings here right now (not sales)? A rising rental-DOM trend means longer vacancies and softer asking-rent achievability than the comps imply.
- What's the recent tenant-quality profile in this submarket — average credit score on applications, eviction rate, late-payment / NSF rate, and stable-employment percentage? A property-management company in the area should have these aggregated.
- How much new for-sale + rental construction is in the pipeline within 1–3 miles? Heavy new supply typically softens prices + rents 12–24 months out; constrained supply supports both.
Investment metrics
- 1% rule
- 0.68% ✗
- Cap rate
- 4.56%
- Cash-on-cash
- -6.18%
- DSCR
- 0.72
- GRM
- 12.3
CMA / ARV
- ARV (median comp)
- $253,516
- List price
- $209,900
- Delta
- -13.22%
- Verdict
- UNDERPRICED
- Comps
- 20 within 1.0 mi
Show comp detail 12 sales within ~0.75 mi
| Address | Dist | Beds/Ba | Sqft | Sold | Price | $/sf | Match |
|---|---|---|---|---|---|---|---|
| 5132 Botsford Dr | 0.09mi | 3/1.0 | 972 (0%) | 19mo | $209,900 | $216 | 80 |
| 2264 Majestic Dr W | 0.31mi | 3/1.0 | 936 (-4%) | 0mo | $219,900 | $235 | 79 |
| 5168 Mapleridge Dr | 0.56mi | 3/1.0 | 990 (+2%) | 1mo | $140,000 | $141 | 70 |
| 4895 Majestic Dr E | 0.27mi | 3/2.0 | 936 (-4%) | 10mo | $206,000 | $220 | 69 |
| 1945 Riverdale Rd | 0.57mi | 3/1.0 | 990 (+2%) | 2mo | $190,000 | $192 | 69 |
| 5024 Refugee Rd | 0.48mi | 3/1.0 | 999 (+3%) | 8mo | $163,000 | $163 | 67 |
| 5268 Carbondale Dr | 0.37mi | 3/2.0 | 904 (-7%) | 5mo | $210,000 | $232 | 63 |
| 4906 Refugee Rd | 0.50mi | 3/1.0 | 925 (-5%) | 7mo | $155,000 | $168 | 63 |
| 5179 Lindora Dr | 0.46mi | 3/1.0 | 1,036 (+7%) | 13mo | $203,000 | $196 | 57 |
| 5194 Orlando Ct | 0.67mi | 3/2.0 | 1,015 (+4%) | 6mo | $205,897 | $203 | 52 |
| 4776 Crocker Rd | 0.61mi | 3/1.0 | 912 (-6%) | 14mo | $205,000 | $225 | 50 |
| 1887 Lonsdale Rd | 0.74mi | 3/1.0 | 909 (-6%) | 11mo | $204,000 | $224 | 45 |
Match score weights: distance 35% · size 25% · config 20% · recency 20%. Top-matched comps best support the ARV.
Projected returns pro-forma
-3.0% appreciation · 2.36% rent growth · sell at horizon
- IRR
- -27.6%
- Equity multiple
- 0.08×
- Total profit
- $-54,201
- Equity at exit
- $31,297
- IRR
- -28.4%
- Equity multiple
- -0.29×
- Total profit
- $-75,688
- Equity at exit
- $18,148
Cash invested: $58,772 (down + closing). Projections, not guarantees.
Landlord ↔ Tenant lean methodology
- Overall (STATE)
- 73 Landlord-Friendly
- State Ohio
- 73 Landlord-Friendly · R+6
- County
- — inherits STATE
- City
- — inherits STATE
ZIP-level market 43232
- Rents YoY
- 2.4%
- Active inventory
- 92
- Price-to-rent
- 12.3×
Monthly cashflow live
- Estimated rent
- $1,423 high interval (Pro) →
- Mortgage (P&I)
- −$1,101
- Tax from tax record
- −$239 /mo · $2,867/yr
- Insurance
- −$87
- HOA
- −$0
- Lot rent
- −$0
- Vacancy / Maint / Mgmt
- −$299
- Net cashflow
- $-303
Break-even live
Sensitivity live
| Price | -10% $-184 | -5% $-243 | +0% $-303 | +5% $-362 | +10% $-422 |
|---|---|---|---|---|---|
| Rent | -10% $-415 | -5% $-359 | +0% $-303 | +5% $-247 | +10% $-190 |
| Rate | -1.0pp $-197 | -0.5pp $-249 | base $-303 | +0.5pp $-357 | +1.0pp $-413 |
UW: 25.0% down · 7.5% · 30yr · 1.5% tax · 5.0% vac · 8.0% maint · 8.0% mgmt
Financing live
Cash to close
- Down payment
- $52,475
- Closing costs
- $6,297
- Reserves months
- —
- Total cash needed
- —
Loan-product check · same deal, 3 products live
Conventional
25% down · 7.5% · 30yr
- Down + closing
- —
- Monthly P&I
- —
- Monthly cashflow
- —
- DSCR
- —
- Eligible?
- —
Personal DTI + credit; lowest rate.
DSCR
20% down · 8.5% · 30yr
- Down + closing
- —
- Monthly P&I
- —
- Monthly cashflow
- —
- DSCR
- —
- Eligible?
- —
No personal income docs; deal must DSCR.
Hard money
10% down · 12.0% · 12mo
- Down + closing
- —
- Monthly P&I
- —
- Monthly cashflow
- —
- DSCR
- —
- Eligible?
- —
Short-term bridge; refi at stabilization.
Rent comps 14 comps
| Address | Beds | Baths | Sqft | Rent | $/sqft | DOM | Units | Dist |
|---|---|---|---|---|---|---|---|---|
| 5125 Cedar Dr Columbus, OH | 1.0–2.0 | 1.0 | 772 | $1,110 | $1.44 | 10d | 4 | 0.46mi |
| 2038 Noe Bixby Rd Columbus, OH | 2.0 | 1.0 | 1000 | $1,365 | $1.36 | 5d | 1 | 0.54mi |
| 5168 Mapleridge Dr Columbus, OH | 3.0 | 1.0 | 990 | $1,695 | $1.71 | 0d | 1 | 0.54mi |
| 1843 Fleming Rd Unit 1 Columbus, OH | 3.0 | 1.5 | 1000 | $1,595 | $1.59 | 26d | 1 | 0.76mi |
| 5623-5625 Chatford Dr Columbus, OH | 2.0 | 1.5 | 1010 | $1,085 | $1.07 | 19d | 1 | 0.84mi |
| 5623-5625 Chatford Dr Unit 5623 Columbus, OH | 2.0 | 1.5 | 1010 | $1,085 | $1.07 | 19d | 1 | 0.84mi |
| 1839 Jason Dr Columbus, OH | 3.0 | 2.0 | 1053 | $1,649 | $1.57 | 0d | 1 | 0.84mi |
| 5020 Chatterton Rd Columbus, OH | 1.0–2.0 | 1.0 | 674 | $1,163 | $1.73 | 0d | 6 | 0.93mi |
| 2680 Silver Oak Dr Columbus, OH | 1.0–2.0 | 1.0–2.0 | 965 | $1,549 | $1.60 | 0d | 20 | 0.97mi |
| 2400 Shore Blvd W Columbus, OH | 1.0–2.0 | 1.0–1.5 | 729 | $1,249 | $1.71 | 4d | 34 | 0.99mi |
| 1699 Lonsdale Rd Unit 1707 Columbus, OH | 2.0 | 1.0 | 1038 | $995 | $0.96 | 26d | 1 | 1.02mi |
| 5953 Rock Glen Ct Unit 5953 Columbus, OH | 2.0 | 1.5 | 1120 | $1,350 | $1.21 | 0d | 1 | 1.33mi |
| 1736 Sun Apple Way Unit 1736 Columbus, OH | 2.0 | 1.0 | 800 | $1,100 | $1.38 | 17d | 1 | 1.34mi |
| 1537 Duffield Dr Columbus, OH | 3.0 | 2.0 | 1020 | $1,500 | $1.47 | 46d | 1 | 1.46mi |
Listing history 28 events
-
2026-06-22days on market $209,900 Active 25 DOM
-
2026-06-21days on market $209,900 Active 24 DOM
-
2026-06-18days on market $209,900 Active 21 DOM
-
2026-06-17days on market $209,900 Active 20 DOM
-
2026-06-16days on market $209,900 Active 19 DOM
-
2026-06-15days on market $209,900 Active 18 DOM
-
2026-06-13days on market $209,900 Active 16 DOM
-
2026-06-13days on market $209,900 Active 15 DOM
-
2026-06-09days on market $209,900 Active 12 DOM
-
2026-06-08days on market $209,900 Active 11 DOM
-
2026-06-07days on market $209,900 Active 10 DOM
-
2026-06-05days on market $209,900 Active 7 DOM
-
2026-06-03days on market $209,900 Active 6 DOM
-
2026-06-02days on market $209,900 Active 5 DOM
-
2026-06-01days on market $209,900 Active 4 DOM
-
2026-05-31days on market $209,900 Active 3 DOM
-
2026-05-14historical Contingent 498-char remark
-
2026-05-02$220,000 Active 498-char remark
-
2026-04-29historical $220,000 498-char remark
-
2007-02-21historical
-
2006-08-20$110,000
-
1999-05-23historical
-
1998-11-25$82,500
-
1995-12-18soldstatus $72,500
-
1995-12-08soldstatus $72,500
-
1995-11-07historical
-
1995-09-26$75,000
-
1980-02-01soldstatus $41,900
ⓘ Source: listings_history table (triggers on properties + properties_extension) + one-shot
backfill from property_details.listing_events for pre-trigger history.
Tax reassessment forecast OH · Partial reset (capped growth)
- Current annual tax
- $2,867 · $239/mo
- Projected year-2 tax
- $3,071 · $256/mo
- Expected delta
- +$204/yr (+$17/mo · 7.1%)
ⓘ Screening estimate from a state-policy table — verify with the county assessor before closing.
Climate risk First Street
- Flood 1/10 Low FEMA zone X (unshaded) · 0% chance over 30 yrs
- Wildfire 1/10 Low
- Heat 4/10 Moderate 7 d/yr ≥99°F today · 18 d/yr by 30 yrs out
- Wind 2/10 Low 100% chance of damaging wind over 30 yrs
- Air quality 2/10 Low 1 unhealthy d/yr today · 1 by 30 yrs out
Nearby sold comps map
Loading sold comps map…
Walkable amenities ~0.75 mi
Loading nearby amenities…
Taxation est. · year 1
- Rental income
- $17,078
- − Mortgage interest
- −$11,758
- − Property taxes
- −$2,867
- − Insurance
- −$1,050
- − Repairs & maintenance
- −$1,366
- − Management
- −$1,366
- − Depreciation
- −$6,106
- Taxable loss
- −$7,434
- Est. tax savings @ 24.0%
- +$1,784
- After-tax cash flow
- $-1,849/yr
For passive investors: Depreciation is non-cash, so a rental often shows a tax loss while cash-flowing — sheltering income. Rental losses are passive: they offset passive income freely, and up to $25,000/yr can offset ordinary (W-2) income if you actively participate and your MAGI is under $100k (phasing out to $0 by $150k); unused losses carry forward. On sale, claimed depreciation is recaptured at up to 25%, and gains may owe capital-gains tax (a 1031 exchange can defer both). Figures are a year-1 estimate at your 24.0% rate — not tax advice; consult a CPA.
Schools (NCES district)
- District
- Columbus City School District
- NCES district ID
- 3904380
- Math proficiency
- 15% ▼ -17.00%
- Reading proficiency
- 26% ▼ -12.00%
- Median HH income
- $38,483
- Composite
- 17.19/100
- National rank
- #9105
- State rank
- #626 of 656 in OH
Livability — Columbus
- Score
- 81/100
- State rank
- #97
- US rank
- #1491
Category grades
Schools grade is shown separately in the Schools card above.
Census & demographics
- Census place
- Columbus, OH
- County
- Franklin County · 1,351,780 people
- City population
- 612,189
- Metro
- Columbus, OH
- Population (ZIP)
- 47,364
- Household income
- $51,417
- Rent vs Own
- Severe rent burden
- 2584.0
Population outlook (Franklin County) Hauer SSP2
- Today (2025)
- 1,456,139 people
- By 2030
- 1,556,890 · +6.9%
- By 2040
- 1,757,349 · +20.7%
- By 2050
- 1,950,539 · +34.0%
- By 2075
- 2,376,171 · +63.2%
- By 2100
- 2,636,796 · +81.1%
Race, ethnicity, and origin ACS 2023
- Neighborhood character
- Diverse neighborhood (Simpson 0.58)
- Race & ethnicity
- Black 58% White 26% Hispanic / Latino 8% Two or more races 7% Asian 1%
- Hispanic origin (detail)
- Mexican 2% Puerto Rican 1% Dominican 1%
- Common ancestry
- Swiss 1% Slovak 1% Italian 1%
- Foreign-born
- 13% · Canada, China
- Languages at home
- 86% English-only · Spanish 6% French/Haitian/Cajun 1%
Political lean MEDSL · Franklin
- 2024 margin
- Strong D (+28.4) · D 63.7% · R 35.3% · Other 1.0%
- 2008→2024 swing
- +7.7pp toward D · 2008: 20.7pp · 2024: 28.4pp
- All cycles
- 2024: D+28.4 2020: D+31.4 2016: D+25.9 2012: D+21.7 2008: D+20.7
Not yet ingested
- Civics
- —
Market trends
- HPI YoY
- ▼ -203.49%
- Current HPI
- 249.3708
- Rent YoY
- ▲ 2.36%
- Metro
- Columbus, OH
- State GDP YoY
- ▲ 1.98%
- F500 in state
- 48
Industry mix (Fortune 500 HQ in OH)
| Industry | F500 HQs | Revenue |
|---|---|---|
| Insurance | 3 | $145B |
|
||
| Industrial Machinery | 3 | $49B |
|
||
| Financial Services | 3 | $24B |
|
||
| Consumer Goods | 2 | $93B |
|
||
| Aerospace / Defense | 2 | $47B |
|
||
| Utilities | 2 | $33B |
|
||
Price history
+401.0% since first listed14 events — show timeline
- 2026-05-28 Listed $209,900 CBRMLS
- 2026-05-14 Contingent — CBRMLS
- 2026-05-14 Listing Removed — CBRMLS
- 2026-05-02 Listed $220,000 CBRMLS
- 2026-04-29 Coming Soon — CBRMLS
- 2007-02-21 Listing Removed — CBRMLS
- 2006-08-20 Listed $110,000 CBRMLS
- 1999-05-23 Listing Removed — CBRMLS
- 1998-11-25 Listed $82,500 CBRMLS
- 1995-12-18 Sold (Public Records) $72,500 Public Records
- 1995-12-08 Sold (MLS) $72,500 CBRMLS
- 1995-11-07 Listing Removed — CBRMLS
- 1995-09-26 Listed $75,000 CBRMLS
- 1980-02-01 Sold (Public Records) $41,900 Public Records
Property tax history
+5.3%/yrLatest (2024): $2,867 · +1.3% YoY. Source: county tax records.
Cash-flow waterfall
monthlySold comps — $/sqft
last 12 mo · ≤1 miLoading sold comps…