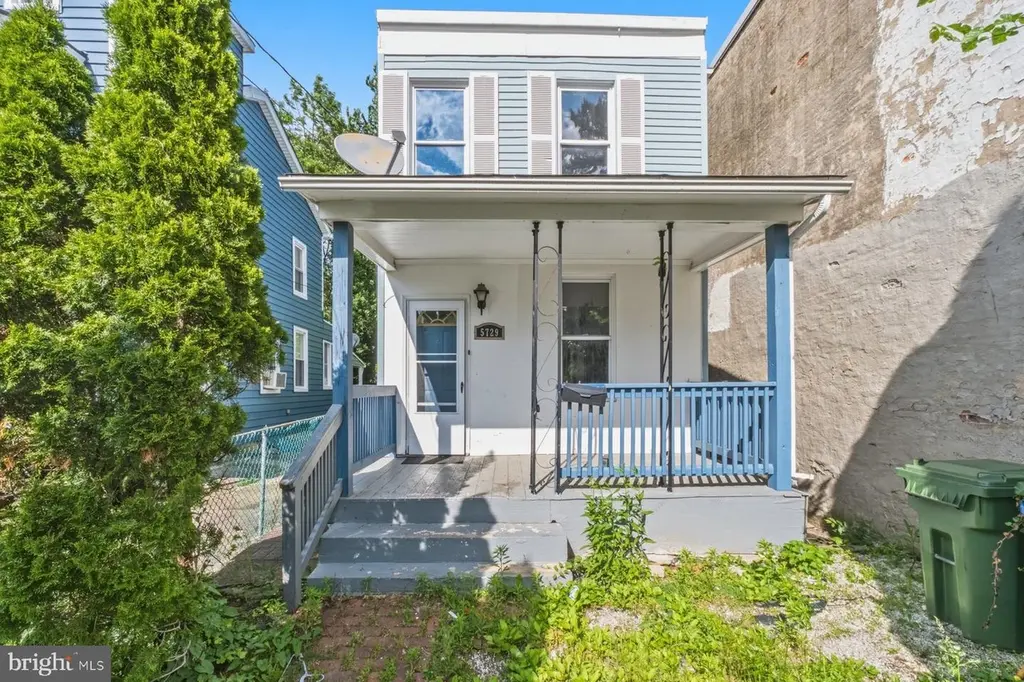
5729 Govane Ave · Baltimore, MD
Flood risk 1/10 · Minimal
- FEMA flood zone
- X (unshaded)
- Chance of flooding over 30 yrs
- 0.0%
- Est. flood insurance / yr
- $473 – $860
Fire risk 1/10 · Minimal
- Est. fire insurance / yr
- $755 – $1,403
Heat risk 7/10 · Major
- Hot days now (above 104°F)
- 7 days/yr
- Hot days in 30 yrs
- 14 days/yr
Wind risk 6/10 · Moderate
- Chance of severe wind over 30 yrs
- 27.0%
Air-quality risk 4/10 · Minor
- Unhealthy air days now
- 3 days/yr
- Unhealthy air days in 30 yrs
- 6 days/yr
Risk factors via First Street. Map © Google.
Why this score? — see what drove the B- grade
The composite is a weighted blend of 9 inputs, each scored 0–100. Each bar is that input's sub-score; the figure is the points it added to the 100-point composite (weight × sub-score).
- Cash flow +30.0/30.0
- 1% rule +10.0/10.0
- DSCR +10.0/10.0
- ARV discount +7.5/15.0
- Livability +3.8/5.0
- Rent growth +3.7/5.0
- Condition / age +2.5/5.0
- Schools +1.0/10.0
- Appreciation +0.0/10.0
$89,900
🖨 Deal sheet (PDF) 📄 Offer letter ✓ Due diligence
Listing remarks
This property is part of a larger portfolio. Please contact for more details regarding associated listings. Closings will need to be coordinated with the other properties in the portfolio but may sell to individual buyers. Seller will only accept offers from serious buyers who can align with that timeline.
Key facts
- 2,940 sq ft lot
- Built 1920
- Listed 19 days
Property features AI
Exterior
- Parking: Off-street parking
- Utilities: Public water; Public sewer; Electric for cooling
- Home design: Detached property; Finished and unfinished space both above and below grade
- Construction: Vinyl siding; Block foundation; Shingle/composite roof
- Exterior features: Not on tidal water; Above-grade and below-grade other structures
Interior
- Bedrooms: Three bedrooms on the first upper level
- Bathrooms: Two full bathrooms total (one on main level and one on first upper level)
- Heating & cooling: Forced air heating; Natural gas heating and hot water; Central air conditioning; Ceiling fans
- Interior features: Finished above-grade living area per assessor; Basement with connecting stairway; Portion of basement unfinished
Neighborhood map
What this means for you Summary
Snapshot
- This is a 3-bed/1.5-bath single-family listed at $90k.
Deal economics
- At list price, monthly cash flow is $812 ($10k/yr) — positive.
- The deal already cash-flows at list — no discount required.
- Meets the 1% rule at list price ($2k rent vs $90k).
- Recommended offer: $89k (1.5% below list) — sets the bar for market timing.
- Cap rate 17.1% vs local median 6.0% in Baltimore — top-decile yield for the area; either an underpriced asset or a hidden risk that comps aren't pricing in. Stress-test before assuming the spread holds.
Location & tenants
- Location reads 76/100 on livability (#90 in MD, #3,396 nationally) — a middle-class / working-renter tenant base. Strengths: amenities A+, commute A+, housing A+; Watch: crime F.
- Baltimore City Public Schools (urban): math 7% / reading 16% proficiency, ranked #24 of 24 in MD (top 100%) — low school quality limits family demand, transient renter base, plan for 1-2y turnover; 79% free/reduced lunch — lower-income household profile, screen leases tightly.
- Zoned schools: Elmer A. Henderson: A Johns Hopkins Partnership (math 2% / reading 16%, grade F, #650 of 860 statewide, top 77%, 642 students, 80% FRL); Vanguard Collegiate Middle (math 3% / reading 15%, grade F, #212 of 225 statewide, top 95%, 343 students, 84% FRL); Baltimore Polytechnic Institute (math 71% / reading 84%, grade A-, #22 of 222 statewide, top 10%, 1,555 students, 43% FRL).
- Zoned-school proficiency averages 32% at this address vs 12% district-wide (+20 pts) — the actual schools serving this property are materially stronger than the Baltimore City Public Schools average implies; a family-tenant draw the district grade alone would hide.
- Market conditions: Rents rising fast (+4.7%/yr); 136 active listings in the ZIP; 40 comparable units currently listed for rent nearby; rentals at typical pace (median 25d on market — plan ~3-4 weeks tenant-placement turnaround); 45% of comp listings sitting > 30 days — soft ceiling on asking rent; solid renter incomes; 1,273 units permitted in Baltimore city in 2024 (1,104 in 5+ unit buildings).
Forward outlook
- Local home prices are declining (-3.0%/yr); year-one equity from $622 of loan paydown is wiped out by about $3k of value loss. Plan a longer hold.
- Baltimore County population projected to shrink 4% by 2050 — rents likely to lag national; underwrite the cash flow, not the appreciation.
- At projected returns (-3.0% appreciation + 4.7% rent growth), your $25k cash investment doubles in ~3 years — after that, you're playing with house money.
Negotiation context
- It's been on market 20 days — a 2% lower offer ($89k) is reasonable based on typical stale-listing flexibility.
- 6 sale attempts since 19y ago; this cycle's ask has dropped $10k (10%) from the opening price — seller is motivated, your offer sets the floor, not the list.
Risks & watch-outs
- Watch-outs: property tax is 3.5% of price; built in 1920 — expect roof / HVAC / electrical / plumbing capex.
- Climate carrying-cost: major wind risk, 27% chance of damaging wind over 30y; extreme-heat days projected 7→14/yr by 2055 (HVAC capex compounding) — expect insurance premiums to compound above CPI over the hold.
Questions for the listing agent
- Built in 1920 — when were the roof, HVAC, electrical panel, plumbing, and water heater last replaced?
- Property tax is high relative to price — has the assessment been appealed recently, and will the sale trigger a re-assessment?
- Is there a deadline driving the sale (1031 exchange, divorce, estate, relocation)? That informs how much negotiation room exists.
- Schools are D-rated, which usually means shorter tenancies and higher turnover. Who's the typical renter profile here, and what's been the actual vacancy rate?
- Crime grade is F in this area — have there been break-ins, vandalism, or insurance claims at this property in the last 3 years? What carrier currently insures it and at what premium?
- What's the average days-on-market for RENTAL listings here right now (not sales)? A rising rental-DOM trend means longer vacancies and softer asking-rent achievability than the comps imply.
- What's the recent tenant-quality profile in this submarket — average credit score on applications, eviction rate, late-payment / NSF rate, and stable-employment percentage? A property-management company in the area should have these aggregated.
- How much new for-sale + rental construction is in the pipeline within 1–3 miles? Heavy new supply typically softens prices + rents 12–24 months out; constrained supply supports both.
Investment metrics
- 1% rule
- 2.23% ✓
- Cap rate
- 17.13%
- Cash-on-cash
- 38.69%
- DSCR
- 2.72
- GRM
- 3.7
CMA / ARV
- ARV (on-the-fly)
- $332,516
- Comps found
- 12
Show comp detail 12 sales within ~0.75 mi
| Address | Dist | Beds/Ba | Sqft | Sold | Price | $/sf | Match |
|---|---|---|---|---|---|---|---|
| 5728 Govane Ave | 0.02mi | 4/2.0 (+1) | 1,624 (-5%) | 2mo | $247,000 | $152 | 82 |
| 828 E Belvedere Ave | 0.30mi | 3/2.0 | 1,674 (-2%) | 0mo | $290,000 | $173 | 80 |
| 328 Paddington Rd | 0.38mi | 3/1.5 | 1,660 (-3%) | 2mo | $394,000 | $237 | 75 |
| 608 Harwood Ave | 0.18mi | 3/2.5 | 1,570 (-8%) | 2mo | $305,000 | $194 | 72 |
| 5802 Clearspring Rd | 0.08mi | 3/2.0 | 1,962 (+14%) | 2mo | $316,000 | $161 | 68 |
| 310 Thornhill Rd | 0.32mi | 3/2.0 | 1,892 (+10%) | 2mo | $660,000 | $349 | 64 |
| 325 Broadmoor Rd | 0.39mi | 3/3.0 | 1,850 (+8%) | 0mo | $580,000 | $314 | 62 |
| 442 Rosebank Ave | 0.29mi | 3/2.0 | 1,930 (+13%) | 3mo | $275,000 | $142 | 61 |
| 728 Highwood Dr | 0.72mi | 3/1.0 | 1,669 (-3%) | 1mo | $339,000 | $203 | 59 |
| 5302 Saint Georges Ave | 0.59mi | 3/3.0 | 1,840 (+7%) | 3mo | $180,000 | $98 | 51 |
| 5306 Kenilworth Ave | 0.64mi | 3/2.5 | 1,857 (+8%) | 5mo | $340,000 | $183 | 48 |
| 313 E Lake Ave | 0.63mi | 4/1.5 (+1) | 1,550 (-10%) | 3mo | $435,000 | $281 | 47 |
Match score weights: distance 35% · size 25% · config 20% · recency 20%. Top-matched comps best support the ARV.
Projected returns pro-forma
-3.0% appreciation · 4.65% rent growth · sell at horizon
- IRR
- 37.0%
- Equity multiple
- 2.61×
- Total profit
- $40,639
- Equity at exit
- $13,404
- IRR
- 44.5%
- Equity multiple
- 5.64×
- Total profit
- $116,838
- Equity at exit
- $7,773
Cash invested: $25,172 (down + closing). Projections, not guarantees.
Landlord ↔ Tenant lean methodology
- Overall (CITY)
- 12 Strongly Tenant-Friendly
- State Maryland
- 27 Tenant-Leaning · D+14
- County
- — inherits STATE
- City Baltimore
- 12 Strongly Tenant-Friendly · D+58
ZIP-level market 21212
- Rents YoY
- 4.7%
- Active inventory
- 136
- Price-to-rent
- 3.7×
Monthly cashflow live
- Estimated rent
- $2,008 high interval (Pro) →
- Mortgage (P&I)
- −$471
- Tax from tax record
- −$266 /mo · $3,188/yr
- Insurance
- −$37
- HOA
- −$0
- Vacancy / Maint / Mgmt
- −$422
- Net cashflow
- $812
Break-even live
Sensitivity live
| Price | -10% $863 | -5% $837 | +0% $812 | +5% $786 | +10% $761 |
|---|---|---|---|---|---|
| Rent | -10% $653 | -5% $732 | +0% $812 | +5% $891 | +10% $970 |
| Rate | -1.0pp $857 | -0.5pp $835 | base $812 | +0.5pp $788 | +1.0pp $765 |
UW: 25.0% down · 7.5% · 30yr · 1.5% tax · 5.0% vac · 8.0% maint · 8.0% mgmt
Financing live
Cash to close
- Down payment
- $22,475
- Closing costs
- $2,697
- Reserves months
- —
- Total cash needed
- —
Loan-product check · same deal, 3 products live
Conventional
25% down · 7.5% · 30yr
- Down + closing
- —
- Monthly P&I
- —
- Monthly cashflow
- —
- DSCR
- —
- Eligible?
- —
Personal DTI + credit; lowest rate.
DSCR
20% down · 8.5% · 30yr
- Down + closing
- —
- Monthly P&I
- —
- Monthly cashflow
- —
- DSCR
- —
- Eligible?
- —
No personal income docs; deal must DSCR.
Hard money
10% down · 12.0% · 12mo
- Down + closing
- —
- Monthly P&I
- —
- Monthly cashflow
- —
- DSCR
- —
- Eligible?
- —
Short-term bridge; refi at stabilization.
Rent comps 40 comps
| Address | Beds | Baths | Sqft | Rent | $/sqft | DOM | Units | Dist |
|---|---|---|---|---|---|---|---|---|
| 818 Bradhurst Rd Baltimore, MD | 2.0 | 1.0 | 1216 | $1,250 | $1.03 | 45d | 1 | 0.20mi |
| 818 Bradhurst Rd Baltimore, MD | 2.0 | 1.0 | 1216 | $1,350 | $1.11 | 5d | 1 | 0.20mi |
| 620 Harwood Ave Baltimore, MD | 2.0 | 1.0 | 2056 | $1,350 | $0.66 | 45d | 1 | 0.21mi |
| 828 Saint Dunstans Rd Baltimore, MD | 3.0 | 2.0 | 1544 | $2,000 | $1.30 | 25d | 1 | 0.31mi |
| 917 Reverdy Rd Unit A Baltimore, MD | 3.0 | 1.0 | 1200 | $2,100 | $1.75 | 45d | 1 | 0.39mi |
| 5626 Midwood Ave Unit 2 Baltimore, MD | 2.0 | 1.0 | 1452 | $1,100 | $0.76 | 25d | 1 | 0.40mi |
| 5622 Midwood Ave Baltimore, MD | 3.0 | 2.0 | 1452 | $2,300 | $1.58 | 45d | 1 | 0.41mi |
| 5307 York Rd Baltimore, MD | 2.0 | 1.0 | 1120 | $1,200 | $1.07 | 45d | 1 | 0.41mi |
| 6008 Clearspring Rd Baltimore, MD | 4.0 | 2.5 | 1758 | $3,600 | $2.05 | 25d | 1 | 0.45mi |
| 5200 Ready Ave Baltimore, MD | 3.0 | 1.5 | 1116 | $1,950 | $1.75 | 5d | 1 | 0.47mi |
| 1008 Tunbridge Rd Baltimore, MD | 3.0 | 2.0 | 1732 | $2,050 | $1.18 | 25d | 1 | 0.49mi |
| 1020 Dartmouth Glen Way Baltimore, MD | 3.0 | 2.5 | 1152 | $2,250 | $1.95 | 25d | 1 | 0.54mi |
| 711 1/2 McCabe Ave Baltimore, MD | 4.0 | 3.0 | 1204 | $2,350 | $1.95 | 6d | 1 | 0.55mi |
| 543 Chateau Ave Baltimore, MD | 3.0 | 2.0 | 1152 | $1,900 | $1.65 | 6d | 1 | 0.65mi |
| 510 Winston Ave Baltimore, MD | 4.0 | 2.0 | 1600 | $2,800 | $1.75 | 21d | 1 | 0.67mi |
| 1106 Gleneagle Rd Unit 2 Baltimore, MD | 2.0 | 1.0 | 1100 | $1,450 | $1.32 | 45d | 1 | 0.70mi |
| 1111 Gleneagle Rd Unit 2 Baltimore, MD | 2.0 | 1.0 | 1452 | $1,050 | $0.72 | 45d | 1 | 0.71mi |
| 6159 Parkway Dr Baltimore, MD | 4.0 | 2.0 | 1408 | $2,200 | $1.56 | 23d | 1 | 0.73mi |
| 6159 Parkway Dr Apt 1 Baltimore, MD | 4.0 | 2.0 | 1408 | $2,200 | $1.56 | 25d | 1 | 0.73mi |
| 1221 Glenwood Ave Baltimore, MD | 3.0 | 2.0 | 1390 | $2,595 | $1.87 | 45d | 1 | 0.78mi |
| 1104 Meridene Dr Unit 1 Baltimore, MD | 2.0 | 1.0 | 1098 | $1,350 | $1.23 | 45d | 1 | 0.79mi |
| 100 E Melrose Ave Baltimore, MD | 2.0–3.0 | 2.0–2.5 | 1750 | $3,345 | $1.91 | 6d | 2 | 0.80mi |
| 6189 Northwood Dr Baltimore, MD | 4.0 | 2.0 | 1400 | $2,200 | $1.57 | 45d | 1 | 0.82mi |
| 514 Radnor Ave Baltimore, MD | 3.0 | 1.5 | 1575 | $1,500 | $0.95 | 46d | 1 | 0.83mi |
| 5520 Sagra Rd Baltimore, MD | 3.0 | 1.5 | 1650 | $1,900 | $1.15 | 45d | 1 | 0.85mi |
| 804 Radnor Ave Baltimore, MD | 3.0 | 1.0 | 1654 | $2,000 | $1.21 | 45d | 1 | 0.89mi |
| 6149 Dunroming Rd Baltimore, MD | 3.0 | 1.5 | 1400 | $1,895 | $1.35 | 12d | 1 | 0.90mi |
| 1224 Winston Ave Baltimore, MD | 3.0 | 2.0 | 1248 | $2,100 | $1.68 | 19d | 1 | 0.91mi |
| 4754 Alhambra Ave Baltimore, MD | 3.0 | 2.0 | 1876 | $1,500 | $0.80 | 25d | 1 | 0.94mi |
| 5204 Kelway Rd Baltimore, MD | 3.0 | 2.0 | 1666 | $2,350 | $1.41 | 25d | 1 | 0.95mi |
| 531 Willow Ave Unit Na Baltimore, MD | 4.0 | 1.0 | 1300 | $1,800 | $1.38 | 21d | 1 | 1.05mi |
| 4407 Old York Rd Baltimore, MD | 3.0 | 1.5 | 1356 | $1,574 | $1.16 | 21d | 1 | 1.12mi |
| 4407 Old York Rd Baltimore, MD | 3.0 | 1.5 | 1356 | $1,574 | $1.16 | 45d | 1 | 1.12mi |
| 214 Overbrook Rd Baltimore, MD | 3.0 | 2.0 | 1896 | $2,900 | $1.53 | 5d | 1 | 1.15mi |
| 1508 Gleneagle Rd Baltimore, MD | 3.0 | 2.0 | 1824 | $2,180 | $1.20 | 6d | 1 | 1.18mi |
| 706 E 43rd St Baltimore, MD | 4.0 | 1.5 | 1596 | $1,899 | $1.19 | 3d | 1 | 1.24mi |
| 720 Springfield Ave Baltimore, MD | 3.0 | 1.0 | 1160 | $2,000 | $1.72 | 45d | 1 | 1.28mi |
| 4303 York Rd #3 Baltimore, MD | 2.0 | 1.0 | 1680 | $1,400 | $0.83 | 45d | 1 | 1.30mi |
| 1444 Meridene Dr Baltimore, MD | 3.0 | 1.5 | 1520 | $1,950 | $1.28 | 45d | 1 | 1.34mi |
| 1545 E Cold Spring Ln Baltimore, MD | 4.0 | 2.0 | 1240 | $2,000 | $1.61 | 45d | 1 | 1.39mi |
Listing history 13 events
-
2026-06-21days on market $89,900 Active 20 DOM
-
2026-06-18days on market $89,900 Active 17 DOM
-
2026-06-17days on market $89,900 Active 16 DOM
-
2026-06-16days on market $89,900 Active 15 DOM
-
2026-06-15days on market $89,900 Active 14 DOM
-
2026-06-13pricedays on market $89,900 Active 12 DOM
-
2026-06-09days on market $99,900 Active 8 DOM
-
2026-06-08days on market $99,900 Active 7 DOM
-
2026-06-07days on market $99,900 Active 6 DOM
-
2026-06-04days on market $99,900 Active 3 DOM
-
2026-06-03days on market $99,900 Active 2 DOM
-
2026-06-02remarks 307-char remark
-
2026-06-02$99,900 Active 1 DOM
ⓘ Source: listings_history table (triggers on properties + properties_extension) + one-shot
backfill from property_details.listing_events for pre-trigger history.
Tax reassessment forecast MD · Partial reset (capped growth)
- Current annual tax
- $3,188 · $266/mo
- Projected year-2 tax
- $3,188 · $266/mo
- Expected delta
- $0/yr ($0/mo · 0.0%)
ⓘ Screening estimate from a state-policy table — verify with the county assessor before closing.
Climate risk First Street
- Flood 1/10 Low FEMA zone X (unshaded) · 0% chance over 30 yrs
- Wildfire 1/10 Low
- Heat 7/10 Severe 7 d/yr ≥104°F today · 14 d/yr by 30 yrs out
- Wind 6/10 Major 27% chance of damaging wind over 30 yrs
- Air quality 4/10 Moderate 3 unhealthy d/yr today · 6 by 30 yrs out
Nearby sold comps map
Loading sold comps map…
Walkable amenities ~0.75 mi
Loading nearby amenities…
Taxation est. · year 1
- Rental income
- $24,095
- − Mortgage interest
- −$5,036
- − Property taxes
- −$3,188
- − Insurance
- −$450
- − Repairs & maintenance
- −$1,928
- − Management
- −$1,928
- − Depreciation
- −$2,615
- Taxable income
- $8,951
- Est. tax owed @ 24.0%
- −$2,148
- After-tax cash flow
- $7,592/yr
For passive investors: Depreciation is non-cash, so a rental often shows a tax loss while cash-flowing — sheltering income. Rental losses are passive: they offset passive income freely, and up to $25,000/yr can offset ordinary (W-2) income if you actively participate and your MAGI is under $100k (phasing out to $0 by $150k); unused losses carry forward. On sale, claimed depreciation is recaptured at up to 25%, and gains may owe capital-gains tax (a 1031 exchange can defer both). Figures are a year-1 estimate at your 24.0% rate — not tax advice; consult a CPA.
Schools (NCES district)
- District
- Baltimore City Public Schools
- NCES district ID
- 2400090
- Math proficiency
- 7% ▼ -9.00%
- Reading proficiency
- 16% ▼ -5.00%
- Median HH income
- $42,108
- Composite
- 10.08/100
- National rank
- #9805
- State rank
- #24 of 24 in MD
Livability — Baltimore
- Score
- 76/100
- State rank
- #90
- US rank
- #3396
Category grades
Schools grade is shown separately in the Schools card above.
Census & demographics
- Census place
- Baltimore, MD
- County
- Baltimore City · 558,601 people
- City population
- 588,727
- Metro
- Baltimore-Columbia-Towson, MD
- Population (ZIP)
- 33,974
- Household income
- $96,685
- Rent vs Own
- Severe rent burden
- 769.0
Population outlook (Baltimore County) Hauer SSP2
- Today (2025)
- 624,249 people
- By 2030
- 621,541 · -0.4%
- By 2040
- 609,756 · -2.3%
- By 2050
- 597,249 · -4.3%
- By 2075
- 552,236 · -11.5%
- By 2100
- 513,934 · -17.7%
Race, ethnicity, and origin ACS 2023
- Neighborhood character
- Diverse neighborhood (Simpson 0.64)
- Race & ethnicity
- White 49% Black 35% Two or more races 9% Hispanic / Latino 7% Asian 4%
- Hispanic origin (detail)
- Mexican 1% Puerto Rican 1%
- Common ancestry
- Romanian 3% Italian 2% Slovak 2%
- Foreign-born
- 9% · Canada, China
- Languages at home
- 87% English-only · Spanish 5% Other Indo-European 2% French/Haitian/Cajun 1%
Political lean MEDSL · Baltimore
- 2024 margin
- Solid D (+73.0) · D 85.2% · R 12.2% · Other 2.6%
- 2008→2024 swing
- -2.5pp toward R · 2008: 75.5pp · 2024: 73.0pp
- All cycles
- 2024: D+73.0 2020: D+76.6 2016: D+74.6 2012: D+76.4 2008: D+75.5
Not yet ingested
- Civics
- —
Market trends
- HPI YoY
- ▼ -392.44%
- Current HPI
- 267.4569
- Rent YoY
- ▲ 4.65%
- Metro
- Baltimore-Columbia-Towson, MD
- State GDP YoY
- ▲ 2.97%
- F500 in state
- 12
Industry mix (Fortune 500 HQ in MD)
| Industry | F500 HQs | Revenue |
|---|---|---|
| Aerospace / Defense | 1 | $71B |
|
||
| Utilities | 1 | $25B |
|
||
| Hotels | 1 | $24B |
|
||
| Consumer Goods | 1 | $7B |
|
||
| Real Estate | 1 | $6B |
|
||
| Chemicals | 1 | $2B |
|
||
Price history
+42.7% since first listed15 events — show timeline
- 2026-06-01 Listed $99,900 BRIGHT MLS
- 2023-06-19 Rental Removed — TURBOTENANT
- 2018-03-01 Sold (Public Records) $4,552,396 Public Records
- 2015-11-25 Listing Removed — BRIGHT MLS
- 2015-11-25 Delisted — MRIS
- 2015-06-24 Listed — MRIS
- 2015-06-24 Listed $129,000 BRIGHT MLS
- 2008-11-25 Delisted — MRIS
- 2008-11-24 Relisted — MRIS
- 2008-11-01 Delisted — MRIS
- 2008-10-10 Price Changed — MRIS
- 2008-07-22 Listed — MRIS
- 2008-02-15 Delisted — MRIS
- 2007-11-16 Listed — MRIS
- 2007-08-17 Sold (Public Records) $70,000 Public Records
Property tax history
+1.3%/yrLatest (2025): $3,188 · +6.1% YoY. Source: county tax records.
Cash-flow waterfall
monthlySold comps — $/sqft
last 12 mo · ≤1 miLoading sold comps…