 Duplex
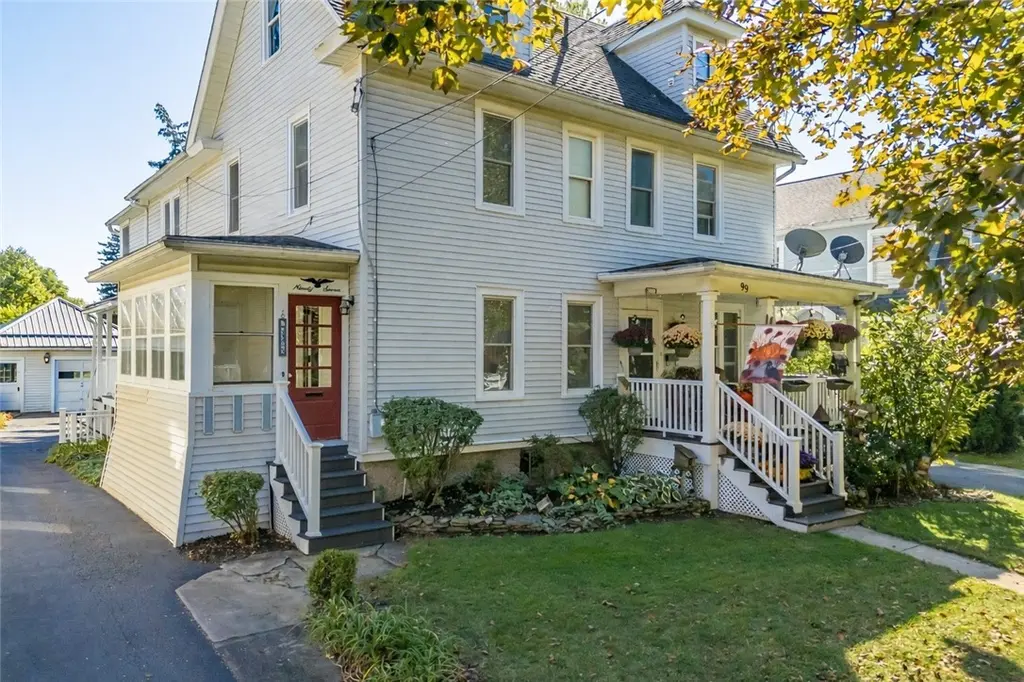
97-99 Park Ave · Canandaigua, NY
Flood risk 1/10 · Minimal
- FEMA flood zone
- X
- Chance of flooding over 30 yrs
- 0.0%
- Est. flood insurance / yr
- $473 – $860
Fire risk 1/10 · Minimal
- Est. fire insurance / yr
- $691 – $1,283
Heat risk 2/10 · Minimal
- Hot days now (above 96°F)
- 7 days/yr
- Hot days in 30 yrs
- 16 days/yr
Wind risk 1/10 · Minimal
- Chance of severe wind over 30 yrs
- —
Air-quality risk 2/10 · Minimal
- Unhealthy air days now
- 0 days/yr
- Unhealthy air days in 30 yrs
- 1 days/yr
Risk factors via First Street. Map © Google.
Why this score? — see what drove the B- grade
The composite is a weighted blend of 9 inputs, each scored 0–100. Each bar is that input's sub-score; the figure is the points it added to the 100-point composite (weight × sub-score).
- Cash flow +25.5/30.0
- ARV discount +10.6/15.0
- DSCR +8.4/10.0
- 1% rule +6.7/10.0
- Schools +4.7/10.0
- Rent growth +4.6/5.0
- Livability +3.8/5.0
- Condition / age +2.2/5.0
- Appreciation +0.0/10.0
$384,900
🖨 Deal sheet (PDF) 📄 Offer letter ✓ Due diligence
Multi-family units
County records classify this as Multi-Family (2-4 Unit). Listing-text estimate: 2 units. confirmed
Listing remarks
AMAZING & RARE SIDE-BY-SIDE TWO-FAMILY ON PRIME PARK AVENUE IN THE CITY OF CANANDAIGUA! LOCATION! LOCATION! LOCATION! WALK TO EVERYTHING THE CITY OF CANANDAIGUA HAS TO OFFER, INCLUDING OUTSTANDING RESTAURANTS, BOUTIQUE SHOPS, ART GALLERIES, THE CMAC ENTERTAINMENT VENUE, AND KERSHAW PARK ON CANANDAIGUA LAKE. “PICTURE PERFECT” ARCHITECTURE INSIDE AND OUT — ABSOLUTELY BEAUTIFUL, IMMACULATE, AND TRULY TURN-KEY… READY TO MOVE RIGHT IN! MINT CONDITION! RARE INVESTMENT OPPORTUNITY: RENT OUT BOTH UNITS OR LIVE IN ONE AND RENT OUT THE OTHER. UNIT 97 FEATURES A COVERED AND ENCLOSED ENTRY PORCH, SPACIOUS LIVING ROOM, EXPANSIVE FAMILY ROOM WITH BRICK FIREPLACE OPEN TO THE
Key facts
- Prime park avenue
- Brick fireplace
- Excellent storage
Tags
Property features AI
Finance
- Other: Operating expense details: See remarks
- Financial info: Two-unit property with separate gas and electric meters for each unit; Tenant pays all utilities
Exterior
- Parking: Garage (1 space); Paved parking; Multiple parking spaces available
- Utilities: Cable available; High-speed internet available; Sewer connected; Public water available; Circuit breaker electric
- Home design: 2 stories; Existing construction
- Construction: Vinyl siding; Copper plumbing; Asphalt and metal roof; Block and poured foundation
- Exterior features: Deck; Porch; Partial fencing; Private yard; Rectangular residential lot; City street frontage; See remarks
Interior
- Kitchen: Oven/Range; Refrigerator; Dishwasher
- Bedrooms: One unit with 3 bedrooms; One unit with 4 bedrooms
- Flooring: Carpet; Ceramic tile; Hardwood; Tile; Varies
- Bathrooms: Two full bathrooms (total) across units; Two half bathrooms (total) across units
- Heating & cooling: Gas forced-air heating
- Interior features: Thermal windows; Ceiling fan(s)
- Laundry & utility: Gas water heater
Neighborhood map
What this means for you Summary
Snapshot
- This is a 2 × 4-bed/1.5-bath units multifamily listed at $385k. Condition is rated fair.
Deal economics
- At list price, monthly cash flow is $894 ($11k/yr) — positive. Per door: $447/mo.
- The deal already cash-flows at list — no discount required.
- Meets the 1% rule at list price ($4k rent vs $385k).
- Recommended offer: $379k (1.5% below list) — sets the bar for market timing.
- Cap rate 9.1% vs local median 3.4% in Canandaigua — top-decile yield for the area; either an underpriced asset or a hidden risk that comps aren't pricing in. Stress-test before assuming the spread holds.
Location & tenants
- Location reads 75/100 on livability (#243 in NY, #3,822 nationally) — a middle-class / working-renter tenant base. Strengths: commute A+, housing A+, schools B+; Watch: employment C-, amenities F, health & safety D-.
- Canandaigua City School District (suburban): math 50% / reading 59% proficiency, ranked #305 of 590 in NY (top 52%) — acceptable for families but not a draw, mixed tenant base, ~2y average lease.
- Market conditions: Rents rising fast (+8.5%/yr); 223 active listings in the ZIP; solid renter incomes; 284 units permitted in Ontario County in 2024 (69 in 5+ unit buildings).
- At $4,499/mo this rent would consume 68% of the median local household income ($80k/yr) (locally 737% of renters already pay >50% of income on rent) — very limited rent-growth headroom before tenants either downsize or default.
Forward outlook
- Local home prices are declining (-3.0%/yr); year-one equity from $3k of loan paydown is wiped out by about $12k of value loss. Plan a longer hold.
- Ontario County population projected to shrink 6% by 2050 — rents likely to lag national; underwrite the cash flow, not the appreciation.
- At projected returns (-3.0% appreciation + 8.0% rent growth), your $108k cash investment doubles in ~8 years — after that, you're playing with house money.
Negotiation context
- It's been on market 28 days — a 2% lower offer ($379k) is reasonable based on typical stale-listing flexibility.
- 3 sale attempts with the ask held roughly flat each time — persistent listings suggest the price (not the market) is what's stuck; bring a comps-based counter.
Risks & watch-outs
- Watch-outs: built in 1905 — expect roof / HVAC / electrical / plumbing capex.
Questions for the listing agent
- Can we see the unit-by-unit rent roll, current vacancy, and any below-market leases? What's the average tenancy length?
- What capital expenditures (roof, boiler, parking lot, exteriors) have been made in the last 5 years, and what's planned in the next 2?
- Have any recent inspections been done? Can we get a copy of the seller's disclosures and any deferred-maintenance estimates?
- Built in 1905 — when were the roof, HVAC, electrical panel, plumbing, and water heater last replaced?
- Is there a deadline driving the sale (1031 exchange, divorce, estate, relocation)? That informs how much negotiation room exists.
- Schools are B-rated — typically a magnet for longer-tenancy family renters. What's the average tenant stay here, and is there a school-zone premium baked into asking?
- What's the average days-on-market for RENTAL listings here right now (not sales)? A rising rental-DOM trend means longer vacancies and softer asking-rent achievability than the comps imply.
- What's the recent tenant-quality profile in this submarket — average credit score on applications, eviction rate, late-payment / NSF rate, and stable-employment percentage? A property-management company in the area should have these aggregated.
- How much new apartment / multifamily construction is in the pipeline within 1–3 miles? Heavy new supply (>2% of stock underway) typically softens rents 12–24 months out; light construction supports rent growth.
Investment metrics
- 1% rule
- 1.17% ✓
- Cap rate
- 9.08%
- Cash-on-cash
- 9.96%
- DSCR
- 1.44
- GRM
- 7.1
CMA / ARV
- ARV (median comp)
- $413,146
- List price
- $384,900
- Delta
- -6.84%
- Verdict
- FAIR
- Comps
- 20 within 1.0 mi
Projected returns pro-forma
-3.0% appreciation · 8.0% rent growth · sell at horizon
- IRR
- 4.2%
- Equity multiple
- 1.17×
- Total profit
- $18,429
- Equity at exit
- $57,390
- IRR
- 17.9%
- Equity multiple
- 2.84×
- Total profit
- $197,878
- Equity at exit
- $33,279
Cash invested: $107,772 (down + closing). Projections, not guarantees.
Landlord ↔ Tenant lean methodology
- Overall (STATE)
- 15 Strongly Tenant-Friendly
- State New York
- 15 Strongly Tenant-Friendly · D+10
- County
- — inherits STATE
- City
- — inherits STATE
ZIP-level market 14424
- Home prices YoY
- -21.2%
- Rents YoY
- 8.5%
- Active inventory
- 223
- Price-to-rent
- 14.3×
Monthly cashflow live
- Estimated rent
- $4,499 medium interval (Pro) →
- Mortgage (P&I)
- −$2,018
- Tax est. 1.5%
- −$481 /mo · $5,774/yr
- Insurance
- −$160
- HOA
- −$0
- Vacancy / Maint / Mgmt
- −$945
- Net cashflow
- $894
Break-even live
Sensitivity live
| Price | -10% $1,160 | -5% $1,027 | +0% $894 | +5% $761 | +10% $628 |
|---|---|---|---|---|---|
| Rent | -10% $539 | -5% $717 | +0% $894 | +5% $1,072 | +10% $1,250 |
| Rate | -1.0pp $1,088 | -0.5pp $992 | base $894 | +0.5pp $795 | +1.0pp $693 |
2-unit breakdown (identical units grouped — click to expand)
| Units | Beds | Baths | Est. rent |
|---|---|---|---|
| 2× units | 4 | 1.5 | $4,498 |
| #1 | 4 | 1.5 | $2,249 |
| #2 | 4 | 1.5 | $2,249 |
| Total (2 units) | $4,499 | ||
UW: 25.0% down · 7.5% · 30yr · 1.5% tax · 5.0% vac · 8.0% maint · 8.0% mgmt
Financing live
Cash to close
- Down payment
- $96,225
- Closing costs
- $11,547
- Reserves months
- —
- Total cash needed
- —
Loan-product check · same deal, 3 products live
Conventional
25% down · 7.5% · 30yr
- Down + closing
- —
- Monthly P&I
- —
- Monthly cashflow
- —
- DSCR
- —
- Eligible?
- —
Personal DTI + credit; lowest rate.
DSCR
20% down · 8.5% · 30yr
- Down + closing
- —
- Monthly P&I
- —
- Monthly cashflow
- —
- DSCR
- —
- Eligible?
- —
No personal income docs; deal must DSCR.
Hard money
10% down · 12.0% · 12mo
- Down + closing
- —
- Monthly P&I
- —
- Monthly cashflow
- —
- DSCR
- —
- Eligible?
- —
Short-term bridge; refi at stabilization.
Listing history 14 events
-
2026-06-13status $384,900 Pending 28 DOM
-
2026-06-10days on market $384,900 Active 28 DOM
-
2026-06-09days on market $384,900 Active 27 DOM
-
2026-06-09days on market $384,900 Active 26 DOM
-
2026-06-07days on market $384,900 Active 25 DOM
-
2026-06-03days on market $384,900 Active 21 DOM
-
2026-06-03days on market $384,900 Active 20 DOM
-
2026-06-01days on market $384,900 Active 19 DOM
-
2026-05-31days on market $384,900 Active 18 DOM
-
2026-05-13historical
-
2026-05-13$384,900 Active 1554-char remark
-
2026-04-17status Active
-
2026-03-12historical Active Under Contract
-
2026-02-25$399,900 Active
ⓘ Source: listings_history table (triggers on properties + properties_extension) + one-shot
backfill from property_details.listing_events for pre-trigger history.
Climate risk First Street
- Flood 1/10 Low FEMA zone X · 0% chance over 30 yrs
- Wildfire 1/10 Low
- Heat 2/10 Low 7 d/yr ≥96°F today · 16 d/yr by 30 yrs out
- Wind 1/10 Low
- Air quality 2/10 Low 0 unhealthy d/yr today · 1 by 30 yrs out
Nearby sold comps map
Loading sold comps map…
Walkable amenities ~0.75 mi
Loading nearby amenities…
Taxation est. · year 1
- Rental income
- $53,988
- − Mortgage interest
- −$21,560
- − Property taxes
- −$5,774
- − Insurance
- −$1,924
- − Repairs & maintenance
- −$4,319
- − Management
- −$4,319
- − Depreciation
- −$11,197
- Taxable income
- $4,894
- Est. tax owed @ 24.0%
- −$1,175
- After-tax cash flow
- $9,556/yr
For passive investors: Depreciation is non-cash, so a rental often shows a tax loss while cash-flowing — sheltering income. Rental losses are passive: they offset passive income freely, and up to $25,000/yr can offset ordinary (W-2) income if you actively participate and your MAGI is under $100k (phasing out to $0 by $150k); unused losses carry forward. On sale, claimed depreciation is recaptured at up to 25%, and gains may owe capital-gains tax (a 1031 exchange can defer both). Figures are a year-1 estimate at your 24.0% rate — not tax advice; consult a CPA.
Condition & rehab AI · 1 photo
This two-family home requires moderate renovations, including painting, flooring replacement, and kitchen/bathroom repairs. It offers a rare investment opportunity in a prime location.
Repairs flagged
- Major kitchen — No photos of kitchen
- Major bathrooms — No photos of bathrooms
- Major interior walls/paint — No photos of interior walls/paint
- Major HVAC/mechanicals — No photos of HVAC/mechanicals
Value-add opportunities
- Both paint interior walls — Fresh paint enhances curb appeal and interior aesthetics
- Both replace flooring — New flooring improves comfort and appearance
- Both repair kitchen and bathrooms — Renovated kitchens and bathrooms attract more buyers and renters
Renovation cost estimate screening
| Repair item | Severity | Est. cost |
|---|---|---|
| kitchen · No photos of kitchen | Major | $15,000–50,000 |
| bathrooms · No photos of bathrooms | Major | $15,000–50,000 |
| interior walls/paint · No photos of interior walls/paint | Major | $15,000–50,000 |
| HVAC/mechanicals · No photos of HVAC/mechanicals | Major | $15,000–50,000 |
| Total estimated repair cost · 4 items | $60,000–200,000 |
Value-add ROI direction
- Both paint interior walls — Fresh paint enhances curb appeal and interior aesthetics ↑
- Both replace flooring — New flooring improves comfort and appearance ↑
- Both repair kitchen and bathrooms — Renovated kitchens and bathrooms attract more buyers and renters ↑
ⓘ Cost ranges are severity-bucket heuristics (US national rule-of-thumb). Get contractor quotes + a written scope before underwriting a rehab budget.
Schools (NCES district)
- District
- Canandaigua City School District
- NCES district ID
- 3606330
- Math proficiency
- 50% ▼ -10.00%
- Reading proficiency
- 59% ▲ 4.00%
- Median HH income
- $56,375
- Composite
- 47.09/100
- National rank
- #2335
- State rank
- #305 of 590 in NY
Livability — Canandaigua
- Score
- 75/100
- State rank
- #243
- US rank
- #3822
Category grades
Schools grade is shown separately in the Schools card above.
Census & demographics
- Census place
- Canandaigua, NY
- County
- Ontario County · 58,989 people
- City population
- 28,786
- Metro
- Rochester, NY
- Population (ZIP)
- 28,786
- Household income
- $79,778
- Rent vs Own
- Severe rent burden
- 737.0
Population outlook (Ontario County) Hauer SSP2
- Today (2025)
- 111,230 people
- By 2030
- 111,401 · +0.2%
- By 2040
- 109,535 · -1.5%
- By 2050
- 104,895 · -5.7%
- By 2075
- 92,999 · -16.4%
- By 2100
- 73,723 · -33.7%
Race, ethnicity, and origin ACS 2023
- Neighborhood character
- Predominantly White (90%)
- Race & ethnicity
- White 90% Hispanic / Latino 5% Two or more races 5% Black 1%
- Common ancestry
- Romanian 4% Iranian 4% Slovak 3%
- Foreign-born
- 3% · Canada
- Languages at home
- 94% English-only · Spanish 3% German/W. Germanic 1% Arabic 1%
Political lean MEDSL · Ontario
- 2024 margin
- Toss-up / Even · D 49.4% · R 50.6%
- 2008→2024 swing
- -1.0pp toward R · 2008: -0.1pp · 2024: -1.2pp
- All cycles
- 2024: R+1.2 2020: R+0.0 2016: R+8.6 2012: R+1.6 2008: R+0.1
Not yet ingested
- Civics
- —
Market trends
- HPI YoY
- ▼ -70.94%
- Current HPI
- 263.755
- Rent YoY
- ▲ 8.46%
- Metro
- Rochester, NY
- State GDP YoY
- ▲ 2.60%
- F500 in state
- 92
Industry mix (Fortune 500 HQ in NY)
| Industry | F500 HQs | Revenue |
|---|---|---|
| Financial Services | 10 | $950B |
|
||
| Consumer Goods | 9 | $162B |
|
||
| Insurance | 4 | $225B |
|
||
| Telecommunications | 2 | $144B |
|
||
| Pharmaceuticals | 2 | $112B |
|
||
| Media / Entertainment | 2 | $69B |
|
||
Price history
-3.8% since first listed6 events — show timeline
- 2026-06-10 Pending — UNYREIS
- 2026-05-13 Listing Removed — UNYREIS
- 2026-05-13 Listed $384,900 UNYREIS
- 2026-04-17 Relisted — UNYREIS
- 2026-03-12 Contingent — UNYREIS
- 2026-02-25 Listed $399,900 UNYREIS
Cash-flow waterfall
monthlySold comps — $/sqft
last 12 mo · ≤1 miLoading sold comps…