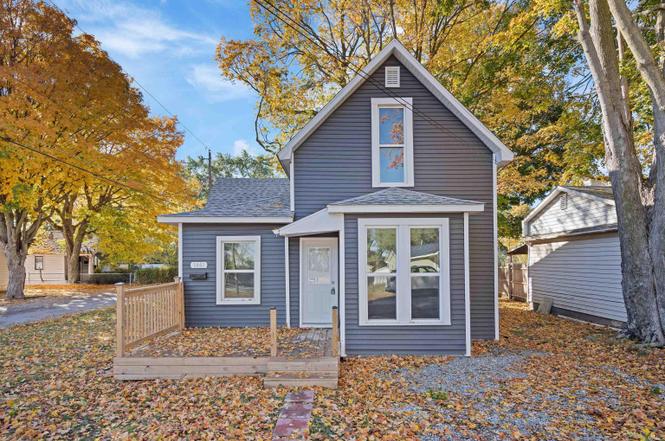
1441 E Monroe St · Kokomo, IN
Flood risk 1/10 · Minimal
- FEMA flood zone
- X (unshaded)
- Chance of flooding over 30 yrs
- 0.0%
- Est. flood insurance / yr
- $507 – $1,088
Fire risk 1/10 · Minimal
- Est. fire insurance / yr
- $717 – $1,331
Heat risk 3/10 · Minor
- Hot days now (above 101°F)
- 7 days/yr
- Hot days in 30 yrs
- 17 days/yr
Wind risk 2/10 · Minimal
- Chance of severe wind over 30 yrs
- —
Air-quality risk 3/10 · Minor
- Unhealthy air days now
- 2 days/yr
- Unhealthy air days in 30 yrs
- 3 days/yr
Risk factors via First Street. Map © Google.
Why this score? — see what drove the C grade
The composite is a weighted blend of 9 inputs, each scored 0–100. Each bar is that input's sub-score; the figure is the points it added to the 100-point composite (weight × sub-score).
- Cash flow +23.4/30.0
- ARV discount +13.2/15.0
- DSCR +7.5/10.0
- 1% rule +4.8/10.0
- Livability +3.4/5.0
- Condition / age +2.5/5.0
- Rent growth +2.1/5.0
- Schools +2.1/10.0
- Appreciation +0.0/10.0
$133,900
🖨 Deal sheet (PDF) 📄 Offer letter ✓ Due diligence
Listing remarks
Step inside this beautifully remodeled 3-bedroom, 1-bath home that’s LIKE NEW from top to bottom! Every inch has been updated—inside and out. The exterior features a brand-new roof, all new windows, aluminum wrap, vinyl siding, and a welcoming front deck. Inside, enjoy new modern vinyl plank flooring throughout, fresh paint, new doors and trim, and a stunning all-new kitchen with a farmhouse sink. Enjoy the large, renovated bathroom! Comfort meets efficiency with new insulation, electrical and plumbing, along with a new furnace, central air and ductwork (with warranty). Move-in ready and built to last, this home is a must-see! Seller is licensed real estate agent.
Key facts
- Front deck
- Vinyl siding
- New roof
Tags
Property features AI
Finance
- Other: Taxes listed (amount not included per instructions)
Exterior
- Parking: Gravel parking
- Utilities: Public water; Public sewer
- Home design: Single-family site-built home; One story
- Construction: Vinyl siding; Asphalt shingle roof; Crawl space foundation; Built as a site-built home
- Exterior features: Deck; Porch; Level lot
Interior
- Kitchen: Microwave
- Bedrooms: 6 total rooms
- Flooring: Vinyl flooring
- Bathrooms: 1 full bathroom (main level)
- Heating & cooling: Natural gas forced-air heating; Central air conditioning; Ceiling fan cooling
- Interior features: Ceiling fans
- Laundry & utility: Laundry on main level; Gas water heater
Neighborhood map
What this means for you Summary
Snapshot
- This is a 3-bed/1.0-bath single-family listed at $134k.
Deal economics
- At list price, monthly cash flow is $249 ($3k/yr) — positive.
- The deal already cash-flows at list — no discount required.
- To meet the 1% rule (rent ≥ 1% of price), the offer needs to be $132k (1.6% below list).
- Recommended offer: $118k (12.0% below list) — sets the bar for market timing.
- Cap rate 8.5% vs local median 5.2% in Kokomo — top-decile yield for the area; either an underpriced asset or a hidden risk that comps aren't pricing in. Stress-test before assuming the spread holds.
Location & tenants
- Location reads 68/100 on livability (#227 in IN) — a middle-class / working-renter tenant base. Strengths: cost of living A+, housing A+, health & safety A; Watch: crime D, amenities F, commute F.
- Kokomo School Corporation (urban): math 22% / reading 30% proficiency, ranked #264 of 301 in IN (top 88%) — low school quality limits family demand, transient renter base, plan for 1-2y turnover; 62% free/reduced lunch — lower-income household profile, screen leases tightly.
- Zoned schools: Sycamore Elementary School (math 32% / reading 27%, grade F, #697 of 994 statewide, top 73%, 401 students, 75% FRL); Central Middle School (math 23% / reading 38%, grade F, #203 of 330 statewide, top 63%, 458 students, 57% FRL); Kokomo High School (math 19% / reading 48%, grade F, #289 of 369 statewide, top 78%, 1,519 students, 58% FRL) — zoned schools at 63% FRL track the district average.
- Market conditions: Rents soft (-1.5%/yr); 246 active listings in the ZIP; 194 units permitted in Howard County in 2024 (0 in 5+ unit buildings).
Forward outlook
- Local home prices are declining (-3.0%/yr); year-one equity from $926 of loan paydown is wiped out by about $4k of value loss. Plan a longer hold.
- Howard County population projected at -11% by 2050 — secular population decline; favor cash flow + early exit over multi-decade hold.
Negotiation context
- It's been on market 153 days — a 12% lower offer ($118k) is reasonable based on typical stale-listing flexibility.
- 2 sale attempts; this cycle's ask has dropped $9k (6%) from the opening price — seller is motivated, your offer sets the floor, not the list.
Risks & watch-outs
- Watch-outs: built in 1874 — expect roof / HVAC / electrical / plumbing capex.
Questions for the listing agent
- It's been on market 153 days. Have you received any prior offers? Is the seller open to a 12% concession, seller financing, or rate buy-down credit?
- Built in 1874 — when were the roof, HVAC, electrical panel, plumbing, and water heater last replaced?
- Why hasn't it sold? Are there any deal-killer items the seller is aware of (foundation, flood, title, zoning, code violations)?
- Is there a deadline driving the sale (1031 exchange, divorce, estate, relocation)? That informs how much negotiation room exists.
- Schools are F-rated, which usually means shorter tenancies and higher turnover. Who's the typical renter profile here, and what's been the actual vacancy rate?
- Crime grade is D in this area — have there been break-ins, vandalism, or insurance claims at this property in the last 3 years? What carrier currently insures it and at what premium?
- What's the average days-on-market for RENTAL listings here right now (not sales)? A rising rental-DOM trend means longer vacancies and softer asking-rent achievability than the comps imply.
- What's the recent tenant-quality profile in this submarket — average credit score on applications, eviction rate, late-payment / NSF rate, and stable-employment percentage? A property-management company in the area should have these aggregated.
- How much new for-sale + rental construction is in the pipeline within 1–3 miles? Heavy new supply typically softens prices + rents 12–24 months out; constrained supply supports both.
Investment metrics
- 1% rule
- 0.98% ✗
- Cap rate
- 8.52%
- Cash-on-cash
- 7.96%
- DSCR
- 1.35
- GRM
- 8.5
CMA / ARV
- ARV (on-the-fly)
- $153,428
- Comps found
- 12
Show comp detail 12 sales within ~0.75 mi
| Address | Dist | Beds/Ba | Sqft | Sold | Price | $/sf | Match |
|---|---|---|---|---|---|---|---|
| 416 N Calumet St | 0.12mi | 3/2.0 | 1,340 (+6%) | 7mo | $186,000 | $139 | 75 |
| 800 E Jefferson St | 0.54mi | 3/2.0 | 1,280 (+1%) | 1mo | $142,000 | $111 | 68 |
| 1134 E Elm St | 0.37mi | 2/1.5 (-1) | 1,284 (+1%) | 8mo | $75,000 | $58 | 67 |
| 1244 E Mulberry St | 0.26mi | 3/2.0 | 1,204 (-5%) | 10mo | $160,000 | $133 | 67 |
| 205 S Calumet St | 0.43mi | 3/2.0 | 1,300 (+2%) | 11mo | $179,900 | $138 | 63 |
| 802 E Taylor St | 0.55mi | 3/1.0 | 1,314 (+4%) | 10mo | $55,900 | $43 | 60 |
| 1001 E Elm St | 0.43mi | 3/2.0 | 1,350 (+6%) | 11mo | $167,000 | $124 | 56 |
| 1101 N Bell St | 0.73mi | 3/2.0 | 1,248 (-2%) | 10mo | $120,000 | $96 | 51 |
| 113 S Calumet St | 0.38mi | 3/1.5 | 1,108 (-13%) | 13mo | $147,000 | $133 | 48 |
| 710 E Jefferson St | 0.58mi | 2/1.0 (-1) | 1,152 (-9%) | 7mo | $25,000 | $22 | 47 |
| 1032 E Dixon St | 0.49mi | 4/1.0 (+1) | 1,086 (-14%) | 11mo | $105,000 | $97 | 39 |
| 701 E North St | 0.73mi | 3/2.0 | 1,113 (-12%) | 12mo | $135,000 | $121 | 32 |
Match score weights: distance 35% · size 25% · config 20% · recency 20%. Top-matched comps best support the ARV.
Projected returns pro-forma
-3.0% appreciation · 0.0% rent growth · sell at horizon
- IRR
- -7.3%
- Equity multiple
- 0.74×
- Total profit
- $-9,789
- Equity at exit
- $19,965
- IRR
- -1.5%
- Equity multiple
- 0.91×
- Total profit
- $-3,316
- Equity at exit
- $11,577
Cash invested: $37,492 (down + closing). Projections, not guarantees.
Landlord ↔ Tenant lean methodology
- Overall (STATE)
- 90 Strongly Landlord-Friendly
- State Indiana
- 90 Strongly Landlord-Friendly · R+11
- County
- — inherits STATE
- City
- — inherits STATE
ZIP-level market 46901
- Home prices YoY
- -24.4%
- Rents YoY
- -1.5%
- Active inventory
- 246
- Price-to-rent
- 8.5×
Monthly cashflow live
- Estimated rent
- $1,318 medium interval (Pro) →
- Mortgage (P&I)
- −$702
- Tax from tax record
- −$35 /mo · $416/yr
- Insurance
- −$56
- HOA
- −$0
- Vacancy / Maint / Mgmt
- −$277
- Net cashflow
- $249
Break-even live
Sensitivity live
| Price | -10% $324 | -5% $286 | +0% $249 | +5% $211 | +10% $173 |
|---|---|---|---|---|---|
| Rent | -10% $144 | -5% $197 | +0% $249 | +5% $301 | +10% $353 |
| Rate | -1.0pp $316 | -0.5pp $283 | base $249 | +0.5pp $214 | +1.0pp $179 |
UW: 25.0% down · 7.5% · 30yr · 1.5% tax · 5.0% vac · 8.0% maint · 8.0% mgmt
Financing live
Cash to close
- Down payment
- $33,475
- Closing costs
- $4,017
- Reserves months
- —
- Total cash needed
- —
Loan-product check · same deal, 3 products live
Conventional
25% down · 7.5% · 30yr
- Down + closing
- —
- Monthly P&I
- —
- Monthly cashflow
- —
- DSCR
- —
- Eligible?
- —
Personal DTI + credit; lowest rate.
DSCR
20% down · 8.5% · 30yr
- Down + closing
- —
- Monthly P&I
- —
- Monthly cashflow
- —
- DSCR
- —
- Eligible?
- —
No personal income docs; deal must DSCR.
Hard money
10% down · 12.0% · 12mo
- Down + closing
- —
- Monthly P&I
- —
- Monthly cashflow
- —
- DSCR
- —
- Eligible?
- —
Short-term bridge; refi at stabilization.
Listing history 14 events
-
2026-06-10status $133,900 Pending 153 DOM
-
2026-06-09days on market $133,900 Active 153 DOM
-
2026-06-08days on market $133,900 Active 152 DOM
-
2026-06-07days on market $133,900 Active 151 DOM
-
2026-06-03statusdays on market $133,900 Active 146 DOM
-
2026-05-30days on market $133,900 Active Under Contract 211 DOM
-
2026-04-16historical Active Under Contract
-
2026-04-06price $133,900
-
2026-03-26status Active
-
2026-03-16status Pending
-
2026-02-19price $134,900
-
2026-01-17price $137,500
-
2025-11-19price $140,500
-
2025-10-21$143,000 Active
ⓘ Source: listings_history table (triggers on properties + properties_extension) + one-shot
backfill from property_details.listing_events for pre-trigger history.
Tax reassessment forecast IN · Partial reset (capped growth)
- Current annual tax
- $416 · $35/mo
- Projected year-2 tax
- $777 · $65/mo
- Expected delta
- +$361/yr (+$30/mo · 86.8%)
ⓘ Screening estimate from a state-policy table — verify with the county assessor before closing.
Climate risk First Street
- Flood 1/10 Low FEMA zone X (unshaded) · 0% chance over 30 yrs
- Wildfire 1/10 Low
- Heat 3/10 Moderate 7 d/yr ≥101°F today · 17 d/yr by 30 yrs out
- Wind 2/10 Low
- Air quality 3/10 Moderate 2 unhealthy d/yr today · 3 by 30 yrs out
Nearby sold comps map
Loading sold comps map…
Walkable amenities ~0.75 mi
Loading nearby amenities…
Taxation est. · year 1
- Rental income
- $15,816
- − Mortgage interest
- −$7,500
- − Property taxes
- −$416
- − Insurance
- −$670
- − Repairs & maintenance
- −$1,265
- − Management
- −$1,265
- − Depreciation
- −$3,895
- Taxable income
- $804
- Est. tax owed @ 24.0%
- −$193
- After-tax cash flow
- $2,790/yr
For passive investors: Depreciation is non-cash, so a rental often shows a tax loss while cash-flowing — sheltering income. Rental losses are passive: they offset passive income freely, and up to $25,000/yr can offset ordinary (W-2) income if you actively participate and your MAGI is under $100k (phasing out to $0 by $150k); unused losses carry forward. On sale, claimed depreciation is recaptured at up to 25%, and gains may owe capital-gains tax (a 1031 exchange can defer both). Figures are a year-1 estimate at your 24.0% rate — not tax advice; consult a CPA.
Schools (NCES district)
- District
- Kokomo School Corporation
- NCES district ID
- 1805370
- Math proficiency
- 22% ▼ -8.00%
- Reading proficiency
- 30% ▼ -5.00%
- Median HH income
- $35,804
- Composite
- 21.5/100
- National rank
- #8325
- State rank
- #264 of 301 in IN
Livability — Kokomo
- Score
- 68/100
- State rank
- #227
- US rank
- #9912
Category grades
Schools grade is shown separately in the Schools card above.
Census & demographics
- Census place
- Kokomo, IN
- County
- Howard County · 75,099 people
- City population
- 75,099
- Metro
- Kokomo, IN
- Population (ZIP)
- 38,082
- Household income
- $60,495
- Rent vs Own
- Severe rent burden
- 1116.0
Population outlook (Howard County) Hauer SSP2
- Today (2025)
- 81,522 people
- By 2030
- 80,104 · -1.7%
- By 2040
- 76,708 · -5.9%
- By 2050
- 72,880 · -10.6%
- By 2075
- 64,016 · -21.5%
- By 2100
- 51,705 · -36.6%
Race, ethnicity, and origin ACS 2023
- Neighborhood character
- Predominantly White (83%)
- Race & ethnicity
- White 83% Black 9% Two or more races 5% Hispanic / Latino 4%
- Common ancestry
- Italian 2% Romanian 2% Slovak 1%
- Foreign-born
- 1% · Canada
- Languages at home
- 96% English-only · German/W. Germanic 1% Spanish 1%
Political lean MEDSL · Howard
- 2024 margin
- Solid R (+35.3) · D 31.4% · R 66.7% · Other 1.8%
- 2008→2024 swing
- -29.1pp toward R · 2008: -6.2pp · 2024: -35.3pp
- All cycles
- 2024: R+35.3 2020: R+32.4 2016: R+33.9 2012: R+14.3 2008: R+6.2
Not yet ingested
- Civics
- —
Market trends
- HPI YoY
- ▼ -78.40%
- Current HPI
- 242.2565
- Rent YoY
- ▼ -1.47%
- Metro
- Kokomo, IN
- State GDP YoY
- ▲ 2.90%
- F500 in state
- 18
Industry mix (Fortune 500 HQ in IN)
| Industry | F500 HQs | Revenue |
|---|---|---|
| Industrial Machinery | 2 | $37B |
|
||
| Healthcare | 1 | $177B |
|
||
| Pharmaceuticals | 1 | $45B |
|
||
| Metals / Steel | 1 | $18B |
|
||
| Agriculture | 1 | $17B |
|
||
| Packaging | 1 | $12B |
|
||
Price history
-6.4% since first listed8 events — show timeline
- 2026-04-16 Contingent — IRMLS
- 2026-04-06 Price Changed $133,900 IRMLS
- 2026-03-26 Relisted — IRMLS
- 2026-03-16 Pending — IRMLS
- 2026-02-19 Price Changed $134,900 IRMLS
- 2026-01-17 Price Changed $137,500 IRMLS
- 2025-11-19 Price Changed $140,500 IRMLS
- 2025-10-21 Listed $143,000 IRMLS
Property tax history
+1.3%/yrLatest (2024): $416 · -6.3% YoY. Source: county tax records.
Cash-flow waterfall
monthlySold comps — $/sqft
last 12 mo · ≤1 miLoading sold comps…