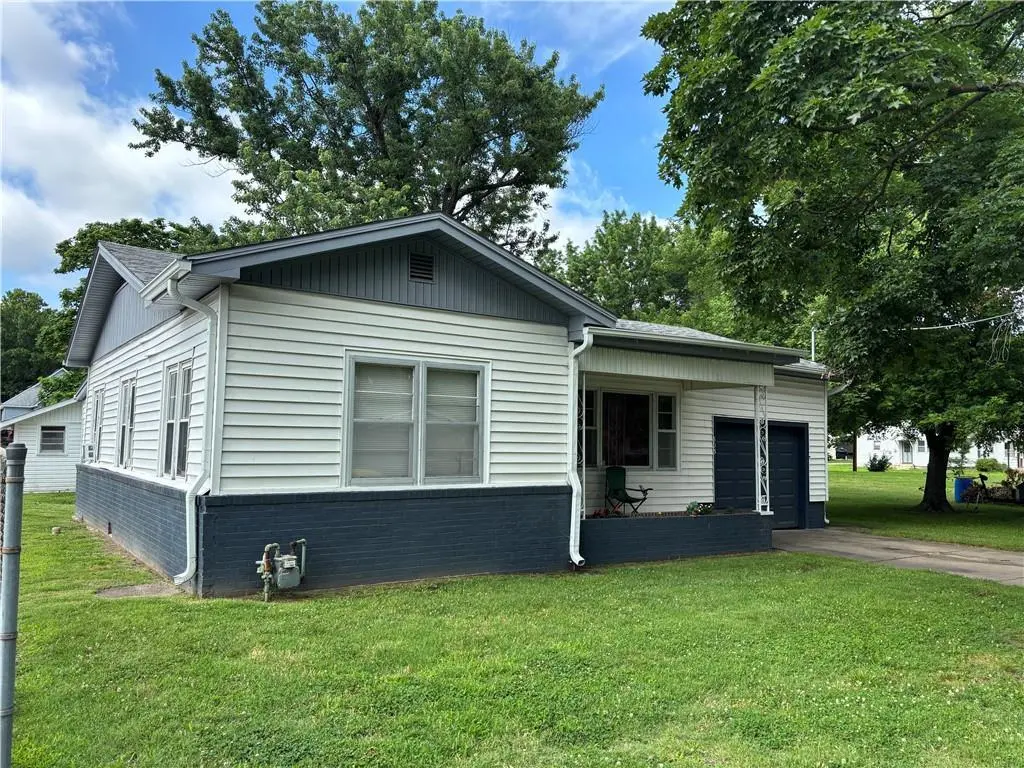
503 W 3rd St · Pittsburg, KS
Flood risk 1/10 · Minimal
- FEMA flood zone
- X (unshaded)
- Chance of flooding over 30 yrs
- 0.0%
- Est. flood insurance / yr
- $507 – $1,088
Fire risk 4/10 · Minor
- Est. fire insurance / yr
- $1,154 – $2,142
Heat risk 5/10 · Moderate
- Hot days now (above 108°F)
- 7 days/yr
- Hot days in 30 yrs
- 19 days/yr
Wind risk 2/10 · Minimal
- Chance of severe wind over 30 yrs
- 2.0%
Air-quality risk 2/10 · Minimal
- Unhealthy air days now
- 1 days/yr
- Unhealthy air days in 30 yrs
- 1 days/yr
Risk factors via First Street. Map © Google.
Why this score? — see what drove the C+ grade
The composite is a weighted blend of 9 inputs, each scored 0–100. Each bar is that input's sub-score; the figure is the points it added to the 100-point composite (weight × sub-score).
- Cash flow +24.3/30.0
- ARV discount +12.5/15.0
- DSCR +7.8/10.0
- 1% rule +5.7/10.0
- Rent growth +5.0/5.0
- Livability +3.3/5.0
- Schools +2.5/10.0
- Condition / age +2.5/5.0
- Appreciation +0.0/10.0
$120,000
🖨 Deal sheet (PDF) 📄 Offer letter ✓ Due diligence
Key facts
- Hardwood flooring
- Quiet street
- Attached garage
Tags
Property features AI
Finance
- Other: Lot approximately 8,784 square feet; Living area about 1,275 (public records)
- HOA & community: No association fees
Exterior
- Parking: Attached 1-car garage
- Utilities: Public water; Public sewer
- Home design: Single-family residence; Attached property; Ranch style
- Construction: Brick trim and vinyl siding; Composition roof; Approximately 76–100 years old
- Exterior features: Not in a flood plain
Interior
- Bedrooms: 3 bedrooms
- Bathrooms: 2 full bathrooms
- Heating & cooling: Natural gas heating; Electric cooling (central air)
- Interior features: Ranch floor plan; Crawl space basement
Neighborhood map
What this means for you Summary
Snapshot
- This is a 3-bed/2.0-bath single-family listed at $120k.
Deal economics
- At list price, monthly cash flow is $241 ($3k/yr) — positive.
- The deal already cash-flows at list — no discount required.
- Meets the 1% rule at list price ($1k rent vs $120k).
- Recommended offer: $118k (1.5% below list) — sets the bar for market timing.
- Cap rate 8.7% vs local median 5.4% in Pittsburg — top-decile yield for the area; either an underpriced asset or a hidden risk that comps aren't pricing in. Stress-test before assuming the spread holds.
Location & tenants
- Location reads 66/100 on livability (#270 in KS) — a middle-class / working-renter tenant base. Strengths: cost of living A+, housing A, health & safety A; Watch: crime F, amenities F, commute F.
- Pittsburg (town): math 29% / reading 31% proficiency, ranked #111 of 169 in KS (top 66%) — families likely to look elsewhere, expect single-tenant / working-renter base with shorter leases.
- Zoned schools: Pittsburg Middle School (math 28% / reading 26%, grade F, #94 of 219 statewide, top 44%, 720 students, 67% FRL); Pittsburg High (math 27% / reading 32%, grade F, #60 of 327 statewide, top 24%, 1,017 students, 60% FRL).
- Market conditions: Rents rising fast (+13.8%/yr); 142 active listings in the ZIP; 3 comparable units currently listed for rent nearby; rentals lingering (median 45d on market — plan ~5-8 weeks vacancy on turnover, expect pricing pressure); 100% of comp listings sitting > 30 days — soft ceiling on asking rent; 65 units permitted in Crawford County in 2024 (0 in 5+ unit buildings).
- This rent runs 30% of the median local income ($51k/yr) — at the standard rent-burdened threshold; future hikes will face affordability resistance.
Forward outlook
- Local home prices are declining (-3.0%/yr); year-one equity from $830 of loan paydown is wiped out by about $4k of value loss. Plan a longer hold.
- At projected returns (-3.0% appreciation + 8.0% rent growth), your $34k cash investment doubles in ~8 years — after that, you're playing with house money.
Negotiation context
- It's been on market 16 days — a 2% lower offer ($118k) is reasonable based on typical stale-listing flexibility.
Risks & watch-outs
- Watch-outs: built in 1946 — expect roof / HVAC / electrical / plumbing capex.
- Climate carrying-cost: extreme-heat days projected 7→19/yr by 2055 (HVAC capex compounding) — expect insurance premiums to compound above CPI over the hold.
Questions for the listing agent
- Built in 1946 — when were the roof, HVAC, electrical panel, plumbing, and water heater last replaced?
- Is there a deadline driving the sale (1031 exchange, divorce, estate, relocation)? That informs how much negotiation room exists.
- Schools are D-rated, which usually means shorter tenancies and higher turnover. Who's the typical renter profile here, and what's been the actual vacancy rate?
- Crime grade is F in this area — have there been break-ins, vandalism, or insurance claims at this property in the last 3 years? What carrier currently insures it and at what premium?
- What's the average days-on-market for RENTAL listings here right now (not sales)? A rising rental-DOM trend means longer vacancies and softer asking-rent achievability than the comps imply.
- What's the recent tenant-quality profile in this submarket — average credit score on applications, eviction rate, late-payment / NSF rate, and stable-employment percentage? A property-management company in the area should have these aggregated.
- How much new for-sale + rental construction is in the pipeline within 1–3 miles? Heavy new supply typically softens prices + rents 12–24 months out; constrained supply supports both.
Investment metrics
- 1% rule
- 1.07% ✓
- Cap rate
- 8.70%
- Cash-on-cash
- 8.59%
- DSCR
- 1.38
- GRM
- 7.8
CMA / ARV
- ARV (on-the-fly)
- $135,150
- Comps found
- 12
Show comp detail 12 sales within ~0.75 mi
| Address | Dist | Beds/Ba | Sqft | Sold | Price | $/sf | Match |
|---|---|---|---|---|---|---|---|
| 603 W 2nd N/A | 0.11mi | 3/2.0 | 1,247 (-2%) | 2mo | $210,000 | $168 | 90 |
| 708 W 1st St | 0.21mi | 3/2.0 | 1,210 (-5%) | 4mo | $125,000 | $103 | 78 |
| 601 N Woodland St | 0.30mi | 3/1.0 | 1,216 (-5%) | 1mo | $129,500 | $106 | 74 |
| 306 S Olive St | 0.33mi | 3/1.5 | 1,114 (-13%) | 6mo | $115,000 | $103 | 56 |
| 124 W Park St | 0.49mi | 3/2.0 | 1,412 (+11%) | 6mo | $79,000 | $56 | 54 |
| 310 E Park St | 0.73mi | 3/2.0 | 1,215 (-5%) | 6mo | $150,000 | $123 | 53 |
| 707 W 8th St | 0.42mi | 3/1.5 | 1,463 (+15%) | 1mo | $145,000 | $99 | 53 |
| 209 S Catalpa St | 0.27mi | 2/1.0 (-1) | 1,106 (-13%) | 8mo | $155,000 | $140 | 50 |
| 408 S Joplin St | 0.68mi | 3/1.0 | 1,141 (-10%) | 1mo | $105,000 | $92 | 46 |
| 313 E Park St | 0.73mi | 3/2.0 | 1,102 (-14%) | 1mo | $167,500 | $152 | 42 |
| 406 E 8th St | 0.73mi | 2/1.0 (-1) | 1,131 (-11%) | 5mo | $79,900 | $71 | 34 |
| 409 E 8th St | 0.73mi | 3/1.0 | 1,088 (-15%) | 5mo | $115,000 | $106 | 33 |
Match score weights: distance 35% · size 25% · config 20% · recency 20%. Top-matched comps best support the ARV.
Projected returns pro-forma
-3.0% appreciation · 8.0% rent growth · sell at horizon
- IRR
- 1.9%
- Equity multiple
- 1.08×
- Total profit
- $2,618
- Equity at exit
- $17,892
- IRR
- 15.7%
- Equity multiple
- 2.57×
- Total profit
- $52,690
- Equity at exit
- $10,375
Cash invested: $33,600 (down + closing). Projections, not guarantees.
Landlord ↔ Tenant lean methodology
- Overall (STATE)
- 83 Strongly Landlord-Friendly
- State Kansas
- 83 Strongly Landlord-Friendly · R+10
- County
- — inherits STATE
- City
- — inherits STATE
ZIP-level market 66762
- Rents YoY
- 13.8%
- Active inventory
- 142
- Price-to-rent
- 7.8×
Monthly cashflow live
- Estimated rent
- $1,278 medium interval (Pro) →
- Mortgage (P&I)
- −$629
- Tax from tax record
- −$90 /mo · $1,080/yr
- Insurance
- −$50
- HOA
- −$0
- Vacancy / Maint / Mgmt
- −$268
- Net cashflow
- $241
Break-even live
Sensitivity live
| Price | -10% $309 | -5% $275 | +0% $241 | +5% $207 | +10% $173 |
|---|---|---|---|---|---|
| Rent | -10% $140 | -5% $190 | +0% $241 | +5% $291 | +10% $342 |
| Rate | -1.0pp $301 | -0.5pp $271 | base $241 | +0.5pp $210 | +1.0pp $178 |
UW: 25.0% down · 7.5% · 30yr · 1.5% tax · 5.0% vac · 8.0% maint · 8.0% mgmt
Financing live
Cash to close
- Down payment
- $30,000
- Closing costs
- $3,600
- Reserves months
- —
- Total cash needed
- —
Loan-product check · same deal, 3 products live
Conventional
25% down · 7.5% · 30yr
- Down + closing
- —
- Monthly P&I
- —
- Monthly cashflow
- —
- DSCR
- —
- Eligible?
- —
Personal DTI + credit; lowest rate.
DSCR
20% down · 8.5% · 30yr
- Down + closing
- —
- Monthly P&I
- —
- Monthly cashflow
- —
- DSCR
- —
- Eligible?
- —
No personal income docs; deal must DSCR.
Hard money
10% down · 12.0% · 12mo
- Down + closing
- —
- Monthly P&I
- —
- Monthly cashflow
- —
- DSCR
- —
- Eligible?
- —
Short-term bridge; refi at stabilization.
Rent comps 3 comps
| Address | Beds | Baths | Sqft | Rent | $/sqft | DOM | Units | Dist |
|---|---|---|---|---|---|---|---|---|
| 1108 S Joplin St Pittsburg, KS | 2.0 | 1.5 | 850 | $775 | $0.91 | 45d | 2 | 1.01mi |
| 719 E Madison St Apt A Pittsburg, KS | 3.0 | 3.0 | 1300 | $1,200 | $0.92 | 45d | 1 | 1.30mi |
| 102 Creekside Way Pittsburg, KS | 2.0 | 2.0 | 1450 | $2,000 | $1.38 | 45d | 2 | 1.47mi |
Listing history 13 events
-
2026-06-21days on market $120,000 Active 16 DOM
-
2026-06-19days on market $120,000 Active 14 DOM
-
2026-06-18days on market $120,000 Active 13 DOM
-
2026-06-17price $120,000 Active 12 DOM
-
2026-06-17days on market $130,000 Active 12 DOM
-
2026-06-16days on market $130,000 Active 11 DOM
-
2026-06-15days on market $130,000 Active 10 DOM
-
2026-06-14days on market $130,000 Active 8 DOM
-
2026-06-13days on market $130,000 Active 7 DOM
-
2026-06-10days on market $130,000 Active 5 DOM
-
2026-06-09days on market $130,000 Active 4 DOM
-
2026-06-08days on market $130,000 Active 3 DOM
-
2026-06-07$130,000 Active 2 DOM
ⓘ Source: listings_history table (triggers on properties + properties_extension) + one-shot
backfill from property_details.listing_events for pre-trigger history.
Tax reassessment forecast KS · Resets to sale price
- Current annual tax
- $1,080 · $90/mo
- Projected year-2 tax
- $1,692 · $141/mo
- Expected delta
- +$612/yr (+$51/mo · 56.6%)
ⓘ Screening estimate from a state-policy table — verify with the county assessor before closing.
Climate risk First Street
- Flood 1/10 Low FEMA zone X (unshaded) · 0% chance over 30 yrs
- Wildfire 4/10 Moderate
- Heat 5/10 Major 7 d/yr ≥108°F today · 19 d/yr by 30 yrs out
- Wind 2/10 Low 2% chance of damaging wind over 30 yrs
- Air quality 2/10 Low 1 unhealthy d/yr today · 1 by 30 yrs out
Nearby sold comps map
Loading sold comps map…
Walkable amenities ~0.75 mi
Loading nearby amenities…
Taxation est. · year 1
- Rental income
- $15,341
- − Mortgage interest
- −$6,722
- − Property taxes
- −$1,080
- − Insurance
- −$600
- − Repairs & maintenance
- −$1,227
- − Management
- −$1,227
- − Depreciation
- −$3,491
- Taxable income
- $993
- Est. tax owed @ 24.0%
- −$238
- After-tax cash flow
- $2,649/yr
For passive investors: Depreciation is non-cash, so a rental often shows a tax loss while cash-flowing — sheltering income. Rental losses are passive: they offset passive income freely, and up to $25,000/yr can offset ordinary (W-2) income if you actively participate and your MAGI is under $100k (phasing out to $0 by $150k); unused losses carry forward. On sale, claimed depreciation is recaptured at up to 25%, and gains may owe capital-gains tax (a 1031 exchange can defer both). Figures are a year-1 estimate at your 24.0% rate — not tax advice; consult a CPA.
Schools (NCES district)
- District
- Pittsburg
- NCES district ID
- 2010710
- Math proficiency
- 29% ▼ -5.00%
- Reading proficiency
- 31% ▼ -4.00%
- Median HH income
- $33,608
- Composite
- 24.63/100
- National rank
- #7629
- State rank
- #111 of 169 in KS
Livability — Pittsburg
- Score
- 66/100
- State rank
- #270
- US rank
- #12149
Category grades
Schools grade is shown separately in the Schools card above.
Census & demographics
- Census place
- Pittsburg, KS
- County
- Crawford County · 24,907 people
- City population
- 24,907
- Metro
- Pittsburg, KS
- Population (ZIP)
- 24,907
- Household income
- $50,511
- Rent vs Own
- Severe rent burden
- 1186.0
Population outlook (Crawford County) Hauer SSP2
- Today (2025)
- 39,393 people
- By 2030
- 39,540 · +0.4%
- By 2040
- 39,452 · +0.1%
- By 2050
- 39,188 · -0.5%
- By 2075
- 39,038 · -0.9%
- By 2100
- 38,219 · -3.0%
Race, ethnicity, and origin ACS 2023
- Neighborhood character
- Predominantly White (80%)
- Race & ethnicity
- White 80% Hispanic / Latino 10% Two or more races 5% Asian 2% Black 2%
- Hispanic origin (detail)
- Mexican 7%
- Common ancestry
- Slovak 2% Lithuanian 2% Italian 2%
- Foreign-born
- 5% · Canada, China
- Languages at home
- 92% English-only · Spanish 6% Other Asian/Pacific 1%
Political lean MEDSL · Crawford
- 2024 margin
- Strong R (+25.3) · D 36.5% · R 61.7% · Other 1.8%
- 2008→2024 swing
- -26.7pp toward R · 2008: 1.4pp · 2024: -25.3pp
- All cycles
- 2024: R+25.3 2020: R+23.1 2016: R+23.1 2012: R+6.5 2008: D+1.4
Not yet ingested
- Civics
- —
Market trends
- HPI YoY
- ▼ -171.14%
- Current HPI
- 158.7878
- Rent YoY
- ▲ 13.80%
- Metro
- Pittsburg, KS
- State GDP YoY
- —
- F500 in state
- 0
Price history
2 events — show timeline
- 2026-06-05 Listed $130,000 Heartland MLS as Distributed by MLS Grid
- 2019-04-04 Sold (Public Records) — Public Records
Property tax history
-0.1%/yrLatest (2025): $1,080 · +11.4% YoY. Source: county tax records.
Cash-flow waterfall
monthlySold comps — $/sqft
last 12 mo · ≤1 miLoading sold comps…