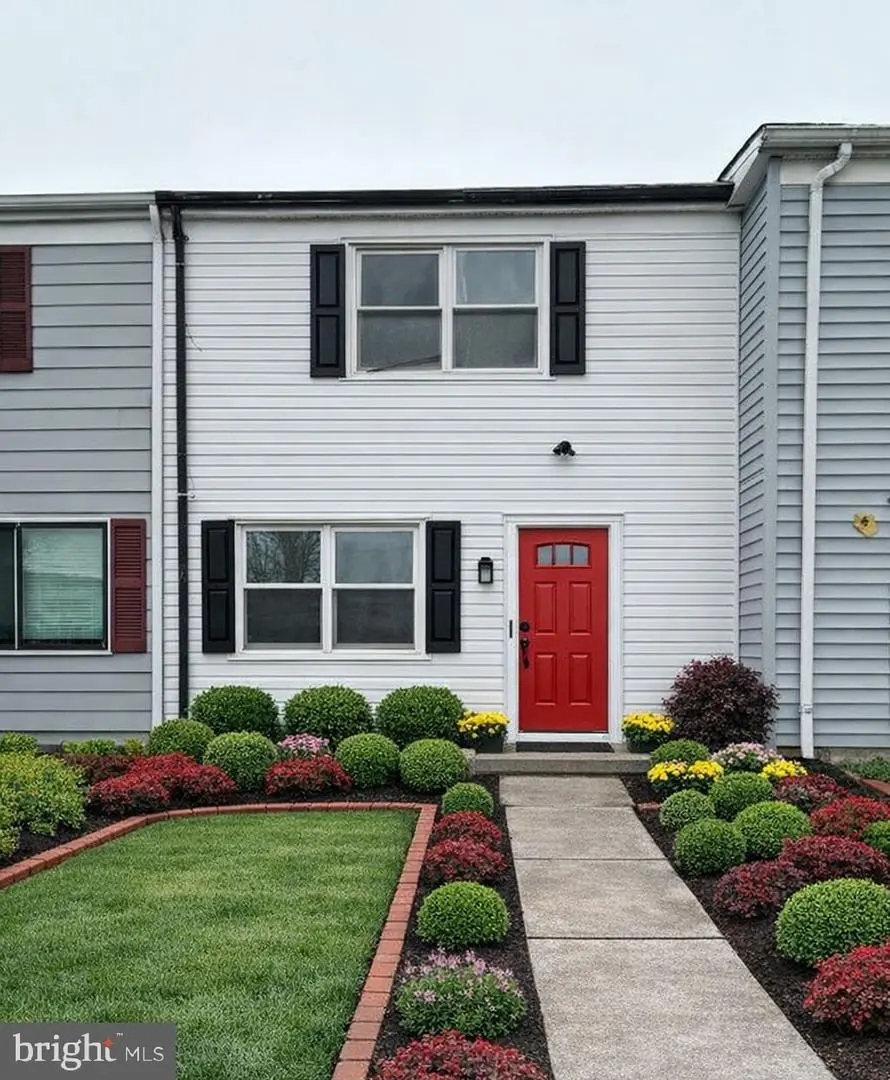
411 Clover Ct · Taneytown, MD
Flood risk 1/10 · Minimal
- FEMA flood zone
- X (unshaded)
- Chance of flooding over 30 yrs
- 0.0%
- Est. flood insurance / yr
- $507 – $1,088
Fire risk 1/10 · Minimal
- Est. fire insurance / yr
- $755 – $1,403
Heat risk 6/10 · Moderate
- Hot days now (above 102°F)
- 7 days/yr
- Hot days in 30 yrs
- 15 days/yr
Wind risk 4/10 · Minor
- Chance of severe wind over 30 yrs
- 8.0%
Air-quality risk 2/10 · Minimal
- Unhealthy air days now
- 1 days/yr
- Unhealthy air days in 30 yrs
- 3 days/yr
Risk factors via First Street. Map © Google.
Why this score? — see what drove the C+ grade
The composite is a weighted blend of 9 inputs, each scored 0–100. Each bar is that input's sub-score; the figure is the points it added to the 100-point composite (weight × sub-score).
- Cash flow +21.6/30.0
- ARV discount +15.0/15.0
- DSCR +6.9/10.0
- 1% rule +5.4/10.0
- Schools +3.7/10.0
- Livability +3.6/5.0
- Rent growth +2.5/5.0
- Condition / age +2.5/5.0
- Appreciation +0.0/10.0
$174,000
🖨 Deal sheet 📄 Offer letter ✓ Due diligence
Listing remarks MLS
Opportunity knocks with this 3‑bedroom, 1‑bath interior townhouse located in an established Taneytown community. Built in 1978, this property is perfect for investors or owner occupants and ideal for buyers looking for their next project. The home offers a functional floor plan with three bedrooms on the upper level and main‑level living space that can be modernized. The rear of the home provides room for a future patio or outdoor improvement, adding additional value potential. This property presents a strong value‑add opportunity for renovation and resale, rental hold, or long‑term investment. Comparable renovated townhomes in the area support upside for the right buyer.
Key facts
- Interior townhouse
- Future patio
- Built 1978
Tags
Neighborhood map
What this means for you Summary
Snapshot
- This is a 3-bed/1.0-bath townhouse listed at $174k.
Deal economics
- At list price, monthly cash flow is $264 ($3k/yr) — positive.
- The deal already cash-flows at list — no discount required.
- Meets the 1% rule at list price ($2k rent vs $174k).
- Recommended offer: $158k (9.0% below list) — sets the bar for market timing.
- Cap rate 8.1% vs local median 1.8% in Taneytown — top-decile yield for the area; either an underpriced asset or a hidden risk that comps aren't pricing in. Stress-test before assuming the spread holds.
Location & tenants
- Location reads 71/100 on livability (#149 in MD) — a middle-class / working-renter tenant base. Strengths: housing A+, health & safety A+, employment A-; Watch: schools C-, crime D+, amenities F.
- Carroll County Public Schools (suburban): math 32% / reading 47% proficiency, ranked #2 of 24 in MD (top 8%) — families likely to look elsewhere, expect single-tenant / working-renter base with shorter leases; only 16% free/reduced lunch — higher-income household profile.
- Market conditions: 55 active listings in the ZIP; 4 comparable units currently listed for rent nearby; rentals leasing fast (median 13d on market — plan ~1-2 weeks tenant-placement turnaround); 156 units permitted in Carroll County in 2024 (12 in 5+ unit buildings).
Forward outlook
- Local home prices are declining (-3.0%/yr); year-one equity from $1k of loan paydown is wiped out by about $5k of value loss. Plan a longer hold.
- Carroll County population projected to shrink 7% by 2050 — rents likely to lag national; underwrite the cash flow, not the appreciation.
Negotiation context
- It's been on market 120 days — a 9% lower offer ($158k) is reasonable based on typical stale-listing flexibility.
- 2 sale attempts with the ask held roughly flat each time — persistent listings suggest the price (not the market) is what's stuck; bring a comps-based counter.
Risks & watch-outs
- Climate carrying-cost: extreme-heat days projected 7→15/yr by 2055 (HVAC capex compounding) — expect insurance premiums to compound above CPI over the hold.
Questions for the listing agent
- It's been on market 120 days. Have you received any prior offers? Is the seller open to a 9% concession, seller financing, or rate buy-down credit?
- Built in 1978 — when were the roof, HVAC, electrical panel, plumbing, and water heater last replaced?
- Why hasn't it sold? Are there any deal-killer items the seller is aware of (foundation, flood, title, zoning, code violations)?
- Is there a deadline driving the sale (1031 exchange, divorce, estate, relocation)? That informs how much negotiation room exists.
- Crime grade is D in this area — have there been break-ins, vandalism, or insurance claims at this property in the last 3 years? What carrier currently insures it and at what premium?
- What's the average days-on-market for RENTAL listings here right now (not sales)? A rising rental-DOM trend means longer vacancies and softer asking-rent achievability than the comps imply.
- What's the recent tenant-quality profile in this submarket — average credit score on applications, eviction rate, late-payment / NSF rate, and stable-employment percentage? A property-management company in the area should have these aggregated.
- How much new for-sale + rental construction is in the pipeline within 1–3 miles? Heavy new supply typically softens prices + rents 12–24 months out; constrained supply supports both.
Investment metrics
- 1% rule
- 1.04% ✓
- Cap rate
- 8.11%
- Cash-on-cash
- 6.50%
- DSCR
- 1.29
- GRM
- 8.0
CMA / ARV
- ARV (median comp)
- $212,044
- List price
- $174,000
- Delta
- -17.94%
- Verdict
- UNDERPRICED
- Comps
- 20 within 1.0 mi
Show comp detail 12 sales within ~0.75 mi
| Address | Dist | Beds/Ba | Sqft | Sold | Price | $/sf | Match |
|---|---|---|---|---|---|---|---|
| 423 Clover Ct | 0.02mi | 3/— | 1,152 (0%) | 3mo | $230,000 | $200 | 97 |
| 526 Daisy Dr | 0.15mi | 3/1.5 | 1,152 (0%) | 1mo | $220,000 | $191 | 90 |
| 404 Red Tulip Ct | 0.17mi | 3/1.5 | 1,152 (0%) | 0mo | $230,000 | $200 | 90 |
| 417 Red Tulip Ct | 0.14mi | 3/1.5 | 1,160 (+1%) | 2mo | $229,900 | $198 | 89 |
| 505 Chestnut Ct | 0.12mi | 3/1.5 | 1,152 (0%) | 7mo | $212,000 | $184 | 86 |
| 443 Red Tulip Ct | 0.12mi | 3/1.5 | 1,152 (0%) | 10mo | $228,000 | $198 | 84 |
| 6 Courtland St | 0.24mi | 2/1.0 (-1) | 1,152 (0%) | 10mo | $214,000 | $186 | 76 |
| 3 Courtland St | 0.24mi | 2/1.0 (-1) | 1,208 (+5%) | 3mo | $216,000 | $179 | 73 |
| 149 Grand Dr | 0.56mi | 3/1.5 | 1,188 (+3%) | 7mo | $200,000 | $168 | 61 |
| 105 Carnival Dr | 0.57mi | 3/1.5 | 1,032 (-10%) | 5mo | $225,000 | $218 | 50 |
| 113 Grand Dr | 0.53mi | 3/1.5 | 1,032 (-10%) | 11mo | $202,000 | $196 | 47 |
| 138 Grand Dr | 0.52mi | 3/1.5 | 1,305 (+13%) | 7mo | $227,000 | $174 | 46 |
Match score weights: distance 35% · size 25% · config 20% · recency 20%. Top-matched comps best support the ARV.
Projected returns pro-forma
-3.0% appreciation · 3.0% rent growth · sell at horizon
- IRR
- -6.3%
- Equity multiple
- 0.77×
- Total profit
- $-11,392
- Equity at exit
- $25,944
- IRR
- 3.3%
- Equity multiple
- 1.24×
- Total profit
- $11,725
- Equity at exit
- $15,044
Cash invested: $48,720 (down + closing). Projections, not guarantees.
Landlord ↔ Tenant lean methodology
- Overall (STATE)
- 27 Tenant-Leaning
- State Maryland
- 27 Tenant-Leaning · D+14
- County
- — inherits STATE
- City
- — inherits STATE
ZIP-level market 21787
- Home prices YoY
- -34.0%
- Active inventory
- 55
- Price-to-rent
- 8.0×
Monthly cashflow live
- Estimated rent
- $1,806 medium interval (Pro) →
- Mortgage (P&I)
- −$912
- Tax from tax record
- −$178 /mo · $2,137/yr
- Insurance
- −$72
- HOA
- −$0
- Vacancy / Maint / Mgmt
- −$379
- Net cashflow
- $264
Break-even live
UW: 25.0% down · 7.5% · 30yr · 1.5% tax · 5.0% vac · 8.0% maint · 8.0% mgmt
Financing live
Cash to close
- Down payment
- $43,500
- Closing costs
- $5,220
- Reserves months
- —
- Total cash needed
- —
Loan-product check · same deal, 3 products live
Conventional
25% down · 7.5% · 30yr
- Down + closing
- —
- Monthly P&I
- —
- Monthly cashflow
- —
- DSCR
- —
- Eligible?
- —
Personal DTI + credit; lowest rate.
DSCR
20% down · 8.5% · 30yr
- Down + closing
- —
- Monthly P&I
- —
- Monthly cashflow
- —
- DSCR
- —
- Eligible?
- —
No personal income docs; deal must DSCR.
Hard money
10% down · 12.0% · 12mo
- Down + closing
- —
- Monthly P&I
- —
- Monthly cashflow
- —
- DSCR
- —
- Eligible?
- —
Short-term bridge; refi at stabilization.
Rent comps 4 comps
| Address | Beds | Baths | Sqft | Rent | $/sqft | DOM | Units | Dist |
|---|---|---|---|---|---|---|---|---|
| 3 Courtland St Unit 3 Taneytown, MD | 2.0 | 1.0 | 1208 | $1,900 | $1.57 | 3d | 1 | 0.25mi |
| 104 Grand Dr Taneytown, MD | 2.0 | 1.0 | 848 | $1,286 | $1.52 | 1d | 1 | 0.52mi |
| 75 Grand Dr Taneytown, MD | 3.0 | 1.5 | 1032 | $1,850 | $1.79 | 18d | 1 | 0.53mi |
| 13 Bristoe Station Rd Taneytown, MD | 3.0 | 2.5 | 1307 | $2,195 | $1.68 | 12d | 1 | 1.14mi |
Listing history 17 events
-
2026-06-18days on market $174,000 Active 120 DOM
-
2026-06-17days on market $174,000 Active 119 DOM
-
2026-06-16days on market $174,000 Active 118 DOM
-
2026-06-15days on market $174,000 Active 117 DOM
-
2026-06-13days on market $174,000 Active 115 DOM
-
2026-06-09days on market $174,000 Active 111 DOM
-
2026-06-08days on market $174,000 Active 110 DOM
-
2026-06-07days on market $174,000 Active 109 DOM
-
2026-06-04days on market $174,000 Active 106 DOM
-
2026-06-03days on market $174,000 Active 105 DOM
-
2026-06-02days on market $174,000 Active 104 DOM
-
2026-06-01days on market $174,000 Active 103 DOM
-
2026-05-31days on market $174,000 Active 102 DOM
-
2026-04-01price $174,000 680-char remark
Show marketing remark (680 chars)
Opportunity knocks with this 3‑bedroom, 1‑bath interior townhouse located in an established Taneytown community. Built in 1978, this property is perfect for investors or owner occupants and ideal for buyers looking for their next project. The home offers a functional floor plan with three bedrooms on the upper level and main‑level living space that can be modernized. The rear of the home provides room for a future patio or outdoor improvement, adding additional value potential. This property presents a strong value‑add opportunity for renovation and resale, rental hold, or long‑term investment. Comparable renovated townhomes in the area support upside for the right buyer.
-
2026-02-18$175,000 Active 680-char remark
Show marketing remark (680 chars)
Opportunity knocks with this 3‑bedroom, 1‑bath interior townhouse located in an established Taneytown community. Built in 1978, this property is perfect for investors or owner occupants and ideal for buyers looking for their next project. The home offers a functional floor plan with three bedrooms on the upper level and main‑level living space that can be modernized. The rear of the home provides room for a future patio or outdoor improvement, adding additional value potential. This property presents a strong value‑add opportunity for renovation and resale, rental hold, or long‑term investment. Comparable renovated townhomes in the area support upside for the right buyer.
-
2026-02-17historical
-
2026-01-07$175,000 Active
ⓘ Source: listings_history table (triggers on properties + properties_extension) + one-shot
backfill from property_details.listing_events for pre-trigger history.
Tax reassessment forecast MD · Partial reset (capped growth)
- Current annual tax
- $2,137 · $178/mo
- Projected year-2 tax
- $2,137 · $178/mo
- Expected delta
- $0/yr ($0/mo · 0.0%)
ⓘ Screening estimate from a state-policy table — verify with the county assessor before closing.
Climate risk First Street
- Flood 1/10 Low FEMA zone X (unshaded) · 0% chance over 30 yrs
- Wildfire 1/10 Low
- Heat 6/10 Major 7 d/yr ≥102°F today · 15 d/yr by 30 yrs out
- Wind 4/10 Moderate 8% chance of damaging wind over 30 yrs
- Air quality 2/10 Low 1 unhealthy d/yr today · 3 by 30 yrs out
Nearby sold comps map
Loading sold comps map…
Walkable amenities ~0.75 mi
Loading nearby amenities…
Taxation est. · year 1
- Rental income
- $21,673
- − Mortgage interest
- −$9,747
- − Property taxes
- −$2,137
- − Insurance
- −$870
- − Repairs & maintenance
- −$1,734
- − Management
- −$1,734
- − Depreciation
- −$5,062
- Taxable income
- $390
- Est. tax owed @ 24.0%
- −$94
- After-tax cash flow
- $3,072/yr
For passive investors: Depreciation is non-cash, so a rental often shows a tax loss while cash-flowing — sheltering income. Rental losses are passive: they offset passive income freely, and up to $25,000/yr can offset ordinary (W-2) income if you actively participate and your MAGI is under $100k (phasing out to $0 by $150k); unused losses carry forward. On sale, claimed depreciation is recaptured at up to 25%, and gains may owe capital-gains tax (a 1031 exchange can defer both). Figures are a year-1 estimate at your 24.0% rate — not tax advice; consult a CPA.
Schools (NCES district)
- District
- Carroll County Public Schools
- NCES district ID
- 2400210
- Math proficiency
- 32% ▼ -25.00%
- Reading proficiency
- 47% ▼ -16.00%
- Median HH income
- $84,594
- Composite
- 37.33/100
- National rank
- #4441
- State rank
- #2 of 24 in MD
Livability — Taneytown
- Score
- 71/100
- State rank
- #149
- US rank
- #6550
Category grades
Schools grade is shown separately in the Schools card above.
Census & demographics
- Census place
- Taneytown, MD
- Population (ZIP)
- 11,549
Population outlook (Carroll County) Hauer SSP2
- Today (2025)
- 169,677 people
- By 2030
- 169,605 · +-0.0%
- By 2040
- 166,205 · -2.0%
- By 2050
- 158,312 · -6.7%
- By 2075
- 143,013 · -15.7%
- By 2100
- 122,431 · -27.8%
Race, ethnicity, and origin ACS 2023
- Neighborhood character
- Predominantly White (86%)
- Race & ethnicity
- White 86% Black 5% Hispanic / Latino 5% Two or more races 4%
- Hispanic origin (detail)
- Common ancestry
- Romanian 1% Slovak 1% Hispanic 1%
- Foreign-born
- 4% · Canada
- Languages at home
- 95% English-only · Spanish 2% French/Haitian/Cajun 1%
Political lean MEDSL · Carroll
- 2024 margin
- Strong R (+24.9) · D 36.2% · R 61.2% · Other 2.6%
- 2008→2024 swing
- +6.2pp toward D · 2008: -31.2pp · 2024: -24.9pp
- All cycles
- 2024: R+24.9 2020: R+23.7 2016: R+36.9 2012: R+34.0 2008: R+31.2
Not yet ingested
- Civics
- —
Market trends
- HPI YoY
- ▼ -132.27%
- Current HPI
- 257.2289
- Rent YoY
- —
- Metro
- —
- State GDP YoY
- ▲ 2.97%
- F500 in state
- 12
Industry mix (Fortune 500 HQ in MD)
| Industry | F500 HQs | Revenue |
|---|---|---|
| Aerospace / Defense | 1 | $71B |
|
||
| Utilities | 1 | $25B |
|
||
| Hotels | 1 | $24B |
|
||
| Consumer Goods | 1 | $7B |
|
||
| Real Estate | 1 | $6B |
|
||
| Chemicals | 1 | $2B |
|
||
Price history
-0.6% since first listed4 events — show timeline
- 2026-04-01 Price Changed $174,000 BRIGHT MLS
- 2026-02-18 Listed $175,000 BRIGHT MLS
- 2026-02-17 Listing Removed — BRIGHT MLS
- 2026-01-07 Listed $175,000 BRIGHT MLS
Property tax history
+2.1%/yrLatest (2025): $2,137 · +5.8% YoY. Source: county tax records.
Cash-flow waterfall
monthlySold comps — $/sqft
last 12 mo · ≤1 miLoading sold comps…