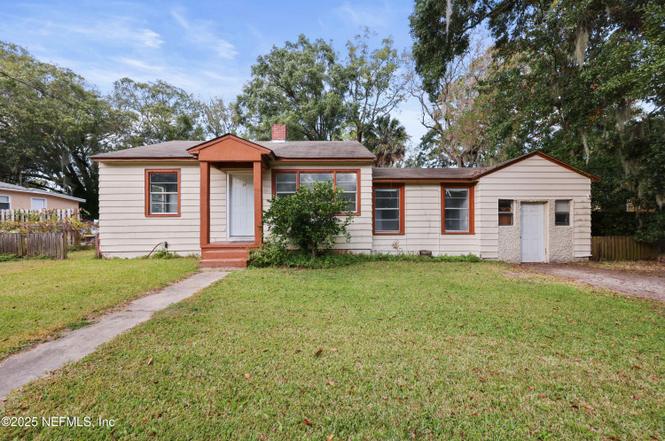
3527 Oleander St · Jacksonville, FL
Flood risk 1/10 · Minimal
- FEMA flood zone
- X (unshaded)
- Chance of flooding over 30 yrs
- 0.0%
- Est. flood insurance / yr
- $507 – $1,088
Fire risk 3/10 · Minor
- Est. fire insurance / yr
- $947 – $1,759
Heat risk 8/10 · Major
- Hot days now (above 107°F)
- 7 days/yr
- Hot days in 30 yrs
- 19 days/yr
Wind risk 9/10 · Severe
- Chance of severe wind over 30 yrs
- 99.0%
Air-quality risk 5/10 · Moderate
- Unhealthy air days now
- 7 days/yr
- Unhealthy air days in 30 yrs
- 7 days/yr
Risk factors via First Street. Map © Google.
Why this score? — see what drove the B grade
The composite is a weighted blend of 9 inputs, each scored 0–100. Each bar is that input's sub-score; the figure is the points it added to the 100-point composite (weight × sub-score).
- Cash flow +23.3/30.0
- ARV discount +15.0/15.0
- DSCR +7.5/10.0
- Appreciation +6.7/10.0
- 1% rule +6.2/10.0
- Livability +4.2/5.0
- Schools +3.9/10.0
- Rent growth +2.9/5.0
- Condition / age +2.5/5.0
$119,000
🖨 Deal sheet 📄 Offer letter ✓ Due diligence
Listing remarks MLS
3 bedroom 1 bath on quiet street. Freshly painted. Priced for quick sale.
Key facts
- 9,147 sq ft lot
- Built 1949
- Listed 211 days
Property features AI
Finance
- Other: Lot size approximately 0.21 acres
- Financial info: Tax information available
- HOA & community: Not a senior community
Exterior
- Parking: Other parking
- Security: Smoke detector(s)
- Utilities: Public sewer; Cable available
- Home design: Single family residence; Residential single-family use; Street frontage on a city street; Asphalt road surface
- Construction: Year built not provided; Construction materials not provided; Roof information not provided; Foundation information not provided
- Exterior features: Back yard fencing; Smoke detector(s)
Interior
- Kitchen: Electric range; Refrigerator; Dishwasher not listed
- Bedrooms: 3 bedrooms
- Flooring: Laminate; Tile
- Bathrooms: 1 full bathroom
- Heating & cooling: Central heating; Central air conditioning
- Interior features: Ceiling fan(s); Entrance foyer; Primary bathroom with tub/shower
- Laundry & utility: Washer; Dryer
Neighborhood map
What this means for you Summary
Snapshot
- This is a 3-bed/1.0-bath single-family listed at $119k.
Deal economics
- At list price, monthly cash flow is $219 ($3k/yr) — positive.
- The deal already cash-flows at list — no discount required.
- Meets the 1% rule at list price ($1k rent vs $119k).
- Recommended offer: $105k (12.0% below list) — sets the bar for market timing.
- Cap rate 8.5% vs local median 4.0% in Jacksonville — top-decile yield for the area; either an underpriced asset or a hidden risk that comps aren't pricing in. Stress-test before assuming the spread holds.
Location & tenants
- Location reads 83/100 on livability (#50 in FL, #911 nationally) — a professional / high-income tenant draw. Strengths: amenities A+, commute A+, housing A+.
- Duval (urban): math 46% / reading 45% proficiency, ranked #48 of 73 in FL (top 66%) — families likely to look elsewhere, expect single-tenant / working-renter base with shorter leases.
- Market conditions: Rents rising (+1.7%/yr); 172 active listings in the ZIP; 40 comparable units currently listed for rent nearby; rentals at typical pace (median 15d on market — plan ~3-4 weeks tenant-placement turnaround); lower-income renter base — watch delinquency; 6,503 units permitted in Duval County in 2024 (1,131 in 5+ unit buildings).
Forward outlook
- In year one you build about $5k of equity ($823 loan paydown + $4k appreciation (3.4% local appreciation)).
- Duval County population projected at +19% by 2050 — long-run rental-demand tailwind backs the buy-and-hold thesis.
- At projected returns (3.4% appreciation + 1.7% rent growth), your $33k cash investment doubles in ~5 years — after that, you're playing with house money.
- By year 7, paydown + projected appreciation supports a ~$31k cash-out refi (75% LTV) — recoverable capital for the next deal without selling this one.
Negotiation context
- It's been on market 211 days — a 12% lower offer ($105k) is reasonable based on typical stale-listing flexibility.
- 3 sale attempts since 9y ago; this cycle's ask has dropped $31k (21%) from the opening price — seller is motivated, your offer sets the floor, not the list.
- Current owner paid $49k; list at $119k implies a 143% gain — meaningful room to come down on a strong offer.
Risks & watch-outs
- Watch-outs: built in 1949 — expect roof / HVAC / electrical / plumbing capex.
- Climate carrying-cost: severe wind risk, 99% chance of damaging wind over 30y; extreme-heat days projected 7→19/yr by 2055 (HVAC capex compounding) — expect insurance premiums to compound above CPI over the hold.
Questions for the listing agent
- It's been on market 211 days. Have you received any prior offers? Is the seller open to a 12% concession, seller financing, or rate buy-down credit?
- Built in 1949 — when were the roof, HVAC, electrical panel, plumbing, and water heater last replaced?
- Why hasn't it sold? Are there any deal-killer items the seller is aware of (foundation, flood, title, zoning, code violations)?
- Is there a deadline driving the sale (1031 exchange, divorce, estate, relocation)? That informs how much negotiation room exists.
- Schools are B-rated — typically a magnet for longer-tenancy family renters. What's the average tenant stay here, and is there a school-zone premium baked into asking?
- What's the average days-on-market for RENTAL listings here right now (not sales)? A rising rental-DOM trend means longer vacancies and softer asking-rent achievability than the comps imply.
- What's the recent tenant-quality profile in this submarket — average credit score on applications, eviction rate, late-payment / NSF rate, and stable-employment percentage? A property-management company in the area should have these aggregated.
- How much new for-sale + rental construction is in the pipeline within 1–3 miles? Heavy new supply typically softens prices + rents 12–24 months out; constrained supply supports both.
Investment metrics
- 1% rule
- 1.12% ✓
- Cap rate
- 8.50%
- Cash-on-cash
- 7.88%
- DSCR
- 1.35
- GRM
- 7.5
CMA / ARV
- ARV (on-the-fly)
- $187,275
- Comps found
- 12
Show comp detail 12 sales within ~0.75 mi
| Address | Dist | Beds/Ba | Sqft | Sold | Price | $/sf | Match |
|---|---|---|---|---|---|---|---|
| 2952 W 8th St | 0.73mi | 3/1.5 | 1,119 (-1%) | 3mo | $95,000 | $85 | 59 |
| 1064 Woodstock Ave | 0.74mi | 4/1.0 (+1) | 1,152 (+2%) | 3mo | $126,400 | $110 | 56 |
| 1050 Hood Ave | 0.74mi | 3/1.0 | 1,051 (-7%) | 4mo | $73,000 | $69 | 50 |
| 3186 W 20th St | 0.70mi | 3/2.0 | 1,209 (+6%) | 4mo | $221,900 | $184 | 49 |
| 5428 Chenango Blvd | 0.67mi | 3/2.0 | 1,209 (+6%) | 6mo | $245,017 | $203 | 49 |
| 5331 Kankakee Blvd | 0.66mi | 3/2.0 | 1,230 (+8%) | 3mo | $239,020 | $194 | 49 |
| 5448 Chenango Blvd | 0.67mi | 3/2.0 | 1,209 (+6%) | 6mo | $243,017 | $201 | 49 |
| 1056 Hood Ave | 0.73mi | 3/1.0 | 1,024 (-10%) | 2mo | $154,500 | $151 | 48 |
| 2118 Detroit St | 0.69mi | 3/2.0 | 1,029 (-9%) | 1mo | $170,000 | $165 | 47 |
| 3125 3rd St Cir S | 0.73mi | 3/2.0 | 1,224 (+8%) | 4mo | $148,500 | $121 | 46 |
| 5307 Kankakee Blvd | 0.66mi | 3/2.0 | 1,230 (+8%) | 7mo | $235,020 | $191 | 46 |
| 1630 Detroit St | 0.72mi | 3/2.0 | 976 (-14%) | 4mo | $106,000 | $109 | 36 |
Match score weights: distance 35% · size 25% · config 20% · recency 20%. Top-matched comps best support the ARV.
Projected returns pro-forma
3.41% appreciation · 1.7% rent growth · sell at horizon
- IRR
- 15.1%
- Equity multiple
- 1.88×
- Total profit
- $29,200
- Equity at exit
- $56,295
- IRR
- 15.9%
- Equity multiple
- 3.37×
- Total profit
- $79,034
- Equity at exit
- $88,989
Cash invested: $33,320 (down + closing). Projections, not guarantees.
Landlord ↔ Tenant lean methodology
- Overall (STATE)
- 87 Strongly Landlord-Friendly
- State Florida
- 87 Strongly Landlord-Friendly · R+3
- County
- — inherits STATE
- City
- — inherits STATE
ZIP-level market 32254
- Home prices YoY
- 1.2%
- Rents YoY
- 1.7%
- Active inventory
- 172
- Price-to-rent
- 7.5×
Monthly cashflow live
- Estimated rent
- $1,330 high interval (Pro) →
- Mortgage (P&I)
- −$624
- Tax from tax record
- −$158 /mo · $1,894/yr
- Insurance
- −$50
- HOA
- −$0
- Vacancy / Maint / Mgmt
- −$279
- Net cashflow
- $219
Break-even live
UW: 25.0% down · 7.5% · 30yr · 1.5% tax · 5.0% vac · 8.0% maint · 8.0% mgmt
Financing live
Cash to close
- Down payment
- $29,750
- Closing costs
- $3,570
- Reserves months
- —
- Total cash needed
- —
Loan-product check · same deal, 3 products live
Conventional
25% down · 7.5% · 30yr
- Down + closing
- —
- Monthly P&I
- —
- Monthly cashflow
- —
- DSCR
- —
- Eligible?
- —
Personal DTI + credit; lowest rate.
DSCR
20% down · 8.5% · 30yr
- Down + closing
- —
- Monthly P&I
- —
- Monthly cashflow
- —
- DSCR
- —
- Eligible?
- —
No personal income docs; deal must DSCR.
Hard money
10% down · 12.0% · 12mo
- Down + closing
- —
- Monthly P&I
- —
- Monthly cashflow
- —
- DSCR
- —
- Eligible?
- —
Short-term bridge; refi at stabilization.
Rent comps 40 comps
| Address | Beds | Baths | Sqft | Rent | $/sqft | DOM | Units | Dist |
|---|---|---|---|---|---|---|---|---|
| 3138 W 15th St Jacksonville, FL | 2.0 | 1.0 | 734 | $1,150 | $1.57 | 24d | 1 | 0.57mi |
| 3138 W 15th St Jacksonville, FL | 2.0 | 1.0 | 734 | $1,150 | $1.57 | 7d | 1 | 0.57mi |
| 3326 W 1st St Jacksonville, FL | 2.0 | 1.0 | 791 | $995 | $1.26 | 24d | 1 | 0.60mi |
| 1305 Melson Ave Jacksonville, FL | 3.0 | 2.0 | 1224 | $1,399 | $1.14 | 20d | 1 | 0.62mi |
| 3078 W 15th St Jacksonville, FL | 3.0 | 1.0 | 1128 | $1,200 | $1.06 | 24d | 1 | 0.64mi |
| 1612 Alfen St Jacksonville, FL | 3.0 | 1.5 | 945 | $1,113 | $1.18 | 7d | 1 | 0.66mi |
| 3101 3rd Street Cir N Jacksonville, FL | 2.0 | 1.0 | 870 | $1,150 | $1.32 | 7d | 1 | 0.73mi |
| 3055 2nd Street Cir Jacksonville, FL | 3.0 | 1.5 | 1050 | $1,340 | $1.28 | 17d | 1 | 0.75mi |
| 3004 W 16th St Unit 1 Jacksonville, FL | 3.0 | 2.0 | 1456 | $1,526 | $1.05 | 24d | 1 | 0.76mi |
| 2939 W 11th St Jacksonville, FL | 3.0 | 1.0 | 1086 | $1,295 | $1.19 | 24d | 1 | 0.76mi |
| 2939 W 6th St Jacksonville, FL | 3.0 | 2.0 | 1269 | $1,225 | $0.97 | 2d | 1 | 0.77mi |
| 1227 Dena St Jacksonville, FL | 3.0 | 1.0 | 1033 | $1,325 | $1.28 | 24d | 1 | 0.78mi |
| 2965 Sunset St Jacksonville, FL | 3.0 | 2.0 | 1056 | $1,375 | $1.30 | 4d | 1 | 0.79mi |
| 2965 Sunset St Jacksonville, FL | 3.0 | 1.5 | 1056 | $1,375 | $1.30 | 7d | 1 | 0.79mi |
| 5239 Potomac Ave Jacksonville, FL | 3.0 | 2.0 | 1392 | $1,432 | $1.03 | 7d | 1 | 0.79mi |
| 1021 Woodstock Ave Jacksonville, FL | 3.0 | 2.0 | 1012 | $1,495 | $1.48 | 24d | 1 | 0.82mi |
| 1021 Woodstock Ave Jacksonville, FL | 3.0 | 2.0 | 1012 | $1,495 | $1.48 | 7d | 1 | 0.82mi |
| 3034 Detroit Cir E Jacksonville, FL | 3.0 | 2.0 | 1300 | $1,399 | $1.08 | 24d | 1 | 0.87mi |
| 2902 W 5th St Jacksonville, FL | 3.0 | 2.0 | 1379 | $1,050 | $0.76 | 7d | 1 | 0.87mi |
| 2854 Wickwire St Jacksonville, FL | 2.0 | 1.0 | 948 | $1,300 | $1.37 | 4d | 1 | 0.88mi |
| 5141 Shenandoah Ave Jacksonville, FL | 1.0–3.0 | 1.0–2.0 | 950 | $1,200 | $1.26 | 2d | 4 | 0.91mi |
| 3368 Columbus Ave Jacksonville, FL | 2.0 | 1.0 | 955 | $1,300 | $1.36 | 4d | 1 | 0.92mi |
| 2913 W 2nd St Jacksonville, FL | 2.0 | 1.0 | 720 | $1,000 | $1.39 | 2d | 1 | 0.93mi |
| 5236 Wabash Blvd Jacksonville, FL | 2.0 | 1.0 | 712 | $999 | $1.40 | 20d | 1 | 0.95mi |
| 3450 Lowell Ave Jacksonville, FL | 3.0 | 2.0 | 1209 | $1,578 | $1.31 | 24d | 1 | 0.98mi |
| 2862 W 1st St Unit 1 Jacksonville, FL | 2.0 | 1.0 | 800 | $895 | $1.12 | 14d | 1 | 1.00mi |
| 2862 W 1st St Jacksonville, FL | 2.0 | 1.0 | 800 | $895 | $1.12 | 4d | 1 | 1.00mi |
| 1037 Detroit St Jacksonville, FL | 3.0 | 2.0 | 912 | $1,250 | $1.37 | 2d | 1 | 1.00mi |
| 2852 W 1st St Jacksonville, FL | 2.0 | 1.0 | 800 | $895 | $1.12 | 7d | 1 | 1.02mi |
| 2851 Sophia St Jacksonville, FL | 2.0 | 1.0 | 846 | $1,000 | $1.18 | 24d | 3 | 1.06mi |
| 3303 Broadway Ave Jacksonville, FL | 3.0 | 2.0 | 1072 | $1,550 | $1.45 | 4d | 1 | 1.08mi |
| 5364 Mary Budd Ave Jacksonville, FL | 3.0 | 2.0 | 836 | $1,225 | $1.47 | 3d | 1 | 1.11mi |
| 5148 Cain Ln Jacksonville, FL | 3.0 | 1.0 | 1104 | $1,306 | $1.18 | 21d | 1 | 1.15mi |
| 3433 Brookhaven Dr Jacksonville, FL | 2.0 | 1.0 | 754 | $1,295 | $1.72 | 7d | 1 | 1.15mi |
| 3305 Sunnybrook Ave N Jacksonville, FL | 2.0 | 1.0 | 1012 | $1,021 | $1.01 | 24d | 1 | 1.20mi |
| 3350 Sunnybrook Ave N Jacksonville, FL | 2.0 | 1.0 | 900 | $1,095 | $1.22 | 24d | 1 | 1.21mi |
| 3012 Imperial St Jacksonville, FL | 3.0 | 1.0 | 1089 | $1,395 | $1.28 | 24d | 1 | 1.21mi |
| 912 Huron St Jacksonville, FL | 2.0 | 1.0 | 900 | $1,100 | $1.22 | 14d | 1 | 1.29mi |
| 5355 New Kings Rd Unit 21 Jacksonville, FL | 2.0 | 1.0 | 700 | $800 | $1.14 | 4d | 1 | 1.38mi |
| 841 Ontario St Jacksonville, FL | 2.0 | 1.0 | 1000 | $1,285 | $1.28 | 24d | 1 | 1.45mi |
Listing history 22 events
-
2026-06-17status $119,000 Pending 211 DOM
-
2026-06-17days on market $119,000 Active 211 DOM
-
2026-06-16days on market $119,000 Active 210 DOM
-
2026-06-15days on market $119,000 Active 209 DOM
-
2026-06-10status $119,000 Active 203 DOM
-
2026-06-08status $119,000 Pending 203 DOM
-
2026-06-03days on market $119,000 Active 203 DOM
-
2026-06-02days on market $119,000 Active 202 DOM
-
2026-06-01days on market $119,000 Active 201 DOM
-
2026-05-31days on market $119,000 Active 200 DOM
-
2026-05-04price $119,000
-
2026-04-07price $129,500
-
2026-03-11price $139,900
-
2026-02-27status Active
-
2026-02-25status Pending
-
2025-11-10$150,000 Active
-
2018-01-08soldstatus $49,000
-
2018-01-05soldstatus $49,000 Sold 75-char remark
Show marketing remark (75 chars)
3 bedroom 1 bath on quiet street. Freshly painted. Priced for quick sale.
-
2017-10-26status Pending 75-char remark
Show marketing remark (75 chars)
3 bedroom 1 bath on quiet street. Freshly painted. Priced for quick sale.
-
2017-09-26historical 75-char remark
Show marketing remark (75 chars)
3 bedroom 1 bath on quiet street. Freshly painted. Priced for quick sale.
-
2017-08-03$42,000 Active 75-char remark
Show marketing remark (75 chars)
3 bedroom 1 bath on quiet street. Freshly painted. Priced for quick sale.
-
1987-08-01soldstatus $33,900
ⓘ Source: listings_history table (triggers on properties + properties_extension) + one-shot
backfill from property_details.listing_events for pre-trigger history.
Tax reassessment forecast FL · Resets to sale price
- Current annual tax
- $1,894 · $158/mo
- Projected year-2 tax
- $1,894 · $158/mo
- Expected delta
- $0/yr ($0/mo · -0.0%)
ⓘ Screening estimate from a state-policy table — verify with the county assessor before closing.
Climate risk First Street
- Flood 1/10 Low FEMA zone X (unshaded) · 0% chance over 30 yrs
- Wildfire 3/10 Moderate
- Heat 8/10 Severe 7 d/yr ≥107°F today · 19 d/yr by 30 yrs out
- Wind 9/10 Extreme 99% chance of damaging wind over 30 yrs
- Air quality 5/10 Major 7 unhealthy d/yr today · 7 by 30 yrs out
Nearby sold comps map
Loading sold comps map…
Walkable amenities ~0.75 mi
Loading nearby amenities…
Taxation est. · year 1
- Rental income
- $15,954
- − Mortgage interest
- −$6,666
- − Property taxes
- −$1,894
- − Insurance
- −$595
- − Repairs & maintenance
- −$1,276
- − Management
- −$1,276
- − Depreciation
- −$3,462
- Taxable income
- $784
- Est. tax owed @ 24.0%
- −$188
- After-tax cash flow
- $2,437/yr
For passive investors: Depreciation is non-cash, so a rental often shows a tax loss while cash-flowing — sheltering income. Rental losses are passive: they offset passive income freely, and up to $25,000/yr can offset ordinary (W-2) income if you actively participate and your MAGI is under $100k (phasing out to $0 by $150k); unused losses carry forward. On sale, claimed depreciation is recaptured at up to 25%, and gains may owe capital-gains tax (a 1031 exchange can defer both). Figures are a year-1 estimate at your 24.0% rate — not tax advice; consult a CPA.
Schools (NCES district)
- District
- Duval
- NCES district ID
- 1200480
- Math proficiency
- 46% ▼ -11.00%
- Reading proficiency
- 45% ▼ -4.00%
- Median HH income
- $48,987
- Composite
- 38.97/100
- National rank
- #4076
- State rank
- #48 of 73 in FL
Livability — Jacksonville
- Score
- 83/100
- State rank
- #50
- US rank
- #911
Category grades
Schools grade is shown separately in the Schools card above.
Census & demographics
- Census place
- Jacksonville, FL
- County
- Duval County · 1,015,274 people
- City population
- 979,034
- Metro
- Jacksonville, FL
- Population (ZIP)
- 13,927
- Household income
- $34,953
- Rent vs Own
- Severe rent burden
- 882.0
Population outlook (Duval County) Hauer SSP2
- Today (2025)
- 1,013,010 people
- By 2030
- 1,059,228 · +4.6%
- By 2040
- 1,141,439 · +12.7%
- By 2050
- 1,205,258 · +19.0%
- By 2075
- 1,324,282 · +30.7%
- By 2100
- 1,319,620 · +30.3%
Race, ethnicity, and origin ACS 2023
- Neighborhood character
- Diverse neighborhood (Simpson 0.56)
- Race & ethnicity
- Black 60% White 28% Two or more races 7% Hispanic / Latino 5%
- Hispanic origin (detail)
- Puerto Rican 1%
- Common ancestry
- Slovak 1% Hispanic 1% Lithuanian 1%
- Foreign-born
- 4% · Canada
- Languages at home
- 94% English-only · Spanish 4% French/Haitian/Cajun 2%
Political lean MEDSL · Duval
- 2024 margin
- Toss-up / Even · D 48.7% · R 50.1% · Other 1.2%
- 2008→2024 swing
- +0.4pp no change · 2008: -1.9pp · 2024: -1.5pp
- All cycles
- 2024: R+1.5 2020: D+3.8 2016: R+1.5 2012: R+3.6 2008: R+1.9
Not yet ingested
- Civics
- —
Market trends
- HPI YoY
- ▲ 3.41%
- Current HPI
- 282.2981
- Rent YoY
- ▲ 1.70%
- Metro
- Jacksonville, FL
- State GDP YoY
- ▲ 3.28%
- F500 in state
- 36
Industry mix (Fortune 500 HQ in FL)
| Industry | F500 HQs | Revenue |
|---|---|---|
| Industrial Technology | 2 | $29B |
|
||
| Insurance | 2 | $17B |
|
||
| Retail | 1 | $60B |
|
||
| Technology Distribution | 1 | $58B |
|
||
| Homebuilding | 1 | $35B |
|
||
| Technology Manufacturing | 1 | $35B |
|
||
Price history
+251.0% since first listed12 events — show timeline
- 2026-05-04 Price Changed $119,000 realMLS
- 2026-04-07 Price Changed $129,500 realMLS
- 2026-03-11 Price Changed $139,900 realMLS
- 2026-02-27 Relisted — realMLS
- 2026-02-25 Pending — realMLS
- 2025-11-10 Listed $150,000 realMLS
- 2018-01-08 Sold (Public Records) $49,000 Public Records
- 2018-01-05 Sold (MLS) $49,000 realMLS
- 2017-10-26 Pending — realMLS
- 2017-09-26 Listing Removed — realMLS
- 2017-08-03 Listed $42,000 realMLS
- 1987-08-01 Sold (Public Records) $33,900 Public Records
Property tax history
+17.8%/yrLatest (2025): $1,894 · +18.0% YoY. Source: county tax records.
Cash-flow waterfall
monthlySold comps — $/sqft
last 12 mo · ≤1 miLoading sold comps…