275 Beechwood · Warsaw, KY
Flood risk No data
- FEMA flood zone
- —
- Chance of flooding over 30 yrs
- —
- Est. flood insurance / yr
- —
Fire risk No data
- Est. fire insurance / yr
- —
Heat risk No data
- Hot days now (above threshold)
- —
- Hot days in 30 yrs
- —
Wind risk No data
- Chance of severe wind over 30 yrs
- —
Air-quality risk No data
- Unhealthy air days now
- —
- Unhealthy air days in 30 yrs
- —
Risk factors via First Street. Map © Google.
Why this score? — see what drove the D+ grade
The composite is a weighted blend of 9 inputs, each scored 0–100. Each bar is that input's sub-score; the figure is the points it added to the 100-point composite (weight × sub-score).
- 1% rule +9.7/10.0
- Appreciation +9.2/10.0
- Cash flow +8.2/30.0
- ARV discount +7.5/15.0
- Condition / age +3.8/5.0
- Livability +3.1/5.0
- Rent growth +2.5/5.0
- DSCR +2.2/10.0
- Schools +2.2/10.0
$70,995
🖨 Deal sheet 📄 Offer letter ✓ Due diligence
Listing remarks
Just Listed! 218 Beechwood 2026 Champion Prime Vertex - 3 Bed, 2 Bath Built for modern, low maintenance living, this brand new single width Vertex model features a well balanced 16×66' layout with an open living space, contemporary kitchen, and three comfortable bedrooms. The bright interior, clean finishes, and efficient design make this home both practical and inviting from day one. Community amenities include a clubhouse, pond, picnic area, and very quiet streets.
Key facts
- Contemporary kitchen
- Clubhouse
- Pond
Tags
Property features AI
Finance
- Other: Address: 275 Beechwood, Warsaw KY 41095; Listing status: Active; Last updated: 2026-05-13
- Financial info: List price $70,995
- HOA & community: Association fee of 400
Exterior
- Home design: Spec inventory, plan name: Vertex (Asbury Pointe)
Interior
- Bedrooms: 3 bedrooms
- Bathrooms: 2 bathrooms (full)
- Interior features: Living area of 1,001
Neighborhood map
What this means for you Summary
Snapshot
- This is a 3-bed/2.0-bath manufactured listed at $71k. Condition is rated good.
Deal economics
- At list price, monthly cash flow is $-66 ($-788/yr) — negative.
- To cash-flow at today's rent, offer at most $61k (13.4% below list).
- Meets the 1% rule at list price ($1k rent vs $71k).
- Recommended offer: $61k (13.4% below list) — sets the bar for cash-flow.
Location & tenants
- Location reads 61/100 on livability (#376 in KY) — a middle-class / working-renter tenant base. Strengths: cost of living A+, housing A+, crime B+; Watch: employment D+, schools D, amenities F.
- Gallatin County (rural): math 20% / reading 31% proficiency, ranked #137 of 165 in KY (top 83%) — low school quality limits family demand, transient renter base, plan for 1-2y turnover; 62% free/reduced lunch — lower-income household profile, screen leases tightly.
- Market conditions: 46 active listings in the ZIP; 56 units permitted in Gallatin County in 2024 (0 in 5+ unit buildings).
Forward outlook
- In year one you build about $6k of equity ($491 loan paydown + $6k appreciation (8.4% local appreciation)).
- Gallatin County population projected to shrink 6% by 2050 — rents likely to lag national; underwrite the cash flow, not the appreciation.
- At projected returns (8.4% appreciation + 3.0% rent growth), your $20k cash investment doubles in ~4 years — after that, you're playing with house money.
- By year 6, paydown + projected appreciation supports a ~$37k cash-out refi (75% LTV) — recoverable capital for the next deal without selling this one.
Negotiation context
- It's been on market 36 days — a 3% lower offer ($69k) is reasonable based on typical stale-listing flexibility.
Risks & watch-outs
- Watch-outs: HOA is 38% of rent.
Questions for the listing agent
- What do current leases actually rent for vs. the listed asking? Can we see a recent rent roll and the last 12 months of T-12 income?
- It's been on market 36 days. Have you received any prior offers? Is the seller open to a 13% concession, seller financing, or rate buy-down credit?
- What does the HOA fee cover, when was the last increase, and are there any pending special assessments or reserve-fund shortfalls?
- Is there a deadline driving the sale (1031 exchange, divorce, estate, relocation)? That informs how much negotiation room exists.
- Schools are D-rated, which usually means shorter tenancies and higher turnover. Who's the typical renter profile here, and what's been the actual vacancy rate?
- The area grade is low — what's the realistic commute time and amenity access for the typical tenant pool here? Any planned neighborhood developments (good or bad) we should know about?
- What's the average days-on-market for RENTAL listings here right now (not sales)? A rising rental-DOM trend means longer vacancies and softer asking-rent achievability than the comps imply.
- What's the recent tenant-quality profile in this submarket — average credit score on applications, eviction rate, late-payment / NSF rate, and stable-employment percentage? A property-management company in the area should have these aggregated.
- How much new for-sale + rental construction is in the pipeline within 1–3 miles? Heavy new supply typically softens prices + rents 12–24 months out; constrained supply supports both.
Investment metrics
- 1% rule
- 1.47% ✓
- Cap rate
- 5.18%
- Cash-on-cash
- -3.96%
- DSCR
- 0.82
- GRM
- 5.7
CMA / ARV
No comps found within radius.
Projected returns pro-forma
8.37% appreciation · 3.0% rent growth · sell at horizon
- IRR
- 18.0%
- Equity multiple
- 2.36×
- Total profit
- $27,029
- Equity at exit
- $55,749
- IRR
- 17.1%
- Equity multiple
- 5.13×
- Total profit
- $82,166
- Equity at exit
- $112,436
Cash invested: $19,879 (down + closing). Projections, not guarantees.
Landlord ↔ Tenant lean methodology
- Overall (STATE)
- 83 Strongly Landlord-Friendly
- State Kentucky
- 83 Strongly Landlord-Friendly · R+16
- County
- — inherits STATE
- City
- — inherits STATE
ZIP-level market 41095
- Home prices YoY
- 2.9%
- Active inventory
- 46
- Price-to-rent
- 5.7×
Monthly cashflow live
- Estimated rent
- $1,044 medium interval (Pro) →
- Mortgage (P&I)
- −$372
- Tax est. 1.5%
- −$89 /mo · $1,065/yr
- Insurance
- −$30
- HOA
- −$400
- Vacancy / Maint / Mgmt
- −$219
- Net cashflow
- $-66
Break-even live
UW: 25.0% down · 7.5% · 30yr · 1.5% tax · 5.0% vac · 8.0% maint · 8.0% mgmt
Financing live
Cash to close
- Down payment
- $17,749
- Closing costs
- $2,130
- Reserves months
- —
- Total cash needed
- —
Loan-product check · same deal, 3 products live
Conventional
25% down · 7.5% · 30yr
- Down + closing
- —
- Monthly P&I
- —
- Monthly cashflow
- —
- DSCR
- —
- Eligible?
- —
Personal DTI + credit; lowest rate.
DSCR
20% down · 8.5% · 30yr
- Down + closing
- —
- Monthly P&I
- —
- Monthly cashflow
- —
- DSCR
- —
- Eligible?
- —
No personal income docs; deal must DSCR.
Hard money
10% down · 12.0% · 12mo
- Down + closing
- —
- Monthly P&I
- —
- Monthly cashflow
- —
- DSCR
- —
- Eligible?
- —
Short-term bridge; refi at stabilization.
HOA detail
- Monthly dues
- $400 · $4,800/yr
Listing history 15 events
-
2026-06-18days on market $70,995 Active 36 DOM
-
2026-06-17days on market $70,995 Active 35 DOM
-
2026-06-16days on market $70,995 Active 34 DOM
-
2026-06-15days on market $70,995 Active 33 DOM
-
2026-06-13days on market $70,995 Active 31 DOM
-
2026-06-12days on market $70,995 Active 30 DOM
-
2026-06-09days on market $70,995 Active 27 DOM
-
2026-06-08days on market $70,995 Active 26 DOM
-
2026-06-07days on market $70,995 Active 25 DOM
-
2026-06-07days on market $70,995 Active 24 DOM
-
2026-06-04days on market $70,995 Active 21 DOM
-
2026-06-02days on market $70,995 Active 20 DOM
-
2026-06-01days on market $70,995 Active 19 DOM
-
2026-05-31days on market $70,995 Active 18 DOM
-
2026-05-31days on market $70,995 Active 17 DOM
ⓘ Source: listings_history table (triggers on properties + properties_extension) + one-shot
backfill from property_details.listing_events for pre-trigger history.
Nearby sold comps map
Loading sold comps map…
Walkable amenities ~0.75 mi
Loading nearby amenities…
Taxation est. · year 1
- Rental income
- $12,531
- − Mortgage interest
- −$3,977
- − Property taxes
- −$1,065
- − Insurance
- −$355
- − Repairs & maintenance
- −$1,002
- − Management
- −$1,002
- − HOA
- −$4,800
- − Depreciation
- −$2,065
- Taxable loss
- −$1,736
- Est. tax savings @ 24.0%
- +$417
- After-tax cash flow
- $-371/yr
For passive investors: Depreciation is non-cash, so a rental often shows a tax loss while cash-flowing — sheltering income. Rental losses are passive: they offset passive income freely, and up to $25,000/yr can offset ordinary (W-2) income if you actively participate and your MAGI is under $100k (phasing out to $0 by $150k); unused losses carry forward. On sale, claimed depreciation is recaptured at up to 25%, and gains may owe capital-gains tax (a 1031 exchange can defer both). Figures are a year-1 estimate at your 24.0% rate — not tax advice; consult a CPA.
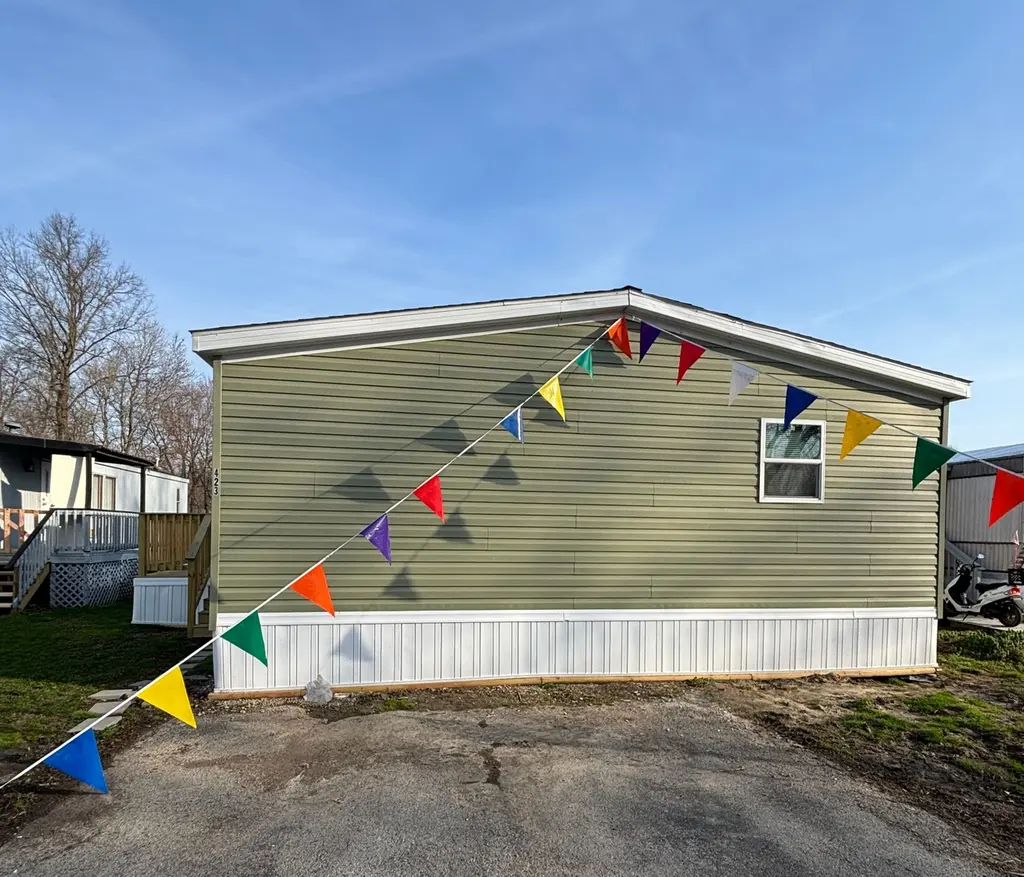
Condition & rehab AI · 3 photos
This single-width Vertex model is in good condition with modern finishes and efficient design, making it a practical and inviting home. Minor exterior painting and landscaping improvements can further enhance its value.
Value-add opportunities
- Both Landscaping improvements — Enhanced curb appeal and increased property value.
- Both Painting the exterior siding — Fresh paint can improve the home's appearance and value.
- Both Landscaping improvements — Enhanced curb appeal and increased property value.
Renovation cost estimate screening
Value-add ROI direction
- Both Landscaping improvements — Enhanced curb appeal and increased property value. ↑
- Both Painting the exterior siding — Fresh paint can improve the home's appearance and value. ↑
- Both Landscaping improvements — Enhanced curb appeal and increased property value. ↑
ⓘ Cost ranges are severity-bucket heuristics (US national rule-of-thumb). Get contractor quotes + a written scope before underwriting a rehab budget.
Schools (NCES district)
- District
- Gallatin County
- NCES district ID
- 2102130
- Math proficiency
- 20% ▼ -15.00%
- Reading proficiency
- 31% ▼ -16.00%
- Median HH income
- $46,041
- Composite
- 22.05/100
- National rank
- #8195
- State rank
- #137 of 165 in KY
Livability — Warsaw
- Score
- 61/100
- State rank
- #376
- US rank
- #17814
Category grades
Schools grade is shown separately in the Schools card above.
Census & demographics
- Population (ZIP)
- 3,775
Population outlook (Gallatin County) Hauer SSP2
- Today (2025)
- 8,658 people
- By 2030
- 8,616 · -0.5%
- By 2040
- 8,410 · -2.9%
- By 2050
- 8,140 · -6.0%
- By 2075
- 7,308 · -15.6%
- By 2100
- 6,671 · -22.9%
Race, ethnicity, and origin ACS 2023
- Neighborhood character
- Predominantly White (82%)
- Race & ethnicity
- White 82% Hispanic / Latino 7% Black 6% Two or more races 5% Asian 1%
- Hispanic origin (detail)
- Mexican 7%
- Common ancestry
- Slovak 1% Italian 1% Scottish 1%
- Foreign-born
- 4% · Canada
- Languages at home
- 93% English-only · Spanish 6% French/Haitian/Cajun 0%
Political lean MEDSL · Gallatin
- 2024 margin
- Solid R (+59.9) · D 19.4% · R 79.4% · Other 1.2%
- 2008→2024 swing
- -42.3pp toward R · 2008: -17.6pp · 2024: -59.9pp
- All cycles
- 2024: R+59.9 2020: R+55.4 2016: R+50.8 2012: R+17.0 2008: R+17.6
Not yet ingested
- Civics
- —
Market trends
- HPI YoY
- ▲ 8.37%
- Current HPI
- 293.2896
- Rent YoY
- —
- Metro
- —
- State GDP YoY
- ▲ 1.81%
- F500 in state
- 4
Industry mix (Fortune 500 HQ in KY)
| Industry | F500 HQs | Revenue |
|---|---|---|
| Healthcare | 1 | $118B |
|
||
| Food / Beverage | 1 | $7B |
|
||
Cash-flow waterfall
monthlySold comps — $/sqft
last 12 mo · ≤1 miLoading sold comps…