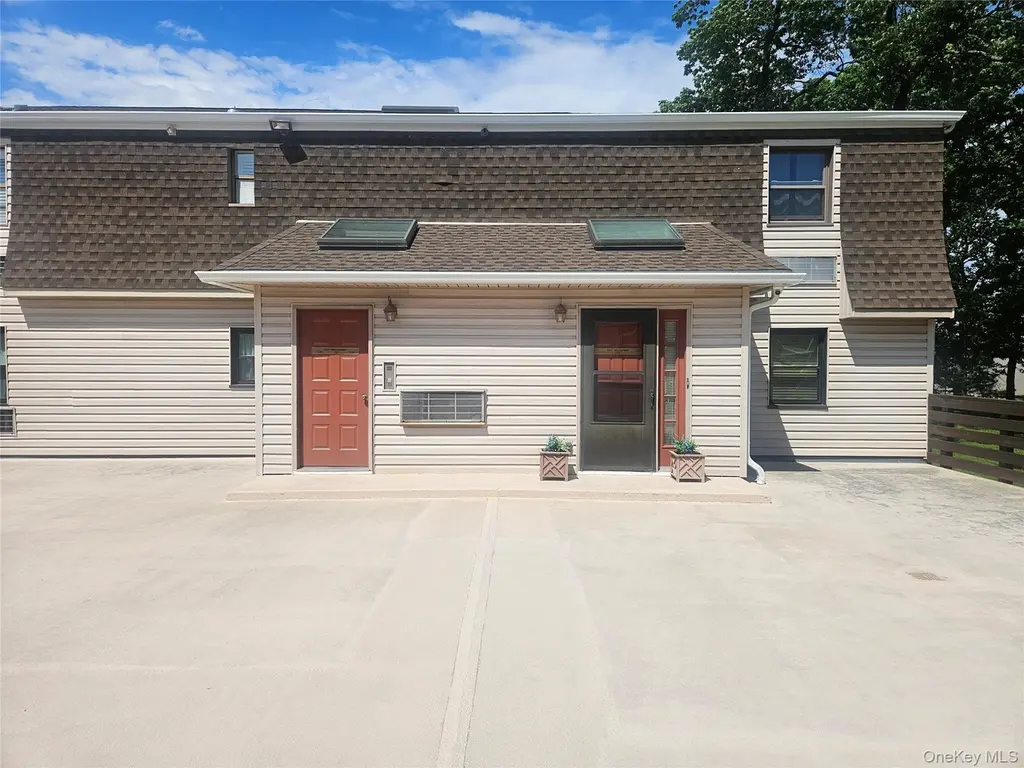
1337 Broadway Unit C10 · Hewlett, NY
Flood risk 1/10 · Minimal
- FEMA flood zone
- X (unshaded)
- Chance of flooding over 30 yrs
- 0.0%
- Est. flood insurance / yr
- $473 – $860
Fire risk 1/10 · Minimal
- Est. fire insurance / yr
- $691 – $1,283
Heat risk 6/10 · Moderate
- Hot days now (above 95°F)
- 7 days/yr
- Hot days in 30 yrs
- 16 days/yr
Wind risk 6/10 · Moderate
- Chance of severe wind over 30 yrs
- 70.0%
Air-quality risk 4/10 · Minor
- Unhealthy air days now
- 4 days/yr
- Unhealthy air days in 30 yrs
- 6 days/yr
Risk factors via First Street. Map © Google.
Why this score? — see what drove the D- grade
The composite is a weighted blend of 9 inputs, each scored 0–100. Each bar is that input's sub-score; the figure is the points it added to the 100-point composite (weight × sub-score).
- 1% rule +8.8/10.0
- ARV discount +7.5/15.0
- Schools +7.0/10.0
- Livability +4.5/5.0
- Condition / age +3.8/5.0
- Rent growth +2.5/5.0
- Cash flow +1.9/30.0
- DSCR +0.0/10.0
- Appreciation +0.0/10.0
$269,500
🖨 Deal sheet 📄 Offer letter ✓ Due diligence
Listing remarks
Welcome to #C10! Unique in itself, this 1st floor, two bedroom/two bathroom CO-OP stands out from the rest. Upon entrance be welcomed with a skylighted foyer providing natural light exposure. The spacious living room/dining room boasts laminate flooring with recessed lighting throughout. In unit washer+dryer makes the convenience of doing laundry hassle-free. Kitchen features Stainless Steel Appliances with textured tile flooring. Every room emcompasses a closet, with the primary en-suite bedroom featuring two walk-ins. Moreover each bathroom exhibits distinctive captivating design! Newly installed windows (1 yrs old) and roof (2 yrs old). Not to mention two designated parking spaces (garag
Key facts
- Laminate flooring
- Skylighted foyer
- In unit washer dryer
Tags
Property features AI
Finance
- HOA & community: Association managed by Einsidler Management; Association maintains grounds, provides snow removal and trash service
Exterior
- Parking: Assigned parking; Garage (1 garage space); Parking lot; Total 2 parking spaces
- Utilities: Electric service provided by PSEG; Public sewer; Electricity available
- Home design: Stock cooperative; First-floor entry
- Construction: Vinyl siding construction
- Exterior features: Vinyl siding; Not waterfront
Interior
- Kitchen: Dishwasher; Electric range; Microwave; Refrigerator; Stainless steel appliances
- Bedrooms: Located on first floor
- Flooring: Carpet; Laminate
- Bathrooms: 2 full bathrooms
- Heating & cooling: Electric heating; Electric cooling
- Interior features: Entrance foyer; Recessed lighting; Walk-in closet(s)
- Laundry & utility: In-unit washer and dryer
Neighborhood map
What this means for you Summary
Snapshot
- This is a 2-bed/2.0-bath condo listed at $270k. Condition is rated good.
Deal economics
- At list price, monthly cash flow is $-1k ($-12k/yr) — negative.
- The deal already cash-flows at list — no discount required.
- Meets the 1% rule at list price ($4k rent vs $270k).
- Recommended offer: $265k (1.5% below list) — sets the bar for market timing.
- Cap rate 1.8% vs local median 2.7% in Hewlett — below-typical yield; the buyer is paying a premium for something (appreciation thesis, condition, location) that the cap rate doesn't capture.
Location & tenants
- Location reads 89/100 on livability (#7 in NY, #165 nationally) — a professional / high-income tenant draw. Strengths: crime A+, amenities A+, commute A+; Watch: cost of living F.
- Hewlett-Woodmere Union Free School District (suburban): math 72% / reading 79% proficiency, ranked #59 of 590 in NY (top 10%) — strong family-tenant draw, lease renewals of 3-5y typical; only 12% free/reduced lunch — higher-income household profile.
- Zoned schools: Hewlett Elementary School (math 57% / reading 72%, grade B, #591 of 2,108 statewide, top 31%, 403 students, 26% FRL); Woodmere Middle School (math 62% / reading 73%, grade A-, #98 of 729 statewide, top 14%, 716 students, 26% FRL); George W Hewlett High School (math 95% / reading 97%, grade A+, #68 of 1,100 statewide, top 6%, 999 students, 26% FRL).
- Market conditions: 71 active listings in the ZIP; 14 comparable units currently listed for rent nearby; rentals at typical pace (median 24d on market — plan ~3-4 weeks tenant-placement turnaround); 824 units permitted in Nassau County in 2024 (153 in 5+ unit buildings).
Forward outlook
- Local home prices are declining (-3.0%/yr); year-one equity from $2k of loan paydown is wiped out by about $8k of value loss. Plan a longer hold.
- Nassau County population projected at +7% by 2050 — modest demand growth; plan on rents tracking national, not racing it.
Negotiation context
- It's been on market 16 days — a 2% lower offer ($265k) is reasonable based on typical stale-listing flexibility.
Risks & watch-outs
- Watch-outs: HOA is 56% of rent; built in 1951 — expect roof / HVAC / electrical / plumbing capex.
- Climate carrying-cost: major wind risk, 70% chance of damaging wind over 30y; extreme-heat days projected 7→16/yr by 2055 (HVAC capex compounding) — expect insurance premiums to compound above CPI over the hold.
Questions for the listing agent
- What do current leases actually rent for vs. the listed asking? Can we see a recent rent roll and the last 12 months of T-12 income?
- Built in 1951 — when were the roof, HVAC, electrical panel, plumbing, and water heater last replaced?
- What does the HOA fee cover, when was the last increase, and are there any pending special assessments or reserve-fund shortfalls?
- Any open or pending special assessments — roof, HVAC, plumbing, elevator, façade? What's the per-unit balance and payoff schedule, and is the seller paying it off at close or rolling it to the buyer?
- Is there a deadline driving the sale (1031 exchange, divorce, estate, relocation)? That informs how much negotiation room exists.
- Schools are A-rated — typically a magnet for longer-tenancy family renters. What's the average tenant stay here, and is there a school-zone premium baked into asking?
- The area grade is low — what's the realistic commute time and amenity access for the typical tenant pool here? Any planned neighborhood developments (good or bad) we should know about?
- What's the average days-on-market for RENTAL listings here right now (not sales)? A rising rental-DOM trend means longer vacancies and softer asking-rent achievability than the comps imply.
- What's the recent tenant-quality profile in this submarket — average credit score on applications, eviction rate, late-payment / NSF rate, and stable-employment percentage? A property-management company in the area should have these aggregated.
- How much new apartment / multifamily construction is in the pipeline within 1–3 miles? Heavy new supply (>2% of stock underway) typically softens rents 12–24 months out; light construction supports rent growth.
Investment metrics
- 1% rule
- 1.38% ✓
- Cap rate
- 1.80%
- Cash-on-cash
- -16.03%
- DSCR
- 0.29
- GRM
- 6.0
CMA / ARV
No comps found within radius.
Projected returns pro-forma
-3.0% appreciation · 3.0% rent growth · sell at horizon
- IRR
- -46.4%
- Equity multiple
- -0.41×
- Total profit
- $-106,532
- Equity at exit
- $40,183
- IRR
- -79.3%
- Equity multiple
- -1.25×
- Total profit
- $-169,988
- Equity at exit
- $23,301
Cash invested: $75,460 (down + closing). Projections, not guarantees.
Landlord ↔ Tenant lean methodology
- Overall (STATE)
- 15 Strongly Tenant-Friendly
- State New York
- 15 Strongly Tenant-Friendly · D+10
- County
- — inherits STATE
- City
- — inherits STATE
ZIP-level market 11557
- Active inventory
- 71
- Price-to-rent
- 6.0×
Monthly cashflow live
- Estimated rent
- $3,728 high interval (Pro) →
- Mortgage (P&I)
- −$1,413
- Tax est. 1.5%
- −$337 /mo · $4,042/yr
- Insurance
- −$112
- HOA est. from 2 same-building comps
- −$2,091
- Vacancy / Maint / Mgmt
- −$783
- Net cashflow
- $-1,008
Break-even live
UW: 25.0% down · 7.5% · 30yr · 1.5% tax · 5.0% vac · 8.0% maint · 8.0% mgmt
Financing live
Cash to close
- Down payment
- $67,375
- Closing costs
- $8,085
- Reserves months
- —
- Total cash needed
- —
Loan-product check · same deal, 3 products live
Conventional
25% down · 7.5% · 30yr
- Down + closing
- —
- Monthly P&I
- —
- Monthly cashflow
- —
- DSCR
- —
- Eligible?
- —
Personal DTI + credit; lowest rate.
DSCR
20% down · 8.5% · 30yr
- Down + closing
- —
- Monthly P&I
- —
- Monthly cashflow
- —
- DSCR
- —
- Eligible?
- —
No personal income docs; deal must DSCR.
Hard money
10% down · 12.0% · 12mo
- Down + closing
- —
- Monthly P&I
- —
- Monthly cashflow
- —
- DSCR
- —
- Eligible?
- —
Short-term bridge; refi at stabilization.
Rent comps 14 comps
| Address | Beds | Baths | Sqft | Rent | $/sqft | DOM | Units | Dist |
|---|---|---|---|---|---|---|---|---|
| 363 Hewlett Pkwy Hewlett, NY | 3.0 | 1.5 | 1205 | $4,200 | $3.49 | 24d | 1 | 0.34mi |
| 227 Franklin Pl Woodmere, NY | 3.0 | 1.0 | 950 | $3,400 | $3.58 | 43d | 1 | 0.66mi |
| 19 Dartmouth St Valley Stream, NY | 3.0 | 3.5 | 1439 | $4,600 | $3.20 | 1d | 1 | 0.72mi |
| 127 Gordon Rd Valley Stream, NY | 3.0 | 1.0 | 1200 | $3,350 | $2.79 | 43d | 1 | 0.73mi |
| 510 Dubois Ave Apt 3C Valley Stream, NY | 2.0 | 1.5 | 1050 | $3,400 | $3.24 | 43d | 1 | 0.77mi |
| 141 Munro Blvd Valley Stream, NY | 1.0 | 1.0 | 1000 | $1,300 | $1.30 | 17d | 1 | 0.79mi |
| 65 Prospect Ave Apt 15W Lynbrook, NY | 2.0 | 2.0 | 1060 | $3,680 | $3.47 | 22d | 1 | 0.94mi |
| 65 Prospect Ave Unit 2W Lynbrook, NY | 1.0 | 1.0 | 800 | $3,055 | $3.82 | 43d | 1 | 0.94mi |
| 92 Wavecrest St Valley Stream, NY | 2.0 | 1.0 | 1200 | $2,800 | $2.33 | 24d | 1 | 1.23mi |
| 23 Thompson Pl Unit 2 Lynbrook, NY | 3.0 | 1.0 | 900 | $3,100 | $3.44 | 18d | 1 | 1.32mi |
| 50 Roosevelt Ave Unit A301 Valley Stream, NY | 2.0 | 1.0 | 767 | $3,550 | $4.63 | 1d | 1 | 1.37mi |
| 132 Roosevelt Ave Valley Stream, NY | 3.0 | 2.0 | 1010 | $4,300 | $4.26 | 1d | 1 | 1.40mi |
| 576 Scranton Ave Unit 576-4 Lynbrook, NY | 2.0 | 1.0 | 1212 | $3,750 | $3.09 | 44d | 1 | 1.45mi |
| 757 Chestnut St Unit 1st Fl Cedarhurst, NY | 2.0 | 2.0 | 1200 | $4,195 | $3.50 | 1d | 1 | 1.48mi |
HOA detail condo
- Monthly dues
- $0 · $0/yr
- Assessments
- None detected in remarks — confirm with the listing agent.
Listing history 12 events
-
2026-06-18days on market $269,500 Active 16 DOM
-
2026-06-17days on market $269,500 Active 15 DOM
-
2026-06-16days on market $269,500 Active 14 DOM
-
2026-06-15days on market $269,500 Active 13 DOM
-
2026-06-13days on market $269,500 Active 11 DOM
-
2026-06-13days on market $269,500 Active 10 DOM
-
2026-06-09days on market $269,500 Active 7 DOM
-
2026-06-08days on market $269,500 Active 6 DOM
-
2026-06-07days on market $269,500 Active 5 DOM
-
2026-06-04days on market $269,500 Active 2 DOM
-
2026-06-02remarks 699-char remark
-
2026-06-02$269,500 Active 1 DOM
ⓘ Source: listings_history table (triggers on properties + properties_extension) + one-shot
backfill from property_details.listing_events for pre-trigger history.
Climate risk First Street
- Flood 1/10 Low FEMA zone X (unshaded) · 0% chance over 30 yrs
- Wildfire 1/10 Low
- Heat 6/10 Major 7 d/yr ≥95°F today · 16 d/yr by 30 yrs out
- Wind 6/10 Major 70% chance of damaging wind over 30 yrs
- Air quality 4/10 Moderate 4 unhealthy d/yr today · 6 by 30 yrs out
Nearby sold comps map
Loading sold comps map…
Walkable amenities ~0.75 mi
Loading nearby amenities…
Taxation est. · year 1
- Rental income
- $44,740
- − Mortgage interest
- −$15,096
- − Property taxes
- −$4,042
- − Insurance
- −$1,348
- − Repairs & maintenance
- −$3,579
- − Management
- −$3,579
- − HOA
- −$25,092
- − Depreciation
- −$7,840
- Taxable loss
- −$15,836
- Est. tax savings @ 24.0%
- +$3,801
- After-tax cash flow
- $-8,296/yr
For passive investors: Depreciation is non-cash, so a rental often shows a tax loss while cash-flowing — sheltering income. Rental losses are passive: they offset passive income freely, and up to $25,000/yr can offset ordinary (W-2) income if you actively participate and your MAGI is under $100k (phasing out to $0 by $150k); unused losses carry forward. On sale, claimed depreciation is recaptured at up to 25%, and gains may owe capital-gains tax (a 1031 exchange can defer both). Figures are a year-1 estimate at your 24.0% rate — not tax advice; consult a CPA.
Condition & rehab AI · 12 photos
This 1st floor, two-bedroom/two-bathroom CO-OP is in good condition with recent updates, making it a great investment opportunity.
Value-add opportunities
- Both Paint interior walls — Fresh paint enhances curb appeal and interior aesthetics
- Both Replace textured tile flooring with modern tile — Modern tile would improve the kitchen's appearance and functionality
Renovation cost estimate screening
Value-add ROI direction
- Both Paint interior walls — Fresh paint enhances curb appeal and interior aesthetics ↑
- Both Replace textured tile flooring with modern tile — Modern tile would improve the kitchen's appearance and functionality ↑
ⓘ Cost ranges are severity-bucket heuristics (US national rule-of-thumb). Get contractor quotes + a written scope before underwriting a rehab budget.
Schools (NCES district)
- District
- Hewlett-Woodmere Union Free School District
- NCES district ID
- 3631710
- Math proficiency
- 72% ▼ -7.00%
- Reading proficiency
- 79% ▼ -3.00%
- Median HH income
- $112,656
- Composite
- 69.89/100
- National rank
- #287
- State rank
- #59 of 590 in NY
Livability — Hewlett
- Score
- 89/100
- State rank
- #7
- US rank
- #165
Category grades
Schools grade is shown separately in the Schools card above.
Census & demographics
- Census place
- Hewlett, NY
- Population (ZIP)
- 8,503
Population outlook (Nassau County) Hauer SSP2
- Today (2025)
- 1,409,302 people
- By 2030
- 1,431,482 · +1.6%
- By 2040
- 1,471,607 · +4.4%
- By 2050
- 1,502,845 · +6.6%
- By 2075
- 1,575,403 · +11.8%
- By 2100
- 1,554,356 · +10.3%
Race, ethnicity, and origin ACS 2023
- Neighborhood character
- Predominantly White (74%)
- Race & ethnicity
- White 74% Asian 9% Hispanic / Latino 8% Black 6% Two or more races 5%
- Hispanic origin (detail)
- Puerto Rican 2%
- Common ancestry
- Scotch-Irish 5% Romanian 4% Danish 2%
- Foreign-born
- 19% · Canada, Vietnam, China
- Languages at home
- 74% English-only · Russian/Polish/Slavic 6% Spanish 6% Other Indo-European 4%
Political lean MEDSL · Nassau
- 2024 margin
- Toss-up / Even · D 47.9% · R 52.1%
- 2008→2024 swing
- -12.6pp toward R · 2008: 8.4pp · 2024: -4.2pp
- All cycles
- 2024: R+4.2 2020: D+9.5 2016: D+5.3 2012: D+6.7 2008: D+8.4
Not yet ingested
- Civics
- —
Market trends
- HPI YoY
- ▼ -218.62%
- Current HPI
- 273.9904
- Rent YoY
- —
- Metro
- —
- State GDP YoY
- ▲ 2.60%
- F500 in state
- 92
Industry mix (Fortune 500 HQ in NY)
| Industry | F500 HQs | Revenue |
|---|---|---|
| Financial Services | 10 | $950B |
|
||
| Consumer Goods | 9 | $162B |
|
||
| Insurance | 4 | $225B |
|
||
| Telecommunications | 2 | $144B |
|
||
| Pharmaceuticals | 2 | $112B |
|
||
| Media / Entertainment | 2 | $69B |
|
||
Price history
1 event — show timeline
- 2026-06-01 Listed $269,500 OneKey® MLS as Distributed by MLS Grid
Cash-flow waterfall
monthlySold comps — $/sqft
last 12 mo · ≤1 miLoading sold comps…