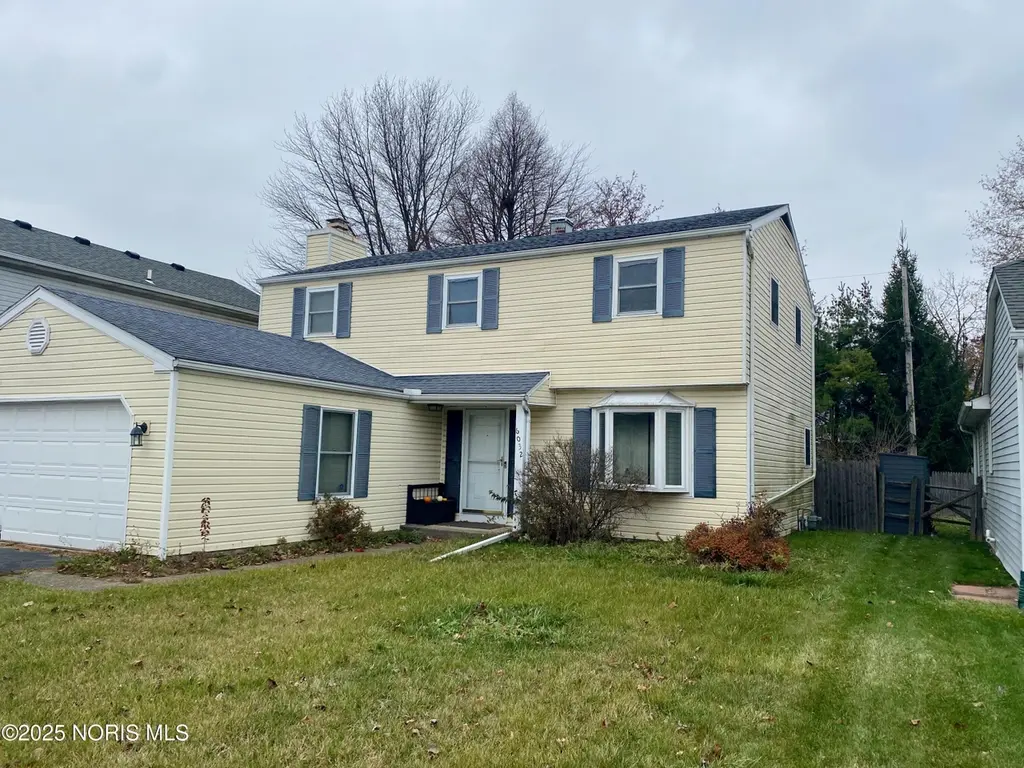
6032 Willowvale Dr · Toledo, OH
Flood risk 1/10 · Minimal
- FEMA flood zone
- X (unshaded)
- Chance of flooding over 30 yrs
- 0.0%
- Est. flood insurance / yr
- $473 – $860
Fire risk 1/10 · Minimal
- Est. fire insurance / yr
- $713 – $1,323
Heat risk 3/10 · Minor
- Hot days now (above 99°F)
- 7 days/yr
- Hot days in 30 yrs
- 16 days/yr
Wind risk 2/10 · Minimal
- Chance of severe wind over 30 yrs
- —
Air-quality risk 2/10 · Minimal
- Unhealthy air days now
- 1 days/yr
- Unhealthy air days in 30 yrs
- 2 days/yr
Risk factors via First Street. Map © Google.
Why this score? — see what drove the B- grade
The composite is a weighted blend of 9 inputs, each scored 0–100. Each bar is that input's sub-score; the figure is the points it added to the 100-point composite (weight × sub-score).
- Cash flow +25.7/30.0
- ARV discount +15.0/15.0
- 1% rule +8.8/10.0
- DSCR +8.6/10.0
- Livability +3.3/5.0
- Rent growth +3.1/5.0
- Condition / age +2.5/5.0
- Schools +1.6/10.0
- Appreciation +0.0/10.0
$130,000
🖨 Deal sheet 📄 Offer letter ✓ Due diligence
Listing remarks MLS
Selling as is . Preapproval or proof of funds when submitting offers. Sellers addendum to follow accepted offer. No commission payable if licensed agent. Buyer to pay at closing a 99.00 seller doc/review fee. Property may require flood insurance.
Key facts
- Updated design
- Eat-in bar
- Cozy fireplace
Tags
Neighborhood map
What this means for you Summary
Snapshot
- This is a 4-bed/2.5-bath single-family listed at $130k.
Deal economics
- At list price, monthly cash flow is $313 ($4k/yr) — positive.
- The deal already cash-flows at list — no discount required.
- Meets the 1% rule at list price ($2k rent vs $130k).
- Recommended offer: $122k (6.0% below list) — sets the bar for market timing.
- Cap rate 9.2% vs local median 7.6% in Toledo — meaningfully above typical; check what's discounted (condition, days-on-market, listing class) to confirm the premium yield is real.
Location & tenants
- Location reads 66/100 on livability (#645 in OH) — a middle-class / working-renter tenant base. Strengths: cost of living A+, housing A+, health & safety A+; Watch: amenities C-, crime F, commute F.
- Toledo City (urban): math 15% / reading 24% proficiency, ranked #634 of 656 in OH (top 97%) — low school quality limits family demand, transient renter base, plan for 1-2y turnover; 72% free/reduced lunch — lower-income household profile, screen leases tightly.
- Zoned schools: Mctigue Elementary School (math 11% / reading 17%, grade F, #1,421 of 1,584 statewide, top 90%, 517 students, 0% FRL); Rogers High School (math 8% / reading 27%, grade F, #689 of 781 statewide, top 90%, 721 students, 0% FRL) — zoned schools average 0% FRL vs 72% district-wide (72 pts lower); this property's tenant base skews higher-income than the district average.
- Market conditions: Rents rising (+2.6%/yr); 114 active listings in the ZIP; 2 comparable units currently listed for rent nearby; 415 units permitted in Lucas County in 2024 (122 in 5+ unit buildings).
- This rent runs 37% of the median local income ($58k/yr) — at the standard rent-burdened threshold; future hikes will face affordability resistance.
Forward outlook
- Local home prices are declining (-3.0%/yr); year-one equity from $899 of loan paydown is wiped out by about $4k of value loss. Plan a longer hold.
- Lucas County population projected at -16% by 2050 — secular population decline; favor cash flow + early exit over multi-decade hold.
Negotiation context
- It's been on market 62 days — a 6% lower offer ($122k) is reasonable based on typical stale-listing flexibility.
- 5 sale attempts since 28y ago with the ask held roughly flat each time — persistent listings suggest the price (not the market) is what's stuck; bring a comps-based counter.
Risks & watch-outs
- Watch-outs: property tax is 3.4% of price.
Questions for the listing agent
- It's been on market 62 days. Have you received any prior offers? Is the seller open to a 6% concession, seller financing, or rate buy-down credit?
- Property tax is high relative to price — has the assessment been appealed recently, and will the sale trigger a re-assessment?
- Why hasn't it sold? Are there any deal-killer items the seller is aware of (foundation, flood, title, zoning, code violations)?
- Is there a deadline driving the sale (1031 exchange, divorce, estate, relocation)? That informs how much negotiation room exists.
- Schools are D-rated, which usually means shorter tenancies and higher turnover. Who's the typical renter profile here, and what's been the actual vacancy rate?
- Crime grade is F in this area — have there been break-ins, vandalism, or insurance claims at this property in the last 3 years? What carrier currently insures it and at what premium?
- What's the average days-on-market for RENTAL listings here right now (not sales)? A rising rental-DOM trend means longer vacancies and softer asking-rent achievability than the comps imply.
- What's the recent tenant-quality profile in this submarket — average credit score on applications, eviction rate, late-payment / NSF rate, and stable-employment percentage? A property-management company in the area should have these aggregated.
- How much new for-sale + rental construction is in the pipeline within 1–3 miles? Heavy new supply typically softens prices + rents 12–24 months out; constrained supply supports both.
Investment metrics
- 1% rule
- 1.38% ✓
- Cap rate
- 9.19%
- Cash-on-cash
- 10.33%
- DSCR
- 1.46
- GRM
- 6.0
CMA / ARV
- ARV (on-the-fly)
- $194,400
- Comps found
- 8
Show comp detail 8 sales within ~0.75 mi
| Address | Dist | Beds/Ba | Sqft | Sold | Price | $/sf | Match |
|---|---|---|---|---|---|---|---|
| 6066 White Oak Dr | 0.09mi | 3/2.5 (-1) | 1,764 (-2%) | 6mo | $238,500 | $135 | 83 |
| 6130 White Oak Dr | 0.15mi | 4/2.0 | 1,546 (-14%) | 7mo | $250,000 | $162 | 62 |
| 141 Lancaster Ave | 0.49mi | 4/3.0 | 1,848 (+3%) | 19mo | $200,000 | $108 | 55 |
| 51 Dulton Dr | 0.57mi | 3/2.0 (-1) | 1,692 (-6%) | 10mo | $175,051 | $103 | 48 |
| 45 Stillwater Dr | 0.60mi | 3/1.5 (-1) | 1,754 (-3%) | 18mo | $249,900 | $142 | 44 |
| 15 Dulton Dr | 0.53mi | 4/1.0 | 1,889 (+5%) | 24mo | $186,000 | $98 | 41 |
| 102 Leander Dr | 0.65mi | 3/1.0 (-1) | 1,752 (-3%) | 20mo | $187,000 | $107 | 38 |
| 114 Dulton Dr | 0.55mi | 3/1.0 (-1) | 1,561 (-13%) | 21mo | $142,000 | $91 | 24 |
Match score weights: distance 35% · size 25% · config 20% · recency 20%. Top-matched comps best support the ARV.
Projected returns pro-forma
-3.0% appreciation · 2.59% rent growth · sell at horizon
- IRR
- -1.2%
- Equity multiple
- 0.95×
- Total profit
- $-1,693
- Equity at exit
- $19,383
- IRR
- 8.0%
- Equity multiple
- 1.60×
- Total profit
- $21,848
- Equity at exit
- $11,240
Cash invested: $36,400 (down + closing). Projections, not guarantees.
Landlord ↔ Tenant lean methodology
- Overall (STATE)
- 73 Landlord-Friendly
- State Ohio
- 73 Landlord-Friendly · R+6
- County
- — inherits STATE
- City
- — inherits STATE
ZIP-level market 43615
- Home prices YoY
- -31.9%
- Rents YoY
- 2.6%
- Active inventory
- 114
- Price-to-rent
- 6.0×
Monthly cashflow live
- Estimated rent
- $1,798 medium interval (Pro) →
- Mortgage (P&I)
- −$682
- Tax from tax record
- −$371 /mo · $4,454/yr
- Insurance
- −$54
- HOA
- −$0
- Vacancy / Maint / Mgmt
- −$378
- Net cashflow
- $313
Break-even live
UW: 25.0% down · 7.5% · 30yr · 1.5% tax · 5.0% vac · 8.0% maint · 8.0% mgmt
Financing live
Cash to close
- Down payment
- $32,500
- Closing costs
- $3,900
- Reserves months
- —
- Total cash needed
- —
Loan-product check · same deal, 3 products live
Conventional
25% down · 7.5% · 30yr
- Down + closing
- —
- Monthly P&I
- —
- Monthly cashflow
- —
- DSCR
- —
- Eligible?
- —
Personal DTI + credit; lowest rate.
DSCR
20% down · 8.5% · 30yr
- Down + closing
- —
- Monthly P&I
- —
- Monthly cashflow
- —
- DSCR
- —
- Eligible?
- —
No personal income docs; deal must DSCR.
Hard money
10% down · 12.0% · 12mo
- Down + closing
- —
- Monthly P&I
- —
- Monthly cashflow
- —
- DSCR
- —
- Eligible?
- —
Short-term bridge; refi at stabilization.
Rent comps 2 comps
| Address | Beds | Baths | Sqft | Rent | $/sqft | DOM | Units | Dist |
|---|---|---|---|---|---|---|---|---|
| 1009 N Holland Sylvania Rd Toledo, OH | 2.0–3.0 | 1.0–2.0 | 1130 | $1,759 | $1.56 | 14d | 21 | 1.29mi |
| 5001 South Ave Toledo, OH | 3.0 | 2.0 | 1312 | $1,424 | $1.09 | 14d | 1 | 1.31mi |
Listing history 20 events
-
2026-02-06status Pending
-
2025-12-05$130,000 Active
-
2025-10-14price $90,000 247-char remark
Show marketing remark (247 chars)
Selling as is . Preapproval or proof of funds when submitting offers. Sellers addendum to follow accepted offer. No commission payable if licensed agent. Buyer to pay at closing a 99.00 seller doc/review fee. Property may require flood insurance.
-
2025-10-13price $138,000 382-char remark
Show marketing remark (382 chars)
Move-in condition home. Home has been Murrayized-updated & cleaned from A to Z. From new roof to appliances to furnace to electric, light fixtures, carpet, paint, siding, C/ A 2006, countertops & windows too. 4 beds, 2.5 baths, part finished basement, 2.5 car w/nice wood deck for enjoying the fenced in yard. This affordable home in this subdivision may be the one for you.
-
2025-10-09price $130,000
-
2021-12-30soldstatus $220,000
-
2021-12-17soldstatus $220,000 Closed
-
2021-12-16status Pending
-
2021-12-16price $220,000
-
2021-11-15historical Contingent
-
2021-11-12$200,000 Active
-
2021-11-08historical $200,000
-
2010-04-02soldstatus $138,000
-
2010-04-01soldstatus $138,000 382-char remark
Show marketing remark (382 chars)
Move-in condition home. Home has been Murrayized-updated & cleaned from A to Z. From new roof to appliances to furnace to electric, light fixtures, carpet, paint, siding, C/ A 2006, countertops & windows too. 4 beds, 2.5 baths, part finished basement, 2.5 car w/nice wood deck for enjoying the fenced in yard. This affordable home in this subdivision may be the one for you.
-
2009-08-31$140,000 382-char remark
Show marketing remark (382 chars)
Move-in condition home. Home has been Murrayized-updated & cleaned from A to Z. From new roof to appliances to furnace to electric, light fixtures, carpet, paint, siding, C/ A 2006, countertops & windows too. 4 beds, 2.5 baths, part finished basement, 2.5 car w/nice wood deck for enjoying the fenced in yard. This affordable home in this subdivision may be the one for you.
-
2009-07-28soldstatus $90,000 247-char remark
Show marketing remark (247 chars)
Selling as is . Preapproval or proof of funds when submitting offers. Sellers addendum to follow accepted offer. No commission payable if licensed agent. Buyer to pay at closing a 99.00 seller doc/review fee. Property may require flood insurance.
-
2009-04-21$94,500 247-char remark
Show marketing remark (247 chars)
Selling as is . Preapproval or proof of funds when submitting offers. Sellers addendum to follow accepted offer. No commission payable if licensed agent. Buyer to pay at closing a 99.00 seller doc/review fee. Property may require flood insurance.
-
1999-04-27soldstatus $130,000
-
1999-04-23soldstatus $130,000
-
1998-11-03$134,000
ⓘ Source: listings_history table (triggers on properties + properties_extension) + one-shot
backfill from property_details.listing_events for pre-trigger history.
Tax reassessment forecast OH · Partial reset (capped growth)
- Current annual tax
- $4,454 · $371/mo
- Projected year-2 tax
- $4,454 · $371/mo
- Expected delta
- $0/yr ($0/mo · 0.0%)
ⓘ Screening estimate from a state-policy table — verify with the county assessor before closing.
Climate risk First Street
- Flood 1/10 Low FEMA zone X (unshaded) · 0% chance over 30 yrs
- Wildfire 1/10 Low
- Heat 3/10 Moderate 7 d/yr ≥99°F today · 16 d/yr by 30 yrs out
- Wind 2/10 Low
- Air quality 2/10 Low 1 unhealthy d/yr today · 2 by 30 yrs out
Nearby sold comps map
Loading sold comps map…
Walkable amenities ~0.75 mi
Loading nearby amenities…
Taxation est. · year 1
- Rental income
- $21,575
- − Mortgage interest
- −$7,282
- − Property taxes
- −$4,454
- − Insurance
- −$650
- − Repairs & maintenance
- −$1,726
- − Management
- −$1,726
- − Depreciation
- −$3,782
- Taxable income
- $1,956
- Est. tax owed @ 24.0%
- −$469
- After-tax cash flow
- $3,291/yr
For passive investors: Depreciation is non-cash, so a rental often shows a tax loss while cash-flowing — sheltering income. Rental losses are passive: they offset passive income freely, and up to $25,000/yr can offset ordinary (W-2) income if you actively participate and your MAGI is under $100k (phasing out to $0 by $150k); unused losses carry forward. On sale, claimed depreciation is recaptured at up to 25%, and gains may owe capital-gains tax (a 1031 exchange can defer both). Figures are a year-1 estimate at your 24.0% rate — not tax advice; consult a CPA.
Schools (NCES district)
- District
- Toledo City
- NCES district ID
- 3904490
- Math proficiency
- 15% ▼ -16.00%
- Reading proficiency
- 24% ▼ -13.00%
- Median HH income
- $32,137
- Composite
- 15.76/100
- National rank
- #9276
- State rank
- #634 of 656 in OH
Livability — Toledo
- Score
- 66/100
- State rank
- #645
- US rank
- #11442
Category grades
Schools grade is shown separately in the Schools card above.
Census & demographics
- Census place
- Toledo, OH
- County
- Lucas County · 380,724 people
- City population
- 280,811
- Metro
- Toledo, OH
- Population (ZIP)
- 40,146
- Household income
- $57,713
- Rent vs Own
- Severe rent burden
- 1683.0
Population outlook (Lucas County) Hauer SSP2
- Today (2025)
- 420,751 people
- By 2030
- 410,187 · -2.5%
- By 2040
- 384,019 · -8.7%
- By 2050
- 355,125 · -15.6%
- By 2075
- 291,683 · -30.7%
- By 2100
- 233,670 · -44.5%
Race, ethnicity, and origin ACS 2023
- Neighborhood character
- Majority White (62%)
- Race & ethnicity
- White 62% Black 26% Two or more races 6% Hispanic / Latino 4% Asian 3%
- Common ancestry
- Romanian 7% Lithuanian 3% Slovak 2%
- Foreign-born
- 5% · China, Canada
- Languages at home
- 93% English-only · Arabic 2% Spanish 1% Chinese 1%
Political lean MEDSL · Lucas
- 2024 margin
- D (+12.6) · D 55.8% · R 43.2%
- 2008→2024 swing
- -18.9pp toward R · 2008: 31.4pp · 2024: 12.6pp
- All cycles
- 2024: D+12.6 2020: D+16.8 2016: D+17.4 2012: D+30.4 2008: D+31.4
Not yet ingested
- Civics
- —
Market trends
- HPI YoY
- ▼ -96.44%
- Current HPI
- 205.95
- Rent YoY
- ▲ 2.59%
- Metro
- Toledo, OH
- State GDP YoY
- ▲ 1.98%
- F500 in state
- 48
Industry mix (Fortune 500 HQ in OH)
| Industry | F500 HQs | Revenue |
|---|---|---|
| Insurance | 3 | $145B |
|
||
| Industrial Machinery | 3 | $49B |
|
||
| Financial Services | 3 | $24B |
|
||
| Consumer Goods | 2 | $93B |
|
||
| Aerospace / Defense | 2 | $47B |
|
||
| Utilities | 2 | $33B |
|
||
Price history
-3.0% since first listed20 events — show timeline
- 2026-02-06 Pending — NORIS
- 2025-12-05 Listed $130,000 NORIS
- 2025-10-14 Price Changed $90,000 NORIS
- 2025-10-13 Price Changed $138,000 NORIS
- 2025-10-09 Price Changed $130,000 NORIS
- 2021-12-30 Sold (Public Records) $220,000 Public Records
- 2021-12-17 Sold (MLS) $220,000 NORIS
- 2021-12-16 Pending — NORIS
- 2021-12-16 Price Changed $220,000 NORIS
- 2021-11-15 Contingent — NORIS
- 2021-11-12 Listed $200,000 NORIS
- 2021-11-08 Coming Soon $200,000 NORIS
- 2010-04-02 Sold (Public Records) $138,000 Public Records
- 2010-04-01 Sold (MLS) $138,000 NORIS
- 2009-08-31 Listed $140,000 NORIS
- 2009-07-28 Sold (MLS) $90,000 NORIS
- 2009-04-21 Listed $94,500 NORIS
- 1999-04-27 Sold (Public Records) $130,000 Public Records
- 1999-04-23 Sold (MLS) $130,000 NORIS
- 1998-11-03 Listed $134,000 NORIS
Property tax history
+3.4%/yrLatest (2025): $4,454 · -0.5% YoY. Source: county tax records.
Cash-flow waterfall
monthlySold comps — $/sqft
last 12 mo · ≤1 miLoading sold comps…