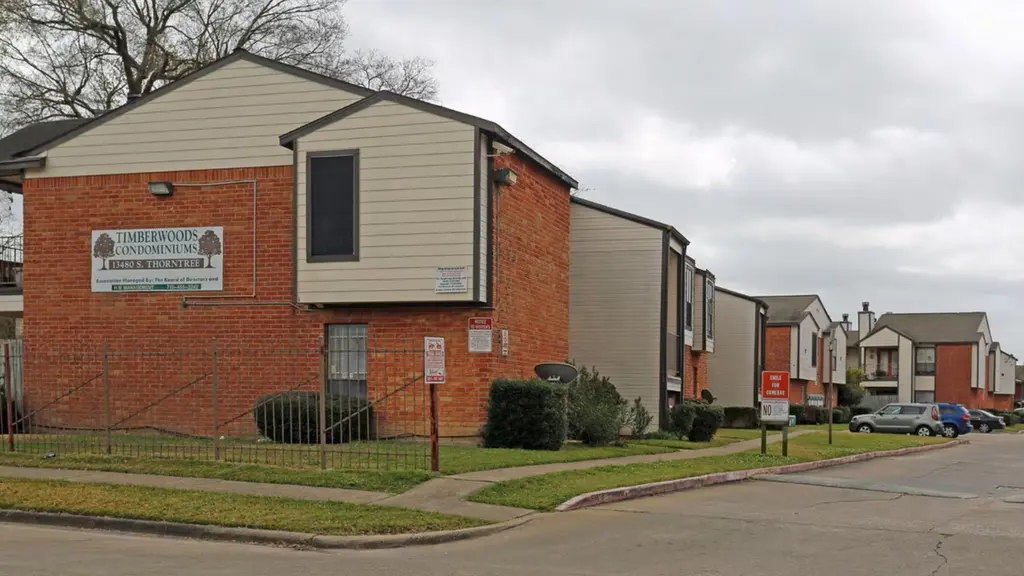
13480 S Thorntree Dr #910 · Houston, TX
Flood risk 3/10 · Minor
- FEMA flood zone
- X (unshaded)
- Chance of flooding over 30 yrs
- 0.2%
- Est. flood insurance / yr
- $507 – $1,088
Fire risk 1/10 · Minimal
- Est. fire insurance / yr
- $1,222 – $2,270
Heat risk 10/10 · Severe
- Hot days now (above 109°F)
- 7 days/yr
- Hot days in 30 yrs
- 25 days/yr
Wind risk 9/10 · Severe
- Chance of severe wind over 30 yrs
- 99.0%
Air-quality risk 2/10 · Minimal
- Unhealthy air days now
- 2 days/yr
- Unhealthy air days in 30 yrs
- 2 days/yr
Risk factors via First Street. Map © Google.
Why this score? — see what drove the B grade
The composite is a weighted blend of 9 inputs, each scored 0–100. Each bar is that input's sub-score; the figure is the points it added to the 100-point composite (weight × sub-score).
- Cash flow +27.4/30.0
- ARV discount +15.0/15.0
- 1% rule +10.0/10.0
- DSCR +9.6/10.0
- Livability +3.7/5.0
- Schools +2.8/10.0
- Condition / age +2.5/5.0
- Rent growth +2.3/5.0
- Appreciation +0.0/10.0
$49,000
🖨 Deal sheet 📄 Offer letter ✓ Due diligence
Listing remarks MLS
This well-maintained property offers 1 bedroom and 1 bathroom, thoughtfully designed for everyday comfort. Tiled floors throughout the home provide easy maintenance and a clean, modern feel. A dedicated laundry room adds convenience to your daily routine. The bedroom features a ceiling fan to help keep you cool, and the living room includes a fireplace, perfect for relaxing evenings. The kitchen is equipped with a single-range oven, dishwasher, and practical double sinks to make meal prep and cleanup easier. This property is being sold with three other investment properties. Kindly refer to these MLS numbers: 13480 S Thorntree Drive #508 - 15241348 13480 S Thorntree Drive #1206 - 88053105 13480 S Thorntree Drive #1004 - 64613388
Key facts
- Ceiling fan
- Tiled floors
- Dishwasher
Tags
Neighborhood map
What this means for you Summary
Snapshot
- This is a 1-bed/1.0-bath condo listed at $49k.
Deal economics
- At list price, monthly cash flow is $143 ($2k/yr) — positive.
- The deal already cash-flows at list — no discount required.
- Meets the 1% rule at list price ($877 rent vs $49k).
- Recommended offer: $43k (12.0% below list) — sets the bar for market timing.
- Cap rate 9.8% vs local median 3.2% in Houston — top-decile yield for the area; either an underpriced asset or a hidden risk that comps aren't pricing in. Stress-test before assuming the spread holds.
Location & tenants
- Location reads 74/100 on livability (#184 in TX, #4,771 nationally) — a middle-class / working-renter tenant base. Strengths: amenities A+, cost of living A+, housing A+; Watch: schools D, crime F.
- Galena Park ISD (suburban): math 32% / reading 33% proficiency, ranked #578 of 826 in TX (top 70%) — families likely to look elsewhere, expect single-tenant / working-renter base with shorter leases; 74% free/reduced lunch — lower-income household profile, screen leases tightly.
- Market conditions: Rents soft (-0.8%/yr); 162 active listings in the ZIP; 34 comparable units currently listed for rent nearby; rentals leasing fast (median 13d on market — plan ~1-2 weeks tenant-placement turnaround); 29,883 units permitted in Harris County in 2024 (8,621 in 5+ unit buildings).
Forward outlook
- Local home prices are declining (-3.0%/yr); year-one equity from $339 of loan paydown is wiped out by about $1k of value loss. Plan a longer hold.
- Harris County population projected at +47% by 2050 — long-run rental-demand tailwind backs the buy-and-hold thesis.
Negotiation context
- It's been on market 356 days — a 12% lower offer ($43k) is reasonable based on typical stale-listing flexibility.
- 5 sale attempts since 4y ago; this cycle's ask has dropped $11k (18%) from the opening price — seller is motivated, your offer sets the floor, not the list.
Risks & watch-outs
- Watch-outs: HOA is 24% of rent.
- Climate carrying-cost: severe wind risk, 99% chance of damaging wind over 30y; extreme-heat days projected 7→25/yr by 2055 (HVAC capex compounding) — expect insurance premiums to compound above CPI over the hold.
Questions for the listing agent
- It's been on market 356 days. Have you received any prior offers? Is the seller open to a 12% concession, seller financing, or rate buy-down credit?
- What does the HOA fee cover, when was the last increase, and are there any pending special assessments or reserve-fund shortfalls?
- Any open or pending special assessments — roof, HVAC, plumbing, elevator, façade? What's the per-unit balance and payoff schedule, and is the seller paying it off at close or rolling it to the buyer?
- Why hasn't it sold? Are there any deal-killer items the seller is aware of (foundation, flood, title, zoning, code violations)?
- Is there a deadline driving the sale (1031 exchange, divorce, estate, relocation)? That informs how much negotiation room exists.
- Schools are D-rated, which usually means shorter tenancies and higher turnover. Who's the typical renter profile here, and what's been the actual vacancy rate?
- Crime grade is F in this area — have there been break-ins, vandalism, or insurance claims at this property in the last 3 years? What carrier currently insures it and at what premium?
- What's the average days-on-market for RENTAL listings here right now (not sales)? A rising rental-DOM trend means longer vacancies and softer asking-rent achievability than the comps imply.
- What's the recent tenant-quality profile in this submarket — average credit score on applications, eviction rate, late-payment / NSF rate, and stable-employment percentage? A property-management company in the area should have these aggregated.
- How much new apartment / multifamily construction is in the pipeline within 1–3 miles? Heavy new supply (>2% of stock underway) typically softens rents 12–24 months out; light construction supports rent growth.
Investment metrics
- 1% rule
- 1.79% ✓
- Cap rate
- 9.79%
- Cash-on-cash
- 12.50%
- DSCR
- 1.56
- GRM
- 4.7
CMA / ARV
- ARV (median comp)
- $61,359
- List price
- $49,000
- Delta
- -20.14%
- Verdict
- UNDERPRICED
- Comps
- 6 within 1.0 mi
Projected returns pro-forma
-3.0% appreciation · 0.0% rent growth · sell at horizon
- IRR
- -2.6%
- Equity multiple
- 0.91×
- Total profit
- $-1,265
- Equity at exit
- $7,306
- IRR
- 1.6%
- Equity multiple
- 1.09×
- Total profit
- $1,269
- Equity at exit
- $4,237
Cash invested: $13,720 (down + closing). Projections, not guarantees.
Landlord ↔ Tenant lean methodology
- Overall (STATE)
- 87 Strongly Landlord-Friendly
- State Texas
- 87 Strongly Landlord-Friendly · R+5
- County
- — inherits STATE
- City
- — inherits STATE
ZIP-level market 77015
- Home prices YoY
- -10.8%
- Rents YoY
- -0.8%
- Active inventory
- 162
- Price-to-rent
- 4.7×
Monthly cashflow live
- Estimated rent
- $877 high interval (Pro) →
- Mortgage (P&I)
- −$257
- Tax from tax record
- −$64 /mo · $771/yr
- Insurance
- −$20
- HOA
- −$208
- Vacancy / Maint / Mgmt
- −$184
- Net cashflow
- $143
Break-even live
UW: 25.0% down · 7.5% · 30yr · 1.5% tax · 5.0% vac · 8.0% maint · 8.0% mgmt
Financing live
Cash to close
- Down payment
- $12,250
- Closing costs
- $1,470
- Reserves months
- —
- Total cash needed
- —
Loan-product check · same deal, 3 products live
Conventional
25% down · 7.5% · 30yr
- Down + closing
- —
- Monthly P&I
- —
- Monthly cashflow
- —
- DSCR
- —
- Eligible?
- —
Personal DTI + credit; lowest rate.
DSCR
20% down · 8.5% · 30yr
- Down + closing
- —
- Monthly P&I
- —
- Monthly cashflow
- —
- DSCR
- —
- Eligible?
- —
No personal income docs; deal must DSCR.
Hard money
10% down · 12.0% · 12mo
- Down + closing
- —
- Monthly P&I
- —
- Monthly cashflow
- —
- DSCR
- —
- Eligible?
- —
Short-term bridge; refi at stabilization.
Rent comps 34 comps
| Address | Beds | Baths | Sqft | Rent | $/sqft | DOM | Units | Dist |
|---|---|---|---|---|---|---|---|---|
| 90 Uvalde Rd Houston, TX | 1.0–2.0 | 1.0–2.0 | 868 | $805 | $0.93 | 1d | 20 | 0.11mi |
| 13502 N Thorntree Dr Unit 1047 Houston, TX | 1.0 | 1.0 | 583 | $824 | $1.41 | 11d | 1 | 0.16mi |
| 13502 N Thorntree Dr Houston, TX | 1.0 | 1.0 | 583 | $773 | $1.33 | 12d | 1 | 0.16mi |
| 13502 N Thorntree Dr Unit 13553 Houston, TX | 1.0 | 1.0 | 635 | $864 | $1.36 | 43d | 1 | 0.18mi |
| 13502 N Thorntree Dr Unit 13523 Houston, TX | 1.0 | 1.0 | 583 | $781 | $1.34 | 2d | 1 | 0.18mi |
| 13502 N Thorntree Dr Unit 13523 Houston, TX | 1.0 | 1.0 | 635 | $869 | $1.37 | 12d | 1 | 0.18mi |
| 250 Uvalde Rd Houston, TX | 1.0–3.0 | 1.0–2.0 | 909 | $739 | $0.81 | 2d | 26 | 0.30mi |
| 316 White Cedar St Houston, TX | 1.0 | 1.0 | 712 | $1,035 | $1.45 | 22d | 1 | 0.33mi |
| 316 White Cedar St Houston, TX | 1.0 | 1.0 | 712 | $1,035 | $1.45 | 19d | 1 | 0.33mi |
| 14445 Wallisville Rd Unit a1 Houston, TX | — | 1.0 | 519 | $772 | $1.49 | 43d | 1 | 0.57mi |
| 14445 Wallisville Rd Houston, TX | 2.0 | 1.0–2.0 | 659 | $976 | $1.48 | 1d | 10 | 0.57mi |
| 14340 Wallisville Rd Unit 1162 Houston, TX | 1.0 | 1.0 | 670 | $1,080 | $1.61 | 5d | 1 | 0.65mi |
| 14340 Wallisville Rd Houston, TX | 1.0 | 1.0 | 670 | $1,069 | $1.60 | 12d | 1 | 0.65mi |
| 14340 Wallisville Rd Unit 325 Houston, TX | 1.0 | 1.0 | 670 | $1,077 | $1.61 | 2d | 1 | 0.65mi |
| 14340 Wallisville Rd Unit 14361 Houston, TX | 1.0 | 1.0 | 670 | $1,077 | $1.61 | 2d | 1 | 0.66mi |
| 14340 Wallisville Rd Unit 14361 Houston, TX | 1.0 | 1.0 | 669 | $1,095 | $1.64 | 12d | 1 | 0.66mi |
| 14340 Wallisville Rd Unit 14391 Houston, TX | 1.0 | 1.0 | 669 | $1,090 | $1.63 | 43d | 1 | 0.66mi |
| 5675 Purple Sage Rd Houston, TX | 1.0–2.0 | 1.0–2.0 | 782 | $1,039 | $1.33 | 3d | 18 | 0.70mi |
| 12955 Woodforest Blvd Unit 305 Houston, TX | 1.0 | 1.0 | 728 | $975 | $1.34 | 24d | 1 | 0.80mi |
| 5921 Uvalde Rd Houston, TX | 1.0 | 1.0 | 644 | $963 | $1.50 | 43d | 1 | 0.81mi |
| 5921 Uvalde Rd Houston, TX | 1.0 | 1.0 | 644 | $963 | $1.50 | 20d | 1 | 0.81mi |
| 5915 Uvalde Rd Houston, TX | 1.0–3.0 | 1.0–2.0 | 779 | $796 | $1.02 | 2d | 13 | 0.87mi |
| 12800 Woodforest Blvd Unit 12874 Houston, TX | 1.0 | 1.0 | 414 | $707 | $1.71 | 2d | 1 | 0.95mi |
| 12800 Woodforest Blvd Unit 12851 Houston, TX | 1.0 | 1.0 | 414 | $710 | $1.71 | 15d | 1 | 0.95mi |
| 12800 Woodforest Blvd Unit 12874 Houston, TX | 1.0 | 1.0 | 414 | $745 | $1.80 | 12d | 1 | 0.95mi |
| 12800 Woodforest Blvd Unit 12842 Houston, TX | 1.0 | 1.0 | 414 | $667 | $1.61 | 2d | 1 | 0.95mi |
| 13925 Alderson St Houston, TX | 1.0 | 1.0 | 620 | $844 | $1.36 | 2d | 1 | 0.97mi |
| 13925 Alderson St Houston, TX | 1.0 | 1.0 | 730 | $824 | $1.13 | 15d | 1 | 0.97mi |
| 13925 Alderson St Houston, TX | 2.0 | 1.0 | 700 | $1,273 | $1.82 | 3d | 1 | 0.97mi |
| 13925 Alderson St Houston, TX | 1.0 | 1.0 | 620 | $845 | $1.36 | 3d | 1 | 0.97mi |
| 456 Normandy St Houston, TX | 1.0 | 1.0 | 734 | $1,099 | $1.50 | 43d | 1 | 1.21mi |
| 555 Normandy St Houston, TX | 1.0–2.0 | 1.0–2.0 | 745 | $818 | $1.10 | 2d | 23 | 1.35mi |
| 561 Normandy St Houston, TX | 1.0 | 1.0 | 680 | $999 | $1.47 | 24d | 1 | 1.36mi |
| 695 Normandy St Houston, TX | 1.0–2.0 | 1.0–2.0 | 788 | $899 | $1.14 | 12d | 30 | 1.41mi |
HOA detail condo
- Monthly dues
- $208 · $2,496/yr
- Assessments
- None detected in remarks — confirm with the listing agent.
Listing history 31 events
-
2026-06-18days on market $49,000 Active 356 DOM
-
2026-06-17days on market $49,000 Active 355 DOM
-
2026-06-16days on market $49,000 Active 354 DOM
-
2026-06-15days on market $49,000 Active 353 DOM
-
2026-06-13days on market $49,000 Active 351 DOM
-
2026-06-13days on market $49,000 Active 350 DOM
-
2026-06-09days on market $49,000 Active 347 DOM
-
2026-06-08days on market $49,000 Active 346 DOM
-
2026-06-07days on market $49,000 Active 345 DOM
-
2026-06-04days on market $49,000 Active 342 DOM
-
2026-06-03days on market $49,000 Active 341 DOM
-
2026-06-02days on market $49,000 Active 340 DOM
-
2026-06-01days on market $49,000 Active 339 DOM
-
2026-05-31days on market $49,000 Active 338 DOM
-
2026-03-03price $49,000 744-char remark
Show marketing remark (744 chars)
This well-maintained property offers 1 bedroom and 1 bathroom, thoughtfully designed for everyday comfort. Tiled floors throughout the home provide easy maintenance and a clean, modern feel. A dedicated laundry room adds convenience to your daily routine. The bedroom features a ceiling fan to help keep you cool, and the living room includes a fireplace, perfect for relaxing evenings. The kitchen is equipped with a single-range oven, dishwasher, and practical double sinks to make meal prep and cleanup easier. This property is being sold with three other investment properties. Kindly refer to these MLS numbers: 13480 S Thorntree Drive #508 - 15241348 13480 S Thorntree Drive #1206 - 88053105 13480 S Thorntree Drive #1004 - 64613388
-
2025-09-15price $52,000 744-char remark
Show marketing remark (744 chars)
This well-maintained property offers 1 bedroom and 1 bathroom, thoughtfully designed for everyday comfort. Tiled floors throughout the home provide easy maintenance and a clean, modern feel. A dedicated laundry room adds convenience to your daily routine. The bedroom features a ceiling fan to help keep you cool, and the living room includes a fireplace, perfect for relaxing evenings. The kitchen is equipped with a single-range oven, dishwasher, and practical double sinks to make meal prep and cleanup easier. This property is being sold with three other investment properties. Kindly refer to these MLS numbers: 13480 S Thorntree Drive #508 - 15241348 13480 S Thorntree Drive #1206 - 88053105 13480 S Thorntree Drive #1004 - 64613388
-
2025-06-27$59,990 Active 744-char remark
Show marketing remark (744 chars)
This well-maintained property offers 1 bedroom and 1 bathroom, thoughtfully designed for everyday comfort. Tiled floors throughout the home provide easy maintenance and a clean, modern feel. A dedicated laundry room adds convenience to your daily routine. The bedroom features a ceiling fan to help keep you cool, and the living room includes a fireplace, perfect for relaxing evenings. The kitchen is equipped with a single-range oven, dishwasher, and practical double sinks to make meal prep and cleanup easier. This property is being sold with three other investment properties. Kindly refer to these MLS numbers: 13480 S Thorntree Drive #508 - 15241348 13480 S Thorntree Drive #1206 - 88053105 13480 S Thorntree Drive #1004 - 64613388
-
2024-06-11historical $900
-
2024-02-29price $900
-
2024-02-06price $950
-
2024-01-13$1,000
-
2022-07-28$975 Active
-
2022-07-28historical
-
2022-06-14soldstatus
-
2022-04-07soldstatus
-
2022-04-05soldstatus Sold
-
2022-02-28status Pending
-
2022-02-28$43,000 Active
-
2022-02-07historical
-
2022-01-20$45,000 Active
-
1990-06-25soldstatus
ⓘ Source: listings_history table (triggers on properties + properties_extension) + one-shot
backfill from property_details.listing_events for pre-trigger history.
Tax reassessment forecast TX · Resets to sale price
- Current annual tax
- $771 · $64/mo
- Projected year-2 tax
- $897 · $75/mo
- Expected delta
- +$126/yr (+$10/mo · 16.3%)
ⓘ Screening estimate from a state-policy table — verify with the county assessor before closing.
Climate risk First Street
- Flood 3/10 Moderate FEMA zone X (unshaded) · 20% chance over 30 yrs
- Wildfire 1/10 Low
- Heat 10/10 Extreme 7 d/yr ≥109°F today · 25 d/yr by 30 yrs out
- Wind 9/10 Extreme 99% chance of damaging wind over 30 yrs
- Air quality 2/10 Low 2 unhealthy d/yr today · 2 by 30 yrs out
Nearby sold comps map
Loading sold comps map…
Walkable amenities ~0.75 mi
Loading nearby amenities…
Taxation est. · year 1
- Rental income
- $10,519
- − Mortgage interest
- −$2,745
- − Property taxes
- −$771
- − Insurance
- −$245
- − Repairs & maintenance
- −$842
- − Management
- −$842
- − HOA
- −$2,496
- − Depreciation
- −$1,425
- Taxable income
- $1,154
- Est. tax owed @ 24.0%
- −$277
- After-tax cash flow
- $1,438/yr
For passive investors: Depreciation is non-cash, so a rental often shows a tax loss while cash-flowing — sheltering income. Rental losses are passive: they offset passive income freely, and up to $25,000/yr can offset ordinary (W-2) income if you actively participate and your MAGI is under $100k (phasing out to $0 by $150k); unused losses carry forward. On sale, claimed depreciation is recaptured at up to 25%, and gains may owe capital-gains tax (a 1031 exchange can defer both). Figures are a year-1 estimate at your 24.0% rate — not tax advice; consult a CPA.
Schools (NCES district)
- District
- Galena Park ISD
- NCES district ID
- 4820250
- Math proficiency
- 32% ▼ -20.00%
- Reading proficiency
- 33% ▼ -7.00%
- Median HH income
- $43,158
- Composite
- 27.62/100
- National rank
- #6927
- State rank
- #578 of 826 in TX
Livability — Houston
- Score
- 74/100
- State rank
- #184
- US rank
- #4771
Category grades
Schools grade is shown separately in the Schools card above.
Census & demographics
- County
- Harris County · 4,702,590 people
- City population
- 3,226,434
- Metro
- Houston-The Woodlands-Sugar Land, TX
- Population (ZIP)
- 58,415
- Household income
- $57,753
- Rent vs Own
- Severe rent burden
- 1816.0
Population outlook (Harris County) Hauer SSP2
- Today (2025)
- 5,571,493 people
- By 2030
- 6,089,821 · +9.3%
- By 2040
- 7,142,806 · +28.2%
- By 2050
- 8,185,864 · +46.9%
- By 2075
- 10,574,329 · +89.8%
- By 2100
- 12,109,958 · +117.4%
Race, ethnicity, and origin ACS 2023
- Neighborhood character
- Predominantly Hispanic (77%)
- Race & ethnicity
- Hispanic / Latino 77% Two or more races 54% Black 14% White 6% Asian 1% Native American 1%
- Hispanic origin (detail)
- Mexican 60% Cuban 2%
- Foreign-born
- 33% · Canada, Vietnam
- Languages at home
- 31% English-only · Spanish 68% Vietnamese 1%
Political lean MEDSL · Harris
- 2024 margin
- Lean D (+5.5) · D 52.0% · R 46.4% · Other 1.6%
- 2008→2024 swing
- +3.9pp toward D · 2008: 1.6pp · 2024: 5.5pp
- All cycles
- 2024: D+5.5 2020: D+13.3 2016: D+12.4 2012: D+0.1 2008: D+1.6
Not yet ingested
- Civics
- —
Market trends
- HPI YoY
- ▼ -36.47%
- Current HPI
- 300.1821
- Rent YoY
- ▼ -0.83%
- Metro
- Houston-The Woodlands-Sugar Land, TX
- State GDP YoY
- ▲ 3.95%
- F500 in state
- 110
Industry mix (Fortune 500 HQ in TX)
| Industry | F500 HQs | Revenue |
|---|---|---|
| Energy | 16 | $1,198B |
|
||
| Technology | 5 | $198B |
|
||
| Engineering / Construction | 4 | $72B |
|
||
| Energy Services | 3 | $60B |
|
||
| Utilities | 3 | $41B |
|
||
| Healthcare | 2 | $330B |
|
||
Price history
+8.9% since first listed17 events — show timeline
- 2026-03-03 Price Changed $49,000 HARMLS
- 2025-09-15 Price Changed $52,000 HARMLS
- 2025-06-27 Listed $59,990 HARMLS
- 2024-06-11 Rental Removed $900 HARMLS
- 2024-02-29 Price Changed $900 HARMLS
- 2024-02-06 Price Changed $950 HARMLS
- 2024-01-13 Listed for Rent $1,000 HARMLS
- 2022-07-28 Listing Removed — HARMLS
- 2022-07-28 Listed $975 HARMLS
- 2022-06-14 Sold (Public Records) — Public Records
- 2022-04-07 Sold (Public Records) — Public Records
- 2022-04-05 Sold (MLS) — HARMLS
- 2022-02-28 Pending — HARMLS
- 2022-02-28 Listed $43,000 HARMLS
- 2022-02-07 Listing Removed — HARMLS
- 2022-01-20 Listed $45,000 HARMLS
- 1990-06-25 Sold (Public Records) — Public Records
Property tax history
+2.4%/yrLatest (2025): $771 · +24.9% YoY. Source: county tax records.
Cash-flow waterfall
monthlySold comps — $/sqft
last 12 mo · ≤1 miLoading sold comps…