8936 Coqui Song Ln · Connerton, FL
Flood risk No data
- FEMA flood zone
- —
- Chance of flooding over 30 yrs
- —
- Est. flood insurance / yr
- —
Fire risk No data
- Est. fire insurance / yr
- —
Heat risk No data
- Hot days now (above threshold)
- —
- Hot days in 30 yrs
- —
Wind risk No data
- Chance of severe wind over 30 yrs
- —
Air-quality risk No data
- Unhealthy air days now
- —
- Unhealthy air days in 30 yrs
- —
Risk factors via First Street. Map © Google.
Why this score? — see what drove the C grade
The composite is a weighted blend of 9 inputs, each scored 0–100. Each bar is that input's sub-score; the figure is the points it added to the 100-point composite (weight × sub-score).
- Cash flow +15.8/30.0
- ARV discount +12.8/15.0
- DSCR +4.9/10.0
- Condition / age +4.8/5.0
- 1% rule +4.3/10.0
- Schools +4.3/10.0
- Appreciation +4.2/10.0
- Livability +3.3/5.0
- Rent growth +2.5/5.0
$307,290
🖨 Deal sheet 📄 Offer letter ✓ Due diligence
Listing remarks
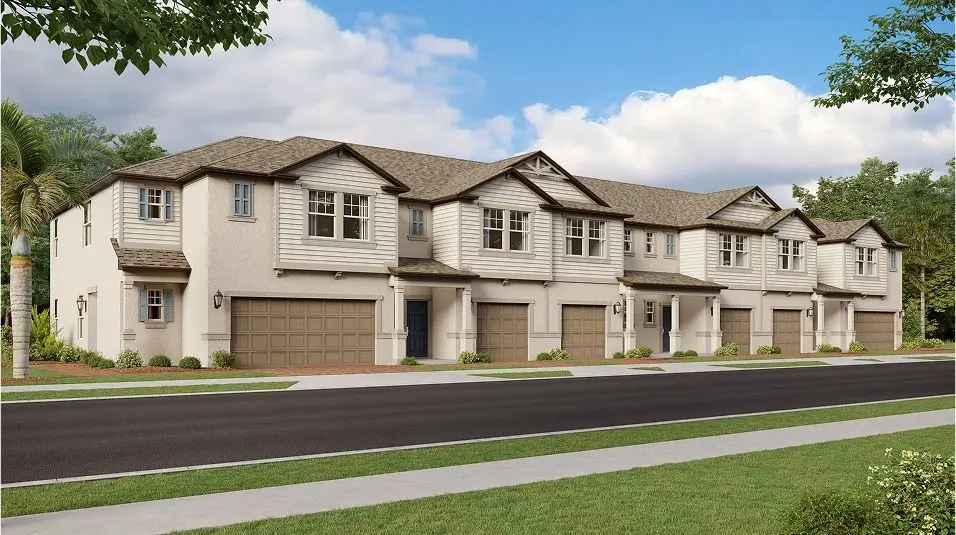
The first level of this two-story townhome is host to the communal living and dining spaces, arranged among a convenient and contemporary open floorplan. A sliding glass door at the back of the home leads to a covered patio ideal for relaxing and entertaining. A loft and three bedrooms occupy the second level, including the spacious owner's suite.
Key facts
- Open floorplan
- Covered patio
- 2 garage spots
Tags
Property features AI
Finance
- Financial info: List price $317,190
Exterior
- Parking: 1 garage space (1 parking space total)
- Home design: Single-family home
- Exterior features: Living area approximately 1,851
Interior
- Bedrooms: 3 bedrooms
- Bathrooms: 2 full bathrooms and 1 half bathroom (2.5 total)
- Interior features: Spec new construction (Juniper plan)
Neighborhood map
What this means for you Summary
Snapshot
- This is a 3-bed/2.5-bath townhouse listed at $307k. Condition is rated excellent.
Deal economics
- At list price, monthly cash flow is $138 ($2k/yr) — positive.
- The deal already cash-flows at list — no discount required.
- To meet the 1% rule (rent ≥ 1% of price), the offer needs to be $286k (6.8% below list).
- Recommended offer: $286k (6.8% below list) — sets the bar for 1% rule.
- Cap rate 6.8% vs local median 4.3% in Connerton — top-decile yield for the area; either an underpriced asset or a hidden risk that comps aren't pricing in. Stress-test before assuming the spread holds.
Location & tenants
- Location reads 66/100 on livability (#596 in FL) — a middle-class / working-renter tenant base. Strengths: crime A+, employment A+, housing A+; Watch: schools D+, amenities F, commute F.
- Pasco (suburban): math 50% / reading 52% proficiency, ranked #32 of 73 in FL (top 44%) — acceptable for families but not a draw, mixed tenant base, ~2y average lease.
- Market conditions: 285 active listings in the ZIP; 9 comparable units currently listed for rent nearby; rentals at typical pace (median 15d on market — plan ~3-4 weeks tenant-placement turnaround); high-income renter base; 6,765 units permitted in Pasco County in 2024 (1,250 in 5+ unit buildings).
Forward outlook
- Local home prices are declining (-1.5%/yr); year-one equity from $2k of loan paydown is wiped out by about $5k of value loss. Plan a longer hold.
- Pasco County population projected at +29% by 2050 — long-run rental-demand tailwind backs the buy-and-hold thesis.
Negotiation context
- It's been on market 16 days — a 2% lower offer ($303k) is reasonable based on typical stale-listing flexibility.
Questions for the listing agent
- Is there a deadline driving the sale (1031 exchange, divorce, estate, relocation)? That informs how much negotiation room exists.
- Schools are D-rated, which usually means shorter tenancies and higher turnover. Who's the typical renter profile here, and what's been the actual vacancy rate?
- What's the average days-on-market for RENTAL listings here right now (not sales)? A rising rental-DOM trend means longer vacancies and softer asking-rent achievability than the comps imply.
- What's the recent tenant-quality profile in this submarket — average credit score on applications, eviction rate, late-payment / NSF rate, and stable-employment percentage? A property-management company in the area should have these aggregated.
- How much new for-sale + rental construction is in the pipeline within 1–3 miles? Heavy new supply typically softens prices + rents 12–24 months out; constrained supply supports both.
Investment metrics
- 1% rule
- 0.93% ✗
- Cap rate
- 6.83%
- Cash-on-cash
- 1.93%
- DSCR
- 1.09
- GRM
- 8.9
CMA / ARV
- ARV (on-the-fly)
- $347,988
- Comps found
- 12
Show comp detail 12 sales within ~0.75 mi
| Address | Dist | Beds/Ba | Sqft | Sold | Price | $/sf | Match |
|---|---|---|---|---|---|---|---|
| 8859 Coqui Song Ln | 0.06mi | 3/2.5 | 1,851 (0%) | 4mo | $309,990 | $167 | 94 |
| 9044 Gallantree Pl | 0.28mi | 3/2.5 | 1,851 (0%) | 23mo | $344,900 | $186 | 68 |
| 9078 Gallantree Pl | 0.30mi | 3/2.5 | 1,851 (0%) | 23mo | $348,265 | $188 | 67 |
| 8775 Coquil Song Ln | 0.11mi | 3/2.5 | 1,601 (-14%) | 7mo | $268,040 | $167 | 67 |
| 9112 Gallantree Pl | 0.32mi | 3/2.5 | 1,851 (0%) | 22mo | $348,265 | $188 | 66 |
| 9106 Gallantree Pl | 0.32mi | 3/2.5 | 1,851 (0%) | 23mo | $348,765 | $188 | 66 |
| 9126 Gallantree Pl | 0.33mi | 3/2.5 | 1,851 (0%) | 22mo | $344,990 | $186 | 66 |
| 9443 Runaway Breeze Dr | 0.58mi | 3/2.5 | 1,851 (0%) | 13mo | $538,400 | $291 | 62 |
| 8953 Gallantree Pl | 0.25mi | 3/2.5 | 1,601 (-14%) | 9mo | $300,000 | $187 | 58 |
| 9084 Gallantree Pl | 0.31mi | 3/2.5 | 1,601 (-14%) | 23mo | $300,805 | $188 | 44 |
| 9118 Gallantree Pl | 0.33mi | 3/2.5 | 1,601 (-14%) | 22mo | $309,000 | $193 | 44 |
| 9124 Gallantree Pl | 0.33mi | 3/2.5 | 1,601 (-14%) | 22mo | $304,900 | $190 | 44 |
Match score weights: distance 35% · size 25% · config 20% · recency 20%. Top-matched comps best support the ARV.
Projected returns pro-forma
-1.54% appreciation · 3.0% rent growth · sell at horizon
- IRR
- -6.0%
- Equity multiple
- 0.75×
- Total profit
- $-21,694
- Equity at exit
- $66,313
- IRR
- 1.4%
- Equity multiple
- 1.12×
- Total profit
- $10,203
- Equity at exit
- $63,135
Cash invested: $86,041 (down + closing). Projections, not guarantees.
Landlord ↔ Tenant lean methodology
- Overall (STATE)
- 87 Strongly Landlord-Friendly
- State Florida
- 87 Strongly Landlord-Friendly · R+3
- County
- — inherits STATE
- City
- — inherits STATE
ZIP-level market 34637
- Home prices YoY
- -1.2%
- Active inventory
- 285
- Price-to-rent
- 8.9×
Monthly cashflow live
- Estimated rent
- $2,863 high interval (Pro) →
- Mortgage (P&I)
- −$1,611
- Tax est. 1.5%
- −$384 /mo · $4,609/yr
- Insurance
- −$128
- HOA
- −$0
- Vacancy / Maint / Mgmt
- −$601
- Net cashflow
- $138
Break-even live
UW: 25.0% down · 7.5% · 30yr · 1.5% tax · 5.0% vac · 8.0% maint · 8.0% mgmt
Financing live
Cash to close
- Down payment
- $76,822
- Closing costs
- $9,219
- Reserves months
- —
- Total cash needed
- —
Loan-product check · same deal, 3 products live
Conventional
25% down · 7.5% · 30yr
- Down + closing
- —
- Monthly P&I
- —
- Monthly cashflow
- —
- DSCR
- —
- Eligible?
- —
Personal DTI + credit; lowest rate.
DSCR
20% down · 8.5% · 30yr
- Down + closing
- —
- Monthly P&I
- —
- Monthly cashflow
- —
- DSCR
- —
- Eligible?
- —
No personal income docs; deal must DSCR.
Hard money
10% down · 12.0% · 12mo
- Down + closing
- —
- Monthly P&I
- —
- Monthly cashflow
- —
- DSCR
- —
- Eligible?
- —
Short-term bridge; refi at stabilization.
Rent comps 9 comps
| Address | Beds | Baths | Sqft | Rent | $/sqft | DOM | Units | Dist |
|---|---|---|---|---|---|---|---|---|
| 8862 Gallantree Pl Unit 8862-Townhouse Land O' Lakes, FL | 3.0 | 2.5 | 1601 | $2,195 | $1.37 | 12d | 1 | 0.24mi |
| 22310 Blazing Star Run Land O Lakes, FL | 4.0 | 2.5 | 1870 | $2,650 | $1.42 | 17d | 1 | 0.36mi |
| 9436 Scouter Bee Pl Land O' Lakes, FL | 2.0 | 2.5 | 1951 | $2,350 | $1.20 | 5d | 1 | 0.84mi |
| 9645 Carabiner Way Land O' Lakes, FL | 4.0 | 2.5 | 1870 | $2,700 | $1.44 | 24d | 1 | 0.91mi |
| 9676 Nyssa St Land O Lakes, FL | 3.0 | 2.5 | 1601 | $2,099 | $1.31 | 12d | 1 | 0.98mi |
| 21818 Lyonia Ln Land O Lakes, FL | 3.0 | 2.5 | 1601 | $2,250 | $1.41 | 14d | 1 | 1.01mi |
| 21869 Adriatic Ln Land O Lakes, FL | 3.0 | 2.5 | 1601 | $2,400 | $1.50 | 24d | 1 | 1.06mi |
| 21831 Adriatic Ln Land O Lakes, FL | 3.0 | 3.0 | 1601 | $1,995 | $1.25 | 5d | 1 | 1.08mi |
| 9750 Campanula Ct Land O Lakes, FL | 3.0 | 2.5 | 2208 | $2,700 | $1.22 | 24d | 1 | 1.10mi |
Listing history 8 events
-
2026-06-09days on market $307,290 Active 16 DOM
-
2026-06-08days on market $307,290 Active 15 DOM
-
2026-06-07pricedays on market $307,290 Active 14 DOM
-
2026-06-04days on market $307,190 Active 11 DOM
-
2026-06-03days on market $307,190 Active 10 DOM
-
2026-06-02pricedays on market $307,190 Active 9 DOM
-
2026-06-01days on market $317,190 Active 8 DOM
-
2026-05-31days on market $317,190 Active 7 DOM
ⓘ Source: listings_history table (triggers on properties + properties_extension) + one-shot
backfill from property_details.listing_events for pre-trigger history.
Nearby sold comps map
Loading sold comps map…
Walkable amenities ~0.75 mi
Loading nearby amenities…
Taxation est. · year 1
- Rental income
- $34,354
- − Mortgage interest
- −$17,213
- − Property taxes
- −$4,609
- − Insurance
- −$1,536
- − Repairs & maintenance
- −$2,748
- − Management
- −$2,748
- − Depreciation
- −$8,939
- Taxable loss
- −$3,441
- Est. tax savings @ 24.0%
- +$826
- After-tax cash flow
- $2,482/yr
For passive investors: Depreciation is non-cash, so a rental often shows a tax loss while cash-flowing — sheltering income. Rental losses are passive: they offset passive income freely, and up to $25,000/yr can offset ordinary (W-2) income if you actively participate and your MAGI is under $100k (phasing out to $0 by $150k); unused losses carry forward. On sale, claimed depreciation is recaptured at up to 25%, and gains may owe capital-gains tax (a 1031 exchange can defer both). Figures are a year-1 estimate at your 24.0% rate — not tax advice; consult a CPA.
Condition & rehab AI · 21 photos
This move-in-ready townhome is in excellent condition with modern finishes and a fresh paint job. It offers a great opportunity for both resale and rental value with minor updates that can further enhance its curb appeal and functionality.
Value-add opportunities
- Both Painting the exterior — Enhances curb appeal and value
- Both Landscaping the front yard — Improves curb appeal and rental value
- Resale Upgrading the kitchen appliances — Modernizes the kitchen and adds value
- Resale Upgrading the bathrooms with modern fixtures — Enhances the overall appeal and value
Renovation cost estimate screening
Value-add ROI direction
- Both Painting the exterior — Enhances curb appeal and value ↑
- Both Landscaping the front yard — Improves curb appeal and rental value ↑
- Resale Upgrading the kitchen appliances — Modernizes the kitchen and adds value ↑
- Resale Upgrading the bathrooms with modern fixtures — Enhances the overall appeal and value ↑
ⓘ Cost ranges are severity-bucket heuristics (US national rule-of-thumb). Get contractor quotes + a written scope before underwriting a rehab budget.
Schools (NCES district)
- District
- Pasco
- NCES district ID
- 1201530
- Math proficiency
- 50% ▼ -10.00%
- Reading proficiency
- 52% ▼ -5.00%
- Median HH income
- $45,039
- Composite
- 43.14/100
- National rank
- #3074
- State rank
- #32 of 73 in FL
Livability — Connerton
- Score
- 66/100
- State rank
- #596
- US rank
- #11437
Category grades
Schools grade is shown separately in the Schools card above.
Census & demographics
- Census place
- Connerton, FL
- County
- Pasco County · 524,098 people
- City population
- 11,398
- Metro
- Tampa-St. Petersburg-Clearwater, FL
- Population (ZIP)
- 13,049
- Household income
- $115,214
- Rent vs Own
- Severe rent burden
- 96.0
Population outlook (Pasco County) Hauer SSP2
- Today (2025)
- 570,045 people
- By 2030
- 605,844 · +6.3%
- By 2040
- 674,806 · +18.4%
- By 2050
- 736,022 · +29.1%
- By 2075
- 862,900 · +51.4%
- By 2100
- 906,364 · +59.0%
Race, ethnicity, and origin ACS 2023
- Neighborhood character
- Predominantly White (70%)
- Race & ethnicity
- White 70% Hispanic / Latino 16% Two or more races 10% Black 7% Asian 5%
- Hispanic origin (detail)
- Mexican 1% Puerto Rican 10% Cuban 1%
- Common ancestry
- Romanian 5% Italian 3% Iranian 2%
- Foreign-born
- 8% · Canada
- Languages at home
- 85% English-only · Spanish 8% Other Indo-European 4% Tagalog/Filipino 1%
Political lean MEDSL · Pasco
- 2024 margin
- Strong R (+25.2) · D 36.9% · R 62.1% · Other 1.0%
- 2008→2024 swing
- -21.6pp toward R · 2008: -3.6pp · 2024: -25.2pp
- All cycles
- 2024: R+25.2 2020: R+20.1 2016: R+21.6 2012: R+6.7 2008: R+3.6
Not yet ingested
- Civics
- —
Market trends
- HPI YoY
- ▼ -1.54%
- Current HPI
- 126.1415
- Rent YoY
- —
- Metro
- Tampa-St. Petersburg-Clearwater, FL
- State GDP YoY
- ▲ 3.28%
- F500 in state
- 36
Industry mix (Fortune 500 HQ in FL)
| Industry | F500 HQs | Revenue |
|---|---|---|
| Industrial Technology | 2 | $29B |
|
||
| Insurance | 2 | $17B |
|
||
| Retail | 1 | $60B |
|
||
| Technology Distribution | 1 | $58B |
|
||
| Homebuilding | 1 | $35B |
|
||
| Technology Manufacturing | 1 | $35B |
|
||
Cash-flow waterfall
monthlySold comps — $/sqft
last 12 mo · ≤1 miLoading sold comps…