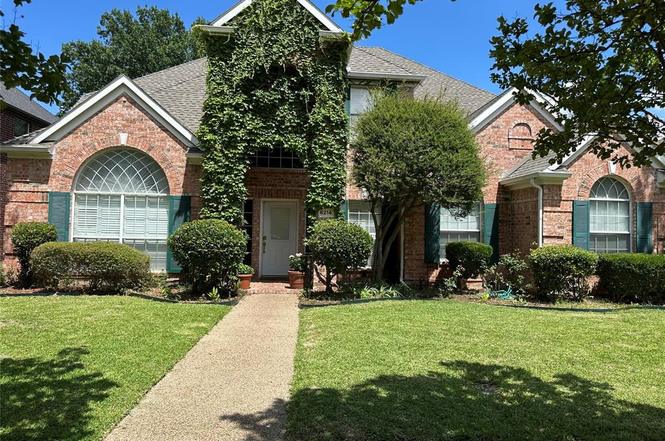
6214 Hidden Springs Ln · Garland, TX
Flood risk 1/10 · Minimal
- FEMA flood zone
- X (unshaded)
- Chance of flooding over 30 yrs
- 0.0%
- Est. flood insurance / yr
- $507 – $1,088
Fire risk 1/10 · Minimal
- Est. fire insurance / yr
- $1,222 – $2,270
Heat risk 7/10 · Major
- Hot days now (above 109°F)
- 7 days/yr
- Hot days in 30 yrs
- 23 days/yr
Wind risk 6/10 · Moderate
- Chance of severe wind over 30 yrs
- 27.0%
Air-quality risk 3/10 · Minor
- Unhealthy air days now
- 3 days/yr
- Unhealthy air days in 30 yrs
- 4 days/yr
Risk factors via First Street. Map © Google.
Why this score? — see what drove the D+ grade
The composite is a weighted blend of 9 inputs, each scored 0–100. Each bar is that input's sub-score; the figure is the points it added to the 100-point composite (weight × sub-score).
- Cash flow +13.2/30.0
- ARV discount +12.5/15.0
- 1% rule +4.4/10.0
- DSCR +4.0/10.0
- Schools +3.7/10.0
- Livability +3.7/5.0
- Condition / age +2.5/5.0
- Rent growth +2.3/5.0
- Appreciation +0.0/10.0
$649,000
🖨 Deal sheet (PDF) 📄 Offer letter ✓ Due diligence
Listing remarks MLS
Impeccably maintained 1 owner home located in RISD greets you with a warm welcome with the lush ivy wall. Upon entry you experience the high ceiling with the dramatic staircase and stately crown molding designed for entertaining. The home offers spacious rooms throughout. Efficient work space in the kitchen opens to den. Master bedroom has a seating area used for an office. Office includes a closet can be converted to a 5th bedroom connecting with a full size bathroom. Unwind in a massive media room with built in cabinets. Uniquely features 2 bedrooms to open up to join as 1 large bedroom. A captivating design element includes a treehouse feel while looking out the upstairs showcase window's ivy wall.
Key facts
- High ceiling
- Massive media room
- Efficient work space
Tags
Property features AI
Finance
- Financial info: Treat as clear loan type; No second mortgage indicated
- HOA & community: Mandatory HOA with annual fee ($150) — full use of facilities; HOA management: Spring Park
Exterior
- Parking: Attached 2-car garage (22' wide x 18' long); 2 covered spaces; 2 carport spaces; Garage with double doors
- Utilities: City water; City sewer; Not in a municipal utility district
- Home design: Single-family residence; Two levels; Residential property
- Construction: Built in 1994
- Exterior features: Lot less than 0.5 acre (approximately 0.181 acres); Subdivision: Big Spgs Court; Directions: From N Jupiter Rd go to West and turn right on W Campbell Rd and turn right on Hidden Springs Ln.
Interior
- Kitchen: Dishwasher; Disposal; Electric cooktop
- Bedrooms: Primary bedroom on level 1 (17 x 14); Bedroom on level 2 (12 x 12); Bedroom on level 2 (10 x 12); Total of 4 bedrooms
- Bathrooms: 3 full bathrooms; 1 half bathroom
- Interior features: Cable TV available; Two living areas; One dining area; Room count: 4; Gas log fireplace
Neighborhood map
What this means for you Summary
Snapshot
- This is a 4-bed/3.5-bath single-family listed at $649k.
Deal economics
- At list price, monthly cash flow is $-9 ($-109/yr) — negative.
- To cash-flow at today's rent, offer at most $647k (0.2% below list).
- To meet the 1% rule (rent ≥ 1% of price), the offer needs to be $611k (5.9% below list).
- Recommended offer: $611k (5.9% below list) — sets the bar for 1% rule.
- Cap rate 6.3% vs local median 3.5% in Garland — top-decile yield for the area; either an underpriced asset or a hidden risk that comps aren't pricing in. Stress-test before assuming the spread holds.
Location & tenants
- Location reads 74/100 on livability (#165 in TX, #4,447 nationally) — a middle-class / working-renter tenant base. Strengths: commute A+, housing A+, cost of living A-; Watch: amenities C-, health & safety F.
- Richardson ISD (urban): math 40% / reading 44% proficiency, ranked #316 of 826 in TX (top 38%) — families likely to look elsewhere, expect single-tenant / working-renter base with shorter leases.
- Zoned schools: Big Springs El (math 47% / reading 42%, grade F, #1,155 of 4,322 statewide, top 29%, 390 students, 44% FRL); Apollo J H (math 28% / reading 42%, grade F, #842 of 1,662 statewide, top 51%, 639 students, 63% FRL); Berkner H S (math 20% / reading 45%, grade F, #1,029 of 1,632 statewide, top 64%, 2,290 students, 64% FRL) — zoned schools at 57% FRL track the district average.
- Market conditions: Rents soft (-1.0%/yr); 185 active listings in the ZIP; 3 comparable units currently listed for rent nearby; rentals lingering (median 46d on market — plan ~5-8 weeks vacancy on turnover, expect pricing pressure); 100% of comp listings sitting > 30 days — soft ceiling on asking rent; solid renter incomes; 12,577 units permitted in Dallas County in 2024 (6,829 in 5+ unit buildings).
- At $6,108/mo this rent would consume 80% of the median local household income ($92k/yr) (locally 1537% of renters already pay >50% of income on rent) — very limited rent-growth headroom before tenants either downsize or default.
Forward outlook
- Local home prices are declining (-3.0%/yr); year-one equity from $4k of loan paydown is wiped out by about $19k of value loss. Plan a longer hold.
- Dallas County population projected at +35% by 2050 — long-run rental-demand tailwind backs the buy-and-hold thesis.
Negotiation context
- Only 4 days on market — expect competitive offers; lowballing is unlikely to land.
- 2 sale attempts since 5y ago with the ask held roughly flat each time — persistent listings suggest the price (not the market) is what's stuck; bring a comps-based counter.
Risks & watch-outs
- Climate carrying-cost: major wind risk, 27% chance of damaging wind over 30y; extreme-heat days projected 7→23/yr by 2055 (HVAC capex compounding) — expect insurance premiums to compound above CPI over the hold.
Questions for the listing agent
- What do current leases actually rent for vs. the listed asking? Can we see a recent rent roll and the last 12 months of T-12 income?
- What does the HOA fee cover, when was the last increase, and are there any pending special assessments or reserve-fund shortfalls?
- Is there a deadline driving the sale (1031 exchange, divorce, estate, relocation)? That informs how much negotiation room exists.
- Schools are D-rated, which usually means shorter tenancies and higher turnover. Who's the typical renter profile here, and what's been the actual vacancy rate?
- The area grade is low — what's the realistic commute time and amenity access for the typical tenant pool here? Any planned neighborhood developments (good or bad) we should know about?
- What's the average days-on-market for RENTAL listings here right now (not sales)? A rising rental-DOM trend means longer vacancies and softer asking-rent achievability than the comps imply.
- What's the recent tenant-quality profile in this submarket — average credit score on applications, eviction rate, late-payment / NSF rate, and stable-employment percentage? A property-management company in the area should have these aggregated.
- How much new for-sale + rental construction is in the pipeline within 1–3 miles? Heavy new supply typically softens prices + rents 12–24 months out; constrained supply supports both.
Investment metrics
- 1% rule
- 0.94% ✗
- Cap rate
- 6.28%
- Cash-on-cash
- -0.06%
- DSCR
- 1.00
- GRM
- 8.9
CMA / ARV
- ARV (on-the-fly)
- $730,131
- Comps found
- 11
Show comp detail 11 sales within ~0.75 mi
| Address | Dist | Beds/Ba | Sqft | Sold | Price | $/sf | Match |
|---|---|---|---|---|---|---|---|
| 1807 Meadowcove Dr | 0.27mi | 4/4.0 | 3,740 (+2%) | 1mo | $680,000 | $182 | 81 |
| 1902 Spring Meadow Ln | 0.39mi | 4/3.0 | 3,568 (-3%) | 1mo | $708,900 | $199 | 74 |
| 2007 Hill Haven Cir | 0.20mi | 4/3.5 | 3,732 (+2%) | 16mo | $825,000 | $221 | 74 |
| 7622 Windmill Ln | 0.72mi | 4/3.5 | 3,819 (+4%) | 0mo | $650,000 | $170 | 60 |
| 1808 Forest Meadow Ln | 0.30mi | 4/3.0 | 3,347 (-9%) | 12mo | $668,000 | $200 | 59 |
| 6737 Lake Shore Dr | 0.38mi | 4/3.0 | 3,396 (-7%) | 11mo | $799,000 | $235 | 59 |
| 1908 Country Meadow Ln | 0.38mi | 4/3.0 | 3,193 (-13%) | 13mo | $550,000 | $172 | 48 |
| 2001 Campbell Pkwy | 0.33mi | 5/3.0 (+1) | 3,138 (-14%) | 7mo | $650,000 | $207 | 48 |
| 6709 Callejo Rd | 0.64mi | 4/3.0 | 3,875 (+6%) | 22mo | $749,000 | $193 | 40 |
| 2101 Belleview Ct | 0.62mi | 4/3.0 | 3,257 (-11%) | 19mo | $708,000 | $217 | 35 |
| 2802 Crystal Falls Dr | 0.55mi | 4/3.5 | 3,121 (-15%) | 24mo | $600,000 | $192 | 30 |
Match score weights: distance 35% · size 25% · config 20% · recency 20%. Top-matched comps best support the ARV.
Projected returns pro-forma
-3.0% appreciation · 0.0% rent growth · sell at horizon
- IRR
- -20.1%
- Equity multiple
- 0.32×
- Total profit
- $-123,340
- Equity at exit
- $96,768
- IRR
- -22.2%
- Equity multiple
- 0.03×
- Total profit
- $-176,080
- Equity at exit
- $56,114
Cash invested: $181,720 (down + closing). Projections, not guarantees.
Landlord ↔ Tenant lean methodology
- Overall (STATE)
- 87 Strongly Landlord-Friendly
- State Texas
- 87 Strongly Landlord-Friendly · R+5
- County
- — inherits STATE
- City
- — inherits STATE
ZIP-level market 75044
- Rents YoY
- -1.0%
- Active inventory
- 185
- Price-to-rent
- 8.9×
Monthly cashflow live
- Estimated rent
- $6,108 medium interval (Pro) →
- Mortgage (P&I)
- −$3,403
- Tax from tax record
- −$1,148 /mo · $13,771/yr
- Insurance
- −$270
- HOA
- −$13
- Vacancy / Maint / Mgmt
- −$1,283
- Net cashflow
- $-9
Break-even live
Sensitivity live
| Price | -10% $358 | -5% $175 | +0% $-9 | +5% $-193 | +10% $-376 |
|---|---|---|---|---|---|
| Rent | -10% $-492 | -5% $-250 | +0% $-9 | +5% $232 | +10% $473 |
| Rate | -1.0pp $318 | -0.5pp $156 | base $-9 | +0.5pp $-177 | +1.0pp $-348 |
UW: 25.0% down · 7.5% · 30yr · 1.5% tax · 5.0% vac · 8.0% maint · 8.0% mgmt
Financing live
Cash to close
- Down payment
- $162,250
- Closing costs
- $19,470
- Reserves months
- —
- Total cash needed
- —
Loan-product check · same deal, 3 products live
Conventional
25% down · 7.5% · 30yr
- Down + closing
- —
- Monthly P&I
- —
- Monthly cashflow
- —
- DSCR
- —
- Eligible?
- —
Personal DTI + credit; lowest rate.
DSCR
20% down · 8.5% · 30yr
- Down + closing
- —
- Monthly P&I
- —
- Monthly cashflow
- —
- DSCR
- —
- Eligible?
- —
No personal income docs; deal must DSCR.
Hard money
10% down · 12.0% · 12mo
- Down + closing
- —
- Monthly P&I
- —
- Monthly cashflow
- —
- DSCR
- —
- Eligible?
- —
Short-term bridge; refi at stabilization.
Rent comps 3 comps
| Address | Beds | Baths | Sqft | Rent | $/sqft | DOM | Units | Dist |
|---|---|---|---|---|---|---|---|---|
| 1811 Forest Meadow Ln Richardson, TX | 5.0 | 4.5 | 3883 | $9,750 | $2.51 | 45d | 1 | 0.33mi |
| 2505 Rodeo Ct Garland, TX | 5.0 | 5.0 | 3026 | $3,800 | $1.26 | 45d | 1 | 0.95mi |
| 1813 Weanne Dr Richardson, TX | 4.0 | 3.5 | 3896 | $3,950 | $1.01 | 45d | 1 | 1.39mi |
HOA detail
- Monthly dues
- $13 · $156/yr
Listing history 3 events
-
2026-06-21days on market $649,000 Active 4 DOM
-
2026-06-18remarks 699-char remark
-
2026-06-18$649,000 Active 1 DOM
ⓘ Source: listings_history table (triggers on properties + properties_extension) + one-shot
backfill from property_details.listing_events for pre-trigger history.
Tax reassessment forecast TX · Resets to sale price
- Current annual tax
- $13,771 · $1,148/mo
- Projected year-2 tax
- $13,771 · $1,148/mo
- Expected delta
- $0/yr ($0/mo · 0.0%)
ⓘ Screening estimate from a state-policy table — verify with the county assessor before closing.
Climate risk First Street
- Flood 1/10 Low FEMA zone X (unshaded) · 0% chance over 30 yrs
- Wildfire 1/10 Low
- Heat 7/10 Severe 7 d/yr ≥109°F today · 23 d/yr by 30 yrs out
- Wind 6/10 Major 27% chance of damaging wind over 30 yrs
- Air quality 3/10 Moderate 3 unhealthy d/yr today · 4 by 30 yrs out
Nearby sold comps map
Loading sold comps map…
Walkable amenities ~0.75 mi
Loading nearby amenities…
Taxation est. · year 1
- Rental income
- $73,296
- − Mortgage interest
- −$36,354
- − Property taxes
- −$13,771
- − Insurance
- −$3,245
- − Repairs & maintenance
- −$5,864
- − Management
- −$5,864
- − HOA
- −$156
- − Depreciation
- −$18,880
- Taxable loss
- −$10,838
- Est. tax savings @ 24.0%
- +$2,601
- After-tax cash flow
- $2,492/yr
For passive investors: Depreciation is non-cash, so a rental often shows a tax loss while cash-flowing — sheltering income. Rental losses are passive: they offset passive income freely, and up to $25,000/yr can offset ordinary (W-2) income if you actively participate and your MAGI is under $100k (phasing out to $0 by $150k); unused losses carry forward. On sale, claimed depreciation is recaptured at up to 25%, and gains may owe capital-gains tax (a 1031 exchange can defer both). Figures are a year-1 estimate at your 24.0% rate — not tax advice; consult a CPA.
Schools (NCES district)
- District
- Richardson ISD
- NCES district ID
- 4837020
- Math proficiency
- 40% ▼ -14.00%
- Reading proficiency
- 44% ▼ -6.00%
- Median HH income
- $54,609
- Composite
- 36.58/100
- National rank
- #4633
- State rank
- #316 of 826 in TX
Livability — Garland
- Score
- 74/100
- State rank
- #165
- US rank
- #4447
Category grades
Schools grade is shown separately in the Schools card above.
Census & demographics
- Census place
- Garland, TX
- County
- Dallas County · 2,612,404 people
- City population
- 246,342
- Metro
- Dallas-Fort Worth-Arlington, TX
- Population (ZIP)
- 47,529
- Household income
- $92,178
- Rent vs Own
- Severe rent burden
- 1537.0
Population outlook (Dallas County) Hauer SSP2
- Today (2025)
- 2,979,839 people
- By 2030
- 3,191,823 · +7.1%
- By 2040
- 3,619,611 · +21.5%
- By 2050
- 4,026,915 · +35.1%
- By 2075
- 4,957,073 · +66.4%
- By 2100
- 5,508,725 · +84.9%
Race, ethnicity, and origin ACS 2023
- Neighborhood character
- Highly diverse neighborhood (Simpson 0.76)
- Race & ethnicity
- White 33% Hispanic / Latino 27% Two or more races 21% Asian 18% Black 17%
- Hispanic origin (detail)
- Mexican 20% Puerto Rican 1%
- Common ancestry
- Lithuanian 2% Slovak 1% Serbian 1%
- Foreign-born
- 28% · Canada, Vietnam, China
- Languages at home
- 57% English-only · Spanish 21% Vietnamese 10% Other Indo-European 3%
Political lean MEDSL · Dallas
- 2024 margin
- Strong D (+22.2) · D 60.2% · R 38.0% · Other 1.8%
- 2008→2024 swing
- +6.9pp toward D · 2008: 15.3pp · 2024: 22.2pp
- All cycles
- 2024: D+22.2 2020: D+31.6 2016: D+26.2 2012: D+15.4 2008: D+15.3
Not yet ingested
- Civics
- —
Market trends
- HPI YoY
- ▼ -228.55%
- Current HPI
- 264.0295
- Rent YoY
- ▼ -0.96%
- Metro
- Dallas-Fort Worth-Arlington, TX
- State GDP YoY
- ▲ 3.95%
- F500 in state
- 110
Industry mix (Fortune 500 HQ in TX)
| Industry | F500 HQs | Revenue |
|---|---|---|
| Energy | 16 | $1,198B |
|
||
| Technology | 5 | $198B |
|
||
| Engineering / Construction | 4 | $72B |
|
||
| Energy Services | 3 | $60B |
|
||
| Utilities | 3 | $41B |
|
||
| Healthcare | 2 | $330B |
|
||
Price history
+38.1% since first listed5 events — show timeline
- 2026-06-17 Listed $649,000 NTREIS
- 2021-07-22 Sold (Public Records) — Public Records
- 2021-07-21 Sold (MLS) — NTREIS
- 2021-06-22 Pending — NTREIS
- 2021-06-17 Listed $470,000 NTREIS
Property tax history
+4.8%/yrLatest (2025): $13,771 · -4.4% YoY. Source: county tax records.
Cash-flow waterfall
monthlySold comps — $/sqft
last 12 mo · ≤1 miLoading sold comps…