 🏗️ New Construction
King Plan · Katy, TX
Flood risk 1/10 · Minimal
- FEMA flood zone
- X (unshaded)
- Chance of flooding over 30 yrs
- 0.0%
- Est. flood insurance / yr
- $507 – $1,088
Fire risk 4/10 · Minor
- Est. fire insurance / yr
- $1,222 – $2,270
Heat risk 9/10 · Severe
- Hot days now (above 110°F)
- 7 days/yr
- Hot days in 30 yrs
- 23 days/yr
Wind risk 9/10 · Severe
- Chance of severe wind over 30 yrs
- 99.0%
Air-quality risk 2/10 · Minimal
- Unhealthy air days now
- 1 days/yr
- Unhealthy air days in 30 yrs
- 1 days/yr
Risk factors via First Street. Map © Google.
Why this score? — see what drove the F grade
The composite is a weighted blend of 9 inputs, each scored 0–100. Each bar is that input's sub-score; the figure is the points it added to the 100-point composite (weight × sub-score).
- Cash flow +9.4/30.0
- ARV discount +7.5/15.0
- Condition / age +4.0/5.0
- Livability +3.8/5.0
- 1% rule +2.8/10.0
- DSCR +2.6/10.0
- Rent growth +2.3/5.0
- Schools +2.0/10.0
- Appreciation +0.0/10.0
$242,990
🖨 Deal sheet (PDF) 📄 Offer letter ✓ Due diligence
Listing remarks
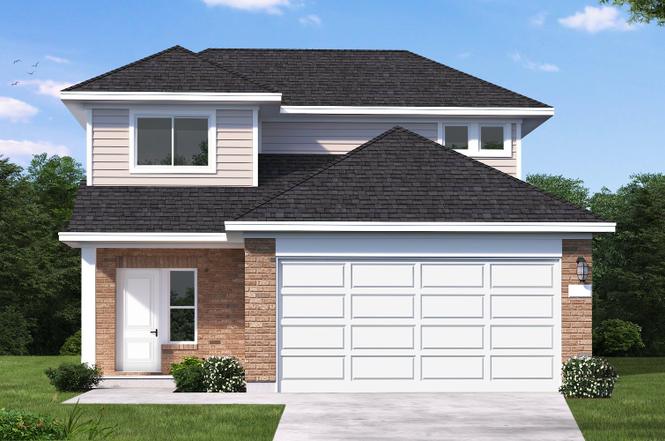
The King floor plan is a thoughtfully designed two-story home with three bedrooms, two and a half bathrooms, and a spacious two-car garage. The first floor features an open-concept layout with a well-appointed kitchen flowing into the dining and living areas, ideal for entertaining. Upstairs, the owner's suite offers a private retreat with a generous walk-in closet and en-suite bathroom, while two additional bedrooms provide comfort and flexibility. With its functional design and inviting spaces, the King plan delivers a perfect blend of style and convenience. * Photos and Virtual Tours may be of the same home plan located in a different neighborhood. Features and elevations may vary.
Key facts
- 2 garage spots
- Listed 4 days
Property features AI
Finance
- Financial info: List price: $314,185
Exterior
- Parking: 2 total parking spaces; 2-car garage
- Home design: Single-family plan (new construction inventory type: Plan)
- Exterior features: Address: 3001 Bella Hills Ln, Katy, TX 77493
Interior
- Bedrooms: 3 bedrooms
- Bathrooms: 2 full bathrooms and 1 half bathroom (2.5 total)
- Interior features: Open living area (approx. 1792 living area); Plan: King
Neighborhood map
What this means for you Summary
Snapshot
- This is a 3-bed/2.5-bath single-family listed at $243k. Condition is rated good.
Deal economics
- At list price, monthly cash flow is $-211 ($-3k/yr) — negative.
- The deal already cash-flows at list — no discount required.
- To meet the 1% rule (rent ≥ 1% of price), the offer needs to be $229k (5.8% below list).
- Recommended offer: $229k (5.8% below list) — sets the bar for 1% rule.
- Cap rate 5.4% vs local median 3.0% in Katy — top-decile yield for the area; either an underpriced asset or a hidden risk that comps aren't pricing in. Stress-test before assuming the spread holds.
Location & tenants
- Location reads 76/100 on livability (#111 in TX, #3,613 nationally) — a middle-class / working-renter tenant base. Strengths: employment A+, cost of living A+, housing A+; Watch: crime C-, amenities D, commute F.
- Royal ISD (rural): math 23% / reading 23% proficiency, ranked #744 of 826 in TX (top 90%) — low school quality limits family demand, transient renter base, plan for 1-2y turnover; 77% free/reduced lunch — lower-income household profile, screen leases tightly.
- Zoned schools: Royal El (math 27% / reading 20%, grade F, #3,247 of 4,322 statewide, top 76%, 762 students, 78% FRL); Royal J H (math 22% / reading 23%, grade F, #1,341 of 1,662 statewide, top 82%, 593 students, 73% FRL); Royal H S (math 17% / reading 26%, grade F, #1,377 of 1,632 statewide, top 85%, 842 students, 71% FRL) — zoned schools at 74% FRL track the district average.
- Market conditions: Rents soft (-0.8%/yr); 2729 active listings in the ZIP; 8 comparable units currently listed for rent nearby; rentals leasing fast (median 5d on market — plan ~1-2 weeks tenant-placement turnaround); high-income renter base; 483 units permitted in Waller County in 2024 (89 in 5+ unit buildings).
Forward outlook
- Local home prices are declining (-3.0%/yr); year-one equity from $2k of loan paydown is wiped out by about $9k of value loss. Plan a longer hold.
- Waller County population projected at +62% by 2050 — long-run rental-demand tailwind backs the buy-and-hold thesis.
Negotiation context
- Only 4 days on market — expect competitive offers; lowballing is unlikely to land.
Risks & watch-outs
- Climate carrying-cost: severe wind risk, 99% chance of damaging wind over 30y; extreme-heat days projected 7→23/yr by 2055 (HVAC capex compounding) — expect insurance premiums to compound above CPI over the hold.
Questions for the listing agent
- What do current leases actually rent for vs. the listed asking? Can we see a recent rent roll and the last 12 months of T-12 income?
- Is there a deadline driving the sale (1031 exchange, divorce, estate, relocation)? That informs how much negotiation room exists.
- Schools are B-rated — typically a magnet for longer-tenancy family renters. What's the average tenant stay here, and is there a school-zone premium baked into asking?
- The area grade is low — what's the realistic commute time and amenity access for the typical tenant pool here? Any planned neighborhood developments (good or bad) we should know about?
- What's the average days-on-market for RENTAL listings here right now (not sales)? A rising rental-DOM trend means longer vacancies and softer asking-rent achievability than the comps imply.
- What's the recent tenant-quality profile in this submarket — average credit score on applications, eviction rate, late-payment / NSF rate, and stable-employment percentage? A property-management company in the area should have these aggregated.
- How much new for-sale + rental construction is in the pipeline within 1–3 miles? Heavy new supply typically softens prices + rents 12–24 months out; constrained supply supports both.
Investment metrics
- 1% rule
- 0.78% ✗
- Cap rate
- 5.43%
- Cash-on-cash
- -3.09%
- DSCR
- 0.86
- GRM
- 10.6
CMA / ARV
- ARV (on-the-fly)
- $292,096
- Comps found
- 10
Show comp detail 10 sales within ~0.75 mi
| Address | Dist | Beds/Ba | Sqft | Sold | Price | $/sf | Match |
|---|---|---|---|---|---|---|---|
| 1033 Texas Timbers Dr | 0.50mi | 3/2.0 | 1,621 (-10%) | 2mo | $245,000 | $151 | 58 |
| 309 Barrel Cactus Dr | 0.47mi | 3/2.0 | 1,621 (-10%) | 5mo | $265,000 | $163 | 55 |
| 925 Texas Timbers Dr | 0.33mi | 3/2.0 | 1,622 (-10%) | 16mo | $270,000 | $166 | 54 |
| 313 Lone Mountain Dr | 0.49mi | 4/2.0 (+1) | 1,855 (+4%) | 23mo | $275,000 | $148 | 45 |
| 2045 Mule Ridge Dr | 0.73mi | 3/2.0 | 1,621 (-10%) | 6mo | $245,000 | $151 | 43 |
| 2040 Mule Ridge Dr | 0.70mi | 3/2.0 | 1,621 (-10%) | 8mo | $250,000 | $154 | 43 |
| 377 Barrel Cactus Dr | 0.65mi | 4/2.0 (+1) | 1,855 (+4%) | 18mo | $315,000 | $170 | 42 |
| 1012 Thunder Field Dr | 0.66mi | 4/2.0 (+1) | 1,855 (+4%) | 21mo | $280,000 | $151 | 39 |
| 1009 Thunder Field Dr | 0.63mi | 3/2.0 | 1,621 (-10%) | 18mo | $270,000 | $167 | 38 |
| 353 Barrel Cactus Dr | 0.59mi | 3/2.0 | 1,621 (-10%) | 23mo | $280,000 | $173 | 35 |
Match score weights: distance 35% · size 25% · config 20% · recency 20%. Top-matched comps best support the ARV.
Projected returns pro-forma
-3.0% appreciation · 0.0% rent growth · sell at horizon
- IRR
- -24.9%
- Equity multiple
- 0.18×
- Total profit
- $-67,419
- Equity at exit
- $43,552
- IRR
- -33.1%
- Equity multiple
- -0.24×
- Total profit
- $-101,761
- Equity at exit
- $25,255
Cash invested: $81,787 (down + closing). Projections, not guarantees.
Landlord ↔ Tenant lean methodology
- Overall (STATE)
- 87 Strongly Landlord-Friendly
- State Texas
- 87 Strongly Landlord-Friendly · R+5
- County
- — inherits STATE
- City
- — inherits STATE
ZIP-level market 77493
- Rents YoY
- -0.8%
- Active inventory
- 2729
- Price-to-rent
- 8.8×
Monthly cashflow live
- Estimated rent
- $2,289 high interval (Pro) →
- Mortgage (P&I)
- −$1,532
- Tax est. 1.5%
- −$365 /mo · $4,381/yr
- Insurance
- −$122
- HOA
- −$0
- Vacancy / Maint / Mgmt
- −$481
- Net cashflow
- $-211
Break-even live
Sensitivity live
| Price | -10% $-9 | -5% $-110 | +0% $-211 | +5% $-312 | +10% $-412 |
|---|---|---|---|---|---|
| Rent | -10% $-391 | -5% $-301 | +0% $-211 | +5% $-120 | +10% $-30 |
| Rate | -1.0pp $-64 | -0.5pp $-136 | base $-211 | +0.5pp $-286 | +1.0pp $-363 |
UW: 25.0% down · 7.5% · 30yr · 1.5% tax · 5.0% vac · 8.0% maint · 8.0% mgmt
Financing live
Cash to close
- Down payment
- $73,024
- Closing costs
- $8,763
- Reserves months
- —
- Total cash needed
- —
Loan-product check · same deal, 3 products live
Conventional
25% down · 7.5% · 30yr
- Down + closing
- —
- Monthly P&I
- —
- Monthly cashflow
- —
- DSCR
- —
- Eligible?
- —
Personal DTI + credit; lowest rate.
DSCR
20% down · 8.5% · 30yr
- Down + closing
- —
- Monthly P&I
- —
- Monthly cashflow
- —
- DSCR
- —
- Eligible?
- —
No personal income docs; deal must DSCR.
Hard money
10% down · 12.0% · 12mo
- Down + closing
- —
- Monthly P&I
- —
- Monthly cashflow
- —
- DSCR
- —
- Eligible?
- —
Short-term bridge; refi at stabilization.
Rent comps 8 comps
| Address | Beds | Baths | Sqft | Rent | $/sqft | DOM | Units | Dist |
|---|---|---|---|---|---|---|---|---|
| 116 Thorton Vine Dr Katy, TX | 3.0 | 2.0 | 1621 | $1,929 | $1.19 | 4d | 1 | 0.37mi |
| 206 Emma Rose Dr Katy, TX | 4.0 | 2.0 | 1658 | $2,290 | $1.38 | 0d | 1 | 0.47mi |
| 435 Lone Rider Dr Katy, TX | 3.0 | 2.0 | 1350 | $1,895 | $1.40 | 45d | 1 | 1.04mi |
| 452 Texas Pecan Dr Katy, TX | 3.0 | 2.0 | 1522 | $1,995 | $1.31 | 26d | 1 | 1.04mi |
| 401 San Miguel Creek Dr Katy, TX | 3.0 | 2.0 | 1579 | $1,945 | $1.23 | 5d | 1 | 1.13mi |
| 404 San Miguel Creek Dr Katy, TX | 4.0 | 2.0 | 1658 | $2,290 | $1.38 | 0d | 1 | 1.16mi |
| 408 San Miguel Creek Dr Katy, TX | 3.0 | 2.0 | 1579 | $2,265 | $1.43 | 0d | 1 | 1.16mi |
| 412 San Miguel Creek Dr Katy, TX | 3.0 | 2.0 | 1366 | $2,040 | $1.49 | 0d | 1 | 1.16mi |
Listing history 3 events
-
2026-06-21pricedays on market $242,990 Active 4 DOM
-
2026-06-18remarks 693-char remark
-
2026-06-18$314,185 Active 1 DOM
ⓘ Source: listings_history table (triggers on properties + properties_extension) + one-shot
backfill from property_details.listing_events for pre-trigger history.
Climate risk First Street
- Flood 1/10 Low FEMA zone X (unshaded) · 0% chance over 30 yrs
- Wildfire 4/10 Moderate
- Heat 9/10 Extreme 7 d/yr ≥110°F today · 23 d/yr by 30 yrs out
- Wind 9/10 Extreme 99% chance of damaging wind over 30 yrs
- Air quality 2/10 Low 1 unhealthy d/yr today · 1 by 30 yrs out
Nearby sold comps map
Loading sold comps map…
Walkable amenities ~0.75 mi
Loading nearby amenities…
Taxation est. · year 1
- Rental income
- $27,463
- − Mortgage interest
- −$16,362
- − Property taxes
- −$4,381
- − Insurance
- −$1,460
- − Repairs & maintenance
- −$2,197
- − Management
- −$2,197
- − Depreciation
- −$8,497
- Taxable loss
- −$7,632
- Est. tax savings @ 24.0%
- +$1,832
- After-tax cash flow
- $-696/yr
For passive investors: Depreciation is non-cash, so a rental often shows a tax loss while cash-flowing — sheltering income. Rental losses are passive: they offset passive income freely, and up to $25,000/yr can offset ordinary (W-2) income if you actively participate and your MAGI is under $100k (phasing out to $0 by $150k); unused losses carry forward. On sale, claimed depreciation is recaptured at up to 25%, and gains may owe capital-gains tax (a 1031 exchange can defer both). Figures are a year-1 estimate at your 24.0% rate — not tax advice; consult a CPA.
Condition & rehab AI · 6 photos
The home is in good condition with a good exterior and interior. A fresh coat of paint and a thorough gutter inspection would enhance its curb appeal and value.
Value-add opportunities
- Both Paint the exterior siding — A fresh coat of paint can enhance the curb appeal and increase the home's value.
- Both Inspect and clean the gutters — Clean gutters improve drainage and prevent water damage, which can affect the home's value and safety.
Renovation cost estimate screening
Value-add ROI direction
- Both Paint the exterior siding — A fresh coat of paint can enhance the curb appeal and increase the home's value. ↑
- Both Inspect and clean the gutters — Clean gutters improve drainage and prevent water damage, which can affect the home's value and safety. ↑
ⓘ Cost ranges are severity-bucket heuristics (US national rule-of-thumb). Get contractor quotes + a written scope before underwriting a rehab budget.
Schools (NCES district)
- District
- Royal ISD
- NCES district ID
- 4838190
- Math proficiency
- 23% ▼ -11.00%
- Reading proficiency
- 23% ▼ -6.00%
- Median HH income
- $41,059
- Composite
- 19.55/100
- National rank
- #8760
- State rank
- #744 of 826 in TX
Livability — Katy
- Score
- 76/100
- State rank
- #111
- US rank
- #3613
Category grades
Schools grade is shown separately in the Schools card above.
Census & demographics
- County
- Harris County · 4,702,590 people
- City population
- 413,575
- Metro
- Houston-The Woodlands-Sugar Land, TX
- Population (ZIP)
- 71,484
- Household income
- $118,464
- Rent vs Own
- Severe rent burden
- 913.0
Population outlook (Waller County) Hauer SSP2
- Today (2025)
- 60,772 people
- By 2030
- 67,616 · +11.3%
- By 2040
- 82,283 · +35.4%
- By 2050
- 98,276 · +61.7%
- By 2075
- 142,860 · +135.1%
- By 2100
- 175,596 · +188.9%
Race, ethnicity, and origin ACS 2023
- Neighborhood character
- Highly diverse neighborhood (Simpson 0.73)
- Race & ethnicity
- White 36% Hispanic / Latino 33% Two or more races 16% Black 15% Asian 12%
- Hispanic origin (detail)
- Mexican 20%
- Common ancestry
- Lithuanian 2% Slovak 1% Italian 1%
- Foreign-born
- 21% · Canada, Vietnam, Jamaica
- Languages at home
- 64% English-only · Spanish 22% Vietnamese 5% French/Haitian/Cajun 4%
Political lean MEDSL · Waller
- 2024 margin
- Strong R (+25.0) · D 37.0% · R 62.0% · Other 1.0%
- 2008→2024 swing
- -17.9pp toward R · 2008: -7.2pp · 2024: -25.0pp
- All cycles
- 2024: R+25.0 2020: R+26.7 2016: R+28.6 2012: R+17.6 2008: R+7.2
Not yet ingested
- Civics
- —
Market trends
- HPI YoY
- ▼ -140.65%
- Current HPI
- 233.1683
- Rent YoY
- ▼ -0.80%
- Metro
- Houston-The Woodlands-Sugar Land, TX
- State GDP YoY
- ▲ 3.95%
- F500 in state
- 110
Industry mix (Fortune 500 HQ in TX)
| Industry | F500 HQs | Revenue |
|---|---|---|
| Energy | 16 | $1,198B |
|
||
| Technology | 5 | $198B |
|
||
| Engineering / Construction | 4 | $72B |
|
||
| Energy Services | 3 | $60B |
|
||
| Utilities | 3 | $41B |
|
||
| Healthcare | 2 | $330B |
|
||
Cash-flow waterfall
monthlySold comps — $/sqft
last 12 mo · ≤1 miLoading sold comps…