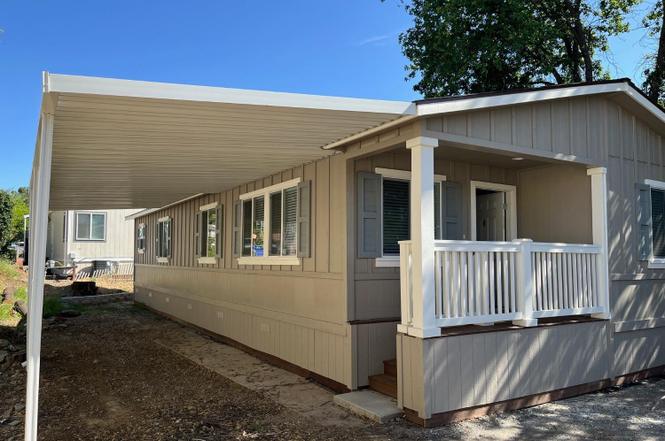
 🏗️ New Construction
83 Sheep Ln · Angels, CA
Flood risk 1/10 · Minimal
- FEMA flood zone
- X (unshaded)
- Chance of flooding over 30 yrs
- 0.0%
- Est. flood insurance / yr
- $507 – $1,088
Fire risk 8/10 · Major
- Est. fire insurance / yr
- $659 – $1,223
Heat risk 6/10 · Moderate
- Hot days now (above 102°F)
- 6 days/yr
- Hot days in 30 yrs
- 13 days/yr
Wind risk 1/10 · Minimal
- Chance of severe wind over 30 yrs
- —
Air-quality risk 10/10 · Severe
- Unhealthy air days now
- 27 days/yr
- Unhealthy air days in 30 yrs
- 31 days/yr
Risk factors via First Street. Map © Google.
Why this score? — see what drove the B grade
The composite is a weighted blend of 9 inputs, each scored 0–100. Each bar is that input's sub-score; the figure is the points it added to the 100-point composite (weight × sub-score).
- Cash flow +30.0/30.0
- 1% rule +10.0/10.0
- DSCR +10.0/10.0
- ARV discount +7.5/15.0
- Schools +4.5/10.0
- Livability +3.5/5.0
- Rent growth +2.5/5.0
- Condition / age +2.5/5.0
- Appreciation +0.0/10.0
$199,000
🖨 Deal sheet (PDF) 📄 Offer letter ✓ Due diligence
Listing remarks
Brand new 1440 square foot home, 3 bedrooms, 2 baths, all new stainless steel appliaces, and never been lived in. Includes refrigerator with ice and water in the door. All age park with elementary and high school nearby: short walking distance. Other nearby services include a large shopping center with a supermarket, restaurants, laundromat, and other needed services. Medical facilities and post office nearby also.
Key facts
- Post office
- Medical facilities
- 4,800 sq ft lot
Tags
Property features AI
Finance
- Other: Located at 83 Sheep Lane, Angels Camp, CA 95222; Not a land-lease property
- HOA & community: No homeowners association
Exterior
- Parking: 4 parking spaces; Attached parking, carport, off-street parking and guest parking available; No traditional garage
- Utilities: Underground utilities; Internet available; Individual gas and electric meters; Gas plumbed to the home; Cable connected; Public sewer; Public water from a water district
- Home design: Manufactured home located in a park; Double-wide model; New construction (built 2023); Clayton make; manufactured by CMH Manufacturing West, Inc.
- Construction: Skirted with wood; Shingle roofing; Built in 2023
- Exterior features: Shingle roof; Regular-shaped lot; Attached deck
Interior
- Kitchen: Dishwasher; Disposal; Free-standing gas range; Free-standing refrigerator; Range hood; Microwave; Ice maker and plumbed ice maker; Pantry cabinet and pantry closet; Laminate countertops
- Bedrooms: 3 bedrooms
- Flooring: Laminate flooring; Carpet
- Bathrooms: 2 full bathrooms; Low-flow showers and toilets; Shower stall, tub, and tub with shower over
- Heating & cooling: Central air conditioning; Central heating and propane supply
- Interior features: Central cooling; Propane and central heating; Energy-efficient features including insulation, thermostat, and appliances; Fireplace (other type); Window screens and dual-pane windows; Deck attached to living room; Kitchen and family room combined layout
- Laundry & utility: Laundry hookups inside a dedicated room; Gas hook-up for laundry; Gas water heater
Neighborhood map
What this means for you Summary
Snapshot
- This is a 3-bed/2.0-bath manufactured listed at $199k.
Deal economics
- At list price, monthly cash flow is $1k ($13k/yr) — positive.
- The deal already cash-flows at list — no discount required.
- Meets the 1% rule at list price ($3k rent vs $199k).
- Recommended offer: $175k (12.0% below list) — sets the bar for market timing.
- Cap rate 14.4% vs local median 4.5% in Angels — top-decile yield for the area; either an underpriced asset or a hidden risk that comps aren't pricing in. Stress-test before assuming the spread holds.
Location & tenants
- Location reads 69/100 on livability (#265 in CA) — a middle-class / working-renter tenant base. Strengths: health & safety A+, crime B+, employment B; Watch: amenities F, commute F, cost of living F.
- Bret Harte Union High (town): math 35% / reading 65% proficiency, ranked #429 of 1,400 in CA (top 31%) — acceptable for families but not a draw, mixed tenant base, ~2y average lease.
- Zoned schools: Mark Twain Elementary (math 24% / reading 75%, grade D+, #387 of 1,571 statewide, top 26%, 514 students, 57% FRL); Bret Harte Union High (587 students, 44% FRL).
- Market conditions: 100 active listings in the ZIP; 77 units permitted in Calaveras County in 2024 (0 in 5+ unit buildings).
Forward outlook
- Local home prices are declining (-3.0%/yr); year-one equity from $1k of loan paydown is wiped out by about $5k of value loss. Plan a longer hold.
- Calaveras County population projected at -18% by 2050 — secular population decline; favor cash flow + early exit over multi-decade hold.
- At projected returns (-3.0% appreciation + 3.0% rent growth), your $43k cash investment doubles in ~5 years — after that, you're playing with house money.
Negotiation context
- It's been on market 138 days — a 12% lower offer ($175k) is reasonable based on typical stale-listing flexibility.
Risks & watch-outs
- Climate carrying-cost: severe wildfire risk; extreme-heat days projected 6→13/yr by 2055 (HVAC capex compounding) — expect insurance premiums to compound above CPI over the hold.
Questions for the listing agent
- It's been on market 138 days. Have you received any prior offers? Is the seller open to a 12% concession, seller financing, or rate buy-down credit?
- Why hasn't it sold? Are there any deal-killer items the seller is aware of (foundation, flood, title, zoning, code violations)?
- Is there a deadline driving the sale (1031 exchange, divorce, estate, relocation)? That informs how much negotiation room exists.
- Schools are B-rated — typically a magnet for longer-tenancy family renters. What's the average tenant stay here, and is there a school-zone premium baked into asking?
- What's the average days-on-market for RENTAL listings here right now (not sales)? A rising rental-DOM trend means longer vacancies and softer asking-rent achievability than the comps imply.
- What's the recent tenant-quality profile in this submarket — average credit score on applications, eviction rate, late-payment / NSF rate, and stable-employment percentage? A property-management company in the area should have these aggregated.
- How much new for-sale + rental construction is in the pipeline within 1–3 miles? Heavy new supply typically softens prices + rents 12–24 months out; constrained supply supports both.
Investment metrics
- 1% rule
- 1.73% ✓
- Cap rate
- 14.41%
- Cash-on-cash
- 29.00%
- DSCR
- 2.29
- GRM
- 4.8
CMA / ARV
- ARV (on-the-fly)
- $154,560
- Comps found
- 3
Show comp detail 3 sales within ~0.75 mi
| Address | Dist | Beds/Ba | Sqft | Sold | Price | $/sf | Match |
|---|---|---|---|---|---|---|---|
| 933 Mark Twain Rd | 0.35mi | 2/2.0 (-1) | 1,425 (+6%) | 5mo | $247,000 | $173 | 64 |
| 314 S Main St #174 | 0.61mi | 3/2.0 | 1,344 (0%) | 15mo | $155,000 | $115 | 59 |
| 124 Big Buck Trl #124 | 0.71mi | 2/2.0 (-1) | 1,440 (+7%) | 13mo | $100,000 | $69 | 39 |
Match score weights: distance 35% · size 25% · config 20% · recency 20%. Top-matched comps best support the ARV.
Projected returns pro-forma
-3.0% appreciation · 3.0% rent growth · sell at horizon
- IRR
- 23.4%
- Equity multiple
- 1.96×
- Total profit
- $41,617
- Equity at exit
- $23,045
- IRR
- 31.3%
- Equity multiple
- 3.82×
- Total profit
- $122,190
- Equity at exit
- $13,364
Cash invested: $43,277 (down + closing). Projections, not guarantees.
Landlord ↔ Tenant lean methodology
- Overall (STATE)
- 18 Strongly Tenant-Friendly
- State California
- 18 Strongly Tenant-Friendly · D+13
- County
- — inherits STATE
- City
- — inherits STATE
ZIP-level market 95222
- Active inventory
- 100
- Price-to-rent
- 6.2×
Monthly cashflow live
- Estimated rent
- $2,676 medium interval (Pro) →
- Mortgage (P&I)
- −$811
- Tax est. 1.5%
- −$193 /mo · $2,318/yr
- Insurance
- −$64
- HOA
- −$0
- Vacancy / Maint / Mgmt
- −$562
- Net cashflow
- $1,046
Break-even live
Sensitivity live
| Price | -10% $1,153 | -5% $1,099 | +0% $1,046 | +5% $993 | +10% $939 |
|---|---|---|---|---|---|
| Rent | -10% $835 | -5% $940 | +0% $1,046 | +5% $1,152 | +10% $1,257 |
| Rate | -1.0pp $1,124 | -0.5pp $1,085 | base $1,046 | +0.5pp $1,006 | +1.0pp $965 |
UW: 25.0% down · 7.5% · 30yr · 1.5% tax · 5.0% vac · 8.0% maint · 8.0% mgmt
Financing live
Cash to close
- Down payment
- $38,640
- Closing costs
- $4,637
- Reserves months
- —
- Total cash needed
- —
Loan-product check · same deal, 3 products live
Conventional
25% down · 7.5% · 30yr
- Down + closing
- —
- Monthly P&I
- —
- Monthly cashflow
- —
- DSCR
- —
- Eligible?
- —
Personal DTI + credit; lowest rate.
DSCR
20% down · 8.5% · 30yr
- Down + closing
- —
- Monthly P&I
- —
- Monthly cashflow
- —
- DSCR
- —
- Eligible?
- —
No personal income docs; deal must DSCR.
Hard money
10% down · 12.0% · 12mo
- Down + closing
- —
- Monthly P&I
- —
- Monthly cashflow
- —
- DSCR
- —
- Eligible?
- —
Short-term bridge; refi at stabilization.
Listing history 16 events
-
2026-06-21days on market $199,000 Active 138 DOM
-
2026-06-18days on market $199,000 Active 135 DOM
-
2026-06-17days on market $199,000 Active 134 DOM
-
2026-06-16days on market $199,000 Active 133 DOM
-
2026-06-15days on market $199,000 Active 132 DOM
-
2026-06-14days on market $199,000 Active 130 DOM
-
2026-06-10days on market $199,000 Active 127 DOM
-
2026-06-09days on market $199,000 Active 126 DOM
-
2026-06-08days on market $199,000 Active 125 DOM
-
2026-06-07days on market $199,000 Active 124 DOM
-
2026-06-05days on market $199,000 Active 121 DOM
-
2026-06-03days on market $199,000 Active 120 DOM
-
2026-06-02days on market $199,000 Active 119 DOM
-
2026-06-01days on market $199,000 Active 118 DOM
-
2026-05-31days on market $199,000 Active 117 DOM
-
2026-05-30days on market $199,000 Active 116 DOM
ⓘ Source: listings_history table (triggers on properties + properties_extension) + one-shot
backfill from property_details.listing_events for pre-trigger history.
Climate risk First Street
- Flood 1/10 Low FEMA zone X (unshaded) · 0% chance over 30 yrs
- Wildfire 8/10 Severe
- Heat 6/10 Major 6 d/yr ≥102°F today · 13 d/yr by 30 yrs out
- Wind 1/10 Low
- Air quality 10/10 Extreme 27 unhealthy d/yr today · 31 by 30 yrs out
Nearby sold comps map
Loading sold comps map…
Walkable amenities ~0.75 mi
Loading nearby amenities…
Taxation est. · year 1
- Rental income
- $32,114
- − Mortgage interest
- −$8,658
- − Property taxes
- −$2,318
- − Insurance
- −$773
- − Repairs & maintenance
- −$2,569
- − Management
- −$2,569
- − Depreciation
- −$4,496
- Taxable income
- $10,730
- Est. tax owed @ 24.0%
- −$2,575
- After-tax cash flow
- $9,977/yr
For passive investors: Depreciation is non-cash, so a rental often shows a tax loss while cash-flowing — sheltering income. Rental losses are passive: they offset passive income freely, and up to $25,000/yr can offset ordinary (W-2) income if you actively participate and your MAGI is under $100k (phasing out to $0 by $150k); unused losses carry forward. On sale, claimed depreciation is recaptured at up to 25%, and gains may owe capital-gains tax (a 1031 exchange can defer both). Figures are a year-1 estimate at your 24.0% rate — not tax advice; consult a CPA.
Schools (NCES district)
- District
- Bret Harte Union High
- NCES district ID
- 0605940
- Math proficiency
- 35% ▲ 5.00%
- Reading proficiency
- 65% ▲ 5.00%
- Median HH income
- $56,974
- Composite
- 45.41/100
- National rank
- #5708
- State rank
- #429 of 1400 in CA
Livability — Angels
- Score
- 69/100
- State rank
- #265
- US rank
- #8772
Category grades
Schools grade is shown separately in the Schools card above.
Census & demographics
- Census place
- Angels, CA
- City population
- 164
- Population (ZIP)
- 5,666
Population outlook (Calaveras County) Hauer SSP2
- Today (2025)
- 43,163 people
- By 2030
- 41,703 · -3.4%
- By 2040
- 38,202 · -11.5%
- By 2050
- 35,385 · -18.0%
- By 2075
- 30,807 · -28.6%
- By 2100
- 25,755 · -40.3%
Race, ethnicity, and origin ACS 2023
- Neighborhood character
- Predominantly White (85%)
- Race & ethnicity
- White 85% Hispanic / Latino 8% Two or more races 7% Native American 2%
- Hispanic origin (detail)
- Mexican 5%
- Common ancestry
- Slovak 4% Russian 3% Serbian 2%
- Foreign-born
- 3% · Canada
- Languages at home
- 91% English-only · Spanish 8% Other Indo-European 1%
Political lean MEDSL · Calaveras
- 2024 margin
- Strong R (+28.1) · D 34.7% · R 62.8% · Other 2.5%
- 2008→2024 swing
- -15.2pp toward R · 2008: -13.0pp · 2024: -28.1pp
- All cycles
- 2024: R+28.1 2020: R+23.8 2016: R+23.9 2012: R+17.0 2008: R+13.0
Not yet ingested
- Civics
- —
Market trends
- HPI YoY
- ▼ -118.93%
- Current HPI
- 137.7432
- Rent YoY
- —
- Metro
- —
- State GDP YoY
- ▲ 3.21%
- F500 in state
- 116
Industry mix (Fortune 500 HQ in CA)
| Industry | F500 HQs | Revenue |
|---|---|---|
| Technology | 27 | $1,492B |
|
||
| Financial Services | 3 | $174B |
|
||
| Retail | 3 | $44B |
|
||
| Insurance | 3 | $26B |
|
||
| Media / Entertainment | 2 | $115B |
|
||
| Pharmaceuticals / Biotech | 2 | $62B |
|
||
Cash-flow waterfall
monthlySold comps — $/sqft
last 12 mo · ≤1 miLoading sold comps…