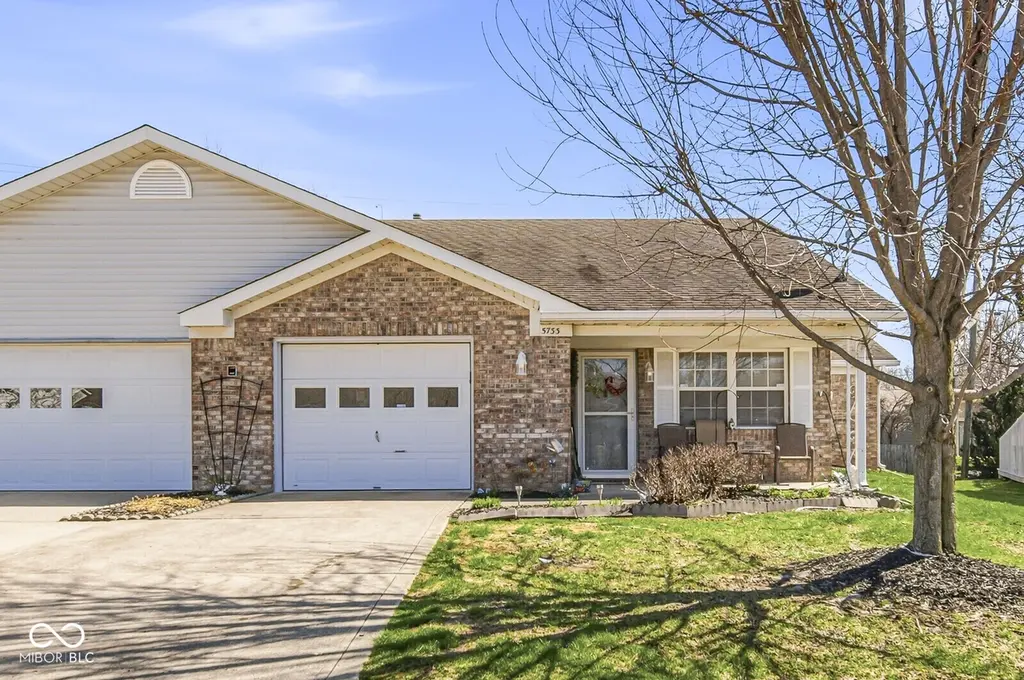
5733 Misty Ridge Cir · Indianapolis city (balance), IN
Flood risk 1/10 · Minimal
- FEMA flood zone
- X (unshaded)
- Chance of flooding over 30 yrs
- 0.0%
- Est. flood insurance / yr
- $507 – $1,088
Fire risk 1/10 · Minimal
- Est. fire insurance / yr
- $717 – $1,331
Heat risk 4/10 · Minor
- Hot days now (above 102°F)
- 7 days/yr
- Hot days in 30 yrs
- 19 days/yr
Wind risk 2/10 · Minimal
- Chance of severe wind over 30 yrs
- 1.0%
Air-quality risk 3/10 · Minor
- Unhealthy air days now
- 2 days/yr
- Unhealthy air days in 30 yrs
- 3 days/yr
Risk factors via First Street. Map © Google.
Why this score? — see what drove the D grade
The composite is a weighted blend of 9 inputs, each scored 0–100. Each bar is that input's sub-score; the figure is the points it added to the 100-point composite (weight × sub-score).
- Cash flow +12.9/30.0
- ARV discount +9.6/15.0
- Schools +4.0/10.0
- DSCR +3.9/10.0
- Rent growth +3.4/5.0
- 1% rule +3.3/10.0
- Livability +2.5/5.0
- Condition / age +2.5/5.0
- Appreciation +0.0/10.0
$204,000
🖨 Deal sheet (PDF) 📄 Offer letter ✓ Due diligence
Listing remarks MLS
Terrific home in a great 55 and over community with easy access to interstate, shopping and downtown. Inviting Great Room, Dining Room, lovely eat in Kitchen with a pass through to the DR, Sunroom/Office opens to a private patio area for your enjoyment or entertaining, 2BR, 2B. Updates include high efficiency HVAC 2015, Refrigerator and Microwave 2014, Range 2010, replaced front and back Storm Doors. Replaced both vanity tops with granite & replaced the faucets.
Key facts
- Ensuite bath
- Granite countertops
- Privacy fenced patio
Tags
Neighborhood map
What this means for you Summary
Snapshot
- This is a 2-bed/1.0-bath single-family listed at $204k.
Deal economics
- At list price, monthly cash flow is $-15 ($-182/yr) — negative.
- To cash-flow at today's rent, offer at most $201k (1.3% below list).
- To meet the 1% rule (rent ≥ 1% of price), the offer needs to be $168k (17.4% below list).
- Recommended offer: $168k (17.4% below list) — sets the bar for 1% rule.
- Cap rate 6.2% vs local median 4.4% in Indianapolis city (balance) — top-decile yield for the area; either an underpriced asset or a hidden risk that comps aren't pricing in. Stress-test before assuming the spread holds.
Location & tenants
- Location reads: area grade D — affects rentability + tenant quality, not the cash-flow math above.
- Franklin Township Community School Corporation (urban): math 42% / reading 47% proficiency, ranked #87 of 301 in IN (top 29%) — families likely to look elsewhere, expect single-tenant / working-renter base with shorter leases.
- Zoned schools: Arlington Elementary School (math 47% / reading 37%, grade F, #434 of 994 statewide, top 48%, 484 students, 75% FRL); Franklin Central High School (math 41% / reading 69%, grade C, #77 of 369 statewide, top 21%, 3,319 students, 46% FRL) — zoned schools average 60% FRL vs 29% district-wide (32 pts higher); higher-poverty schools than district average — tighter screening recommended.
- Market conditions: Rents rising (+3.8%/yr); 270 active listings in the ZIP; 9 comparable units currently listed for rent nearby; rentals leasing fast (median 3d on market — plan ~1-2 weeks tenant-placement turnaround); solid renter incomes; 1,906 units permitted in Marion County in 2024 (621 in 5+ unit buildings).
Forward outlook
- Local home prices are declining (-3.0%/yr); year-one equity from $1k of loan paydown is wiped out by about $6k of value loss. Plan a longer hold.
- Marion County population projected at +18% by 2050 — long-run rental-demand tailwind backs the buy-and-hold thesis.
Negotiation context
- It's been on market 40 days — a 3% lower offer ($198k) is reasonable based on typical stale-listing flexibility.
- 4 sale attempts since 17y ago with the ask held roughly flat each time — persistent listings suggest the price (not the market) is what's stuck; bring a comps-based counter.
- Current owner paid $124k; list at $204k implies a 65% gain — meaningful room to come down on a strong offer.
Questions for the listing agent
- What do current leases actually rent for vs. the listed asking? Can we see a recent rent roll and the last 12 months of T-12 income?
- It's been on market 40 days. Have you received any prior offers? Is the seller open to a 17% concession, seller financing, or rate buy-down credit?
- What does the HOA fee cover, when was the last increase, and are there any pending special assessments or reserve-fund shortfalls?
- Is there a deadline driving the sale (1031 exchange, divorce, estate, relocation)? That informs how much negotiation room exists.
- The area grade is low — what's the realistic commute time and amenity access for the typical tenant pool here? Any planned neighborhood developments (good or bad) we should know about?
- What's the average days-on-market for RENTAL listings here right now (not sales)? A rising rental-DOM trend means longer vacancies and softer asking-rent achievability than the comps imply.
- What's the recent tenant-quality profile in this submarket — average credit score on applications, eviction rate, late-payment / NSF rate, and stable-employment percentage? A property-management company in the area should have these aggregated.
- How much new for-sale + rental construction is in the pipeline within 1–3 miles? Heavy new supply typically softens prices + rents 12–24 months out; constrained supply supports both.
Investment metrics
- 1% rule
- 0.83% ✗
- Cap rate
- 6.20%
- Cash-on-cash
- -0.32%
- DSCR
- 0.99
- GRM
- 10.1
CMA / ARV
- ARV (on-the-fly)
- $213,944
- Comps found
- 12
Show comp detail 12 sales within ~0.75 mi
| Address | Dist | Beds/Ba | Sqft | Sold | Price | $/sf | Match |
|---|---|---|---|---|---|---|---|
| 5733 Misty Ridge Cir | 0.00mi | 2/2.0 | 1,138 (0%) | 1mo | $204,000 | $179 | 95 |
| 5719 S Arlington Ave | 0.43mi | 2/1.0 | 1,073 (-6%) | 2mo | $245,000 | $228 | 69 |
| 5326 Shelbyville Rd | 0.33mi | 3/2.0 (+1) | 1,104 (-3%) | 3mo | $245,000 | $222 | 68 |
| 5223 Bahia Dr | 0.49mi | 3/1.5 (+1) | 1,112 (-2%) | 4mo | $195,000 | $175 | 63 |
| 5147 Antigua Trl | 0.58mi | 3/1.0 (+1) | 1,056 (-7%) | 1mo | $195,000 | $185 | 55 |
| 5304 Wagon Wheel Ct | 0.50mi | 3/1.5 (+1) | 1,216 (+7%) | 8mo | $215,000 | $177 | 52 |
| 5331 Yucatan Dr | 0.53mi | 3/1.5 (+1) | 1,060 (-7%) | 7mo | $195,000 | $184 | 51 |
| 5207 Palisade Way | 0.64mi | 3/1.5 (+1) | 1,064 (-6%) | 3mo | $210,000 | $197 | 50 |
| 5218 Palisade Way | 0.63mi | 3/1.5 (+1) | 1,064 (-6%) | 6mo | $202,000 | $190 | 47 |
| 5512 Lunsford Dr | 0.47mi | 3/1.5 (+1) | 1,290 (+13%) | 7mo | $225,000 | $174 | 43 |
| 5135 Brouse Ct | 0.66mi | 3/2.0 (+1) | 1,243 (+9%) | 2mo | $252,450 | $203 | 43 |
| 5548 Glen Canyon Dr | 0.70mi | 3/2.0 (+1) | 1,245 (+9%) | 5mo | $234,000 | $188 | 38 |
Match score weights: distance 35% · size 25% · config 20% · recency 20%. Top-matched comps best support the ARV.
Projected returns pro-forma
-3.0% appreciation · 3.78% rent growth · sell at horizon
- IRR
- -16.0%
- Equity multiple
- 0.43×
- Total profit
- $-32,707
- Equity at exit
- $30,417
- IRR
- -6.4%
- Equity multiple
- 0.58×
- Total profit
- $-24,230
- Equity at exit
- $17,638
Cash invested: $57,120 (down + closing). Projections, not guarantees.
Landlord ↔ Tenant lean methodology
- Overall (STATE)
- 90 Strongly Landlord-Friendly
- State Indiana
- 90 Strongly Landlord-Friendly · R+11
- County
- — inherits STATE
- City
- — inherits STATE
ZIP-level market 46237
- Rents YoY
- 3.8%
- Active inventory
- 270
- Price-to-rent
- 10.1×
Monthly cashflow live
- Estimated rent
- $1,684 high interval (Pro) →
- Mortgage (P&I)
- −$1,070
- Tax from tax record
- −$91 /mo · $1,092/yr
- Insurance
- −$85
- HOA
- −$100
- Vacancy / Maint / Mgmt
- −$354
- Net cashflow
- $-15
Break-even live
Sensitivity live
| Price | -10% $100 | -5% $43 | +0% $-15 | +5% $-73 | +10% $-131 |
|---|---|---|---|---|---|
| Rent | -10% $-148 | -5% $-82 | +0% $-15 | +5% $51 | +10% $118 |
| Rate | -1.0pp $88 | -0.5pp $37 | base $-15 | +0.5pp $-68 | +1.0pp $-122 |
UW: 25.0% down · 7.5% · 30yr · 1.5% tax · 5.0% vac · 8.0% maint · 8.0% mgmt
Financing live
Cash to close
- Down payment
- $51,000
- Closing costs
- $6,120
- Reserves months
- —
- Total cash needed
- —
Loan-product check · same deal, 3 products live
Conventional
25% down · 7.5% · 30yr
- Down + closing
- —
- Monthly P&I
- —
- Monthly cashflow
- —
- DSCR
- —
- Eligible?
- —
Personal DTI + credit; lowest rate.
DSCR
20% down · 8.5% · 30yr
- Down + closing
- —
- Monthly P&I
- —
- Monthly cashflow
- —
- DSCR
- —
- Eligible?
- —
No personal income docs; deal must DSCR.
Hard money
10% down · 12.0% · 12mo
- Down + closing
- —
- Monthly P&I
- —
- Monthly cashflow
- —
- DSCR
- —
- Eligible?
- —
Short-term bridge; refi at stabilization.
Rent comps 9 comps
| Address | Beds | Baths | Sqft | Rent | $/sqft | DOM | Units | Dist |
|---|---|---|---|---|---|---|---|---|
| 5844 Timber Lake Blvd Indianapolis, IN | 3.0 | 2.0 | 1250 | $1,756 | $1.40 | 0d | 1 | 0.54mi |
| 5717 Hacienda Ct Indianapolis, IN | 3.0 | 1.5 | 1322 | $1,631 | $1.23 | 17d | 1 | 0.66mi |
| 5140 Emerson Village Pl Indianapolis, IN | 1.0–2.0 | 1.0–2.0 | 805 | $1,360 | $1.69 | 0d | 14 | 0.66mi |
| 5334 Padre Ln Indianapolis, IN | 3.0 | 1.5 | 1016 | $1,695 | $1.67 | 16d | 1 | 0.67mi |
| 5723 Ensenada Ave Indianapolis, IN | 3.0 | 2.0 | 1168 | $1,775 | $1.52 | 3d | 1 | 0.71mi |
| 5500 S Emerson Ave Indianapolis, IN | 2.0–3.0 | 2.5 | 1492 | $1,899 | $1.27 | 0d | 2 | 0.77mi |
| 5309 Waterton Lakes Dr Indianapolis, IN | 3.0 | 2.0 | 1390 | $1,865 | $1.34 | 9d | 1 | 0.83mi |
| 4901 S Emerson Ave Indianapolis, IN | 1.0–4.0 | 1.0–2.0 | 998 | $1,417 | $1.42 | 0d | 10 | 1.00mi |
| 7251 Windsor Lakes Dr Indianapolis, IN | 1.0–3.0 | 1.0–2.0 | 1103 | $1,540 | $1.40 | 3d | 36 | 1.32mi |
HOA detail
- Monthly dues
- $100 · $1,200/yr
Listing history 13 events
-
2026-04-23status Pending
-
2026-04-11price $204,000
-
2026-03-30price $204,900
-
2026-03-13$209,900 Active
-
2018-02-15soldstatus $123,500 Sold 471-char remark
Show marketing remark (471 chars)
Terrific home in a great 55 and over community with easy access to interstate, shopping and downtown. Inviting Great Room, Dining Room, lovely eat in Kitchen with a pass through to the DR, Sunroom/Office opens to a private patio area for your enjoyment or entertaining, 2BR, 2B. Updates include high efficiency HVAC 2015, Refrigerator and Microwave 2014, Range 2010, replaced front and back Storm Doors. Replaced both vanity tops with granite & replaced the faucets.
-
2017-12-28status Pending 471-char remark
Show marketing remark (471 chars)
Terrific home in a great 55 and over community with easy access to interstate, shopping and downtown. Inviting Great Room, Dining Room, lovely eat in Kitchen with a pass through to the DR, Sunroom/Office opens to a private patio area for your enjoyment or entertaining, 2BR, 2B. Updates include high efficiency HVAC 2015, Refrigerator and Microwave 2014, Range 2010, replaced front and back Storm Doors. Replaced both vanity tops with granite & replaced the faucets.
-
2017-12-10historical Active with Contingency 471-char remark
Show marketing remark (471 chars)
Terrific home in a great 55 and over community with easy access to interstate, shopping and downtown. Inviting Great Room, Dining Room, lovely eat in Kitchen with a pass through to the DR, Sunroom/Office opens to a private patio area for your enjoyment or entertaining, 2BR, 2B. Updates include high efficiency HVAC 2015, Refrigerator and Microwave 2014, Range 2010, replaced front and back Storm Doors. Replaced both vanity tops with granite & replaced the faucets.
-
2017-11-15$127,500 Active 471-char remark
Show marketing remark (471 chars)
Terrific home in a great 55 and over community with easy access to interstate, shopping and downtown. Inviting Great Room, Dining Room, lovely eat in Kitchen with a pass through to the DR, Sunroom/Office opens to a private patio area for your enjoyment or entertaining, 2BR, 2B. Updates include high efficiency HVAC 2015, Refrigerator and Microwave 2014, Range 2010, replaced front and back Storm Doors. Replaced both vanity tops with granite & replaced the faucets.
-
2010-01-04historical 394-char remark
Show marketing remark (394 chars)
Motivated Seller!! A rare find in this 55+ community as many of these homes don't come up for sale to often. This one has all the perks and pluses you could want: sun room, fence patio, finished garage, two full baths, modern kitchen. It is well kept and in a prestine location. Misty Ridge offers the best in relaxing living. It features a beautiful pond in the common area with a Gazebo.
-
2009-12-31soldstatus $81,000 394-char remark
Show marketing remark (394 chars)
Motivated Seller!! A rare find in this 55+ community as many of these homes don't come up for sale to often. This one has all the perks and pluses you could want: sun room, fence patio, finished garage, two full baths, modern kitchen. It is well kept and in a prestine location. Misty Ridge offers the best in relaxing living. It features a beautiful pond in the common area with a Gazebo.
-
2009-09-22historical
-
2009-09-21$86,000 394-char remark
Show marketing remark (394 chars)
Motivated Seller!! A rare find in this 55+ community as many of these homes don't come up for sale to often. This one has all the perks and pluses you could want: sun room, fence patio, finished garage, two full baths, modern kitchen. It is well kept and in a prestine location. Misty Ridge offers the best in relaxing living. It features a beautiful pond in the common area with a Gazebo.
-
2009-03-23$90,000
ⓘ Source: listings_history table (triggers on properties + properties_extension) + one-shot
backfill from property_details.listing_events for pre-trigger history.
Tax reassessment forecast IN · Partial reset (capped growth)
- Current annual tax
- $1,092 · $91/mo
- Projected year-2 tax
- $1,413 · $118/mo
- Expected delta
- +$321/yr (+$27/mo · 29.4%)
ⓘ Screening estimate from a state-policy table — verify with the county assessor before closing.
Climate risk First Street
- Flood 1/10 Low FEMA zone X (unshaded) · 0% chance over 30 yrs
- Wildfire 1/10 Low
- Heat 4/10 Moderate 7 d/yr ≥102°F today · 19 d/yr by 30 yrs out
- Wind 2/10 Low 100% chance of damaging wind over 30 yrs
- Air quality 3/10 Moderate 2 unhealthy d/yr today · 3 by 30 yrs out
Nearby sold comps map
Loading sold comps map…
Walkable amenities ~0.75 mi
Loading nearby amenities…
Taxation est. · year 1
- Rental income
- $20,211
- − Mortgage interest
- −$11,427
- − Property taxes
- −$1,092
- − Insurance
- −$1,020
- − Repairs & maintenance
- −$1,617
- − Management
- −$1,617
- − HOA
- −$1,200
- − Depreciation
- −$5,935
- Taxable loss
- −$3,696
- Est. tax savings @ 24.0%
- +$887
- After-tax cash flow
- $705/yr
For passive investors: Depreciation is non-cash, so a rental often shows a tax loss while cash-flowing — sheltering income. Rental losses are passive: they offset passive income freely, and up to $25,000/yr can offset ordinary (W-2) income if you actively participate and your MAGI is under $100k (phasing out to $0 by $150k); unused losses carry forward. On sale, claimed depreciation is recaptured at up to 25%, and gains may owe capital-gains tax (a 1031 exchange can defer both). Figures are a year-1 estimate at your 24.0% rate — not tax advice; consult a CPA.
Schools (NCES district)
- District
- Franklin Township Community School Corporation
- NCES district ID
- 1803750
- Math proficiency
- 42% ▼ -12.00%
- Reading proficiency
- 47% ▼ -6.00%
- Median HH income
- $67,825
- Composite
- 39.91/100
- National rank
- #3852
- State rank
- #87 of 301 in IN
Livability — Indianapolis city (balance)
No livability data for this city. (Only ~50 U.S. cities are tracked.)
Census & demographics
- Census place
- Indianapolis city (balance), IN
- County
- Marion County · 998,460 people
- City population
- 881,119
- Metro
- Indianapolis-Carmel-Anderson, IN
- Population (ZIP)
- 43,473
- Household income
- $79,078
- Rent vs Own
- Severe rent burden
- 1245.0
Population outlook (Marion County) Hauer SSP2
- Today (2025)
- 1,025,572 people
- By 2030
- 1,065,727 · +3.9%
- By 2040
- 1,141,577 · +11.3%
- By 2050
- 1,208,920 · +17.9%
- By 2075
- 1,367,288 · +33.3%
- By 2100
- 1,438,201 · +40.2%
Race, ethnicity, and origin ACS 2023
- Neighborhood character
- Predominantly White (71%)
- Race & ethnicity
- White 71% Asian 13% Hispanic / Latino 7% Two or more races 6% Black 5%
- Hispanic origin (detail)
- Mexican 6%
- Common ancestry
- Italian 2% Lithuanian 2% Romanian 2%
- Foreign-born
- 12% · Canada, Philippines
- Languages at home
- 84% English-only · Other Asian/Pacific 5% Spanish 5% Other Indo-European 4%
Political lean MEDSL · Marion
- 2024 margin
- Strong D (+27.7) · D 63.0% · R 35.3% · Other 1.7%
- 2008→2024 swing
- -0.7pp no change · 2008: 28.4pp · 2024: 27.7pp
- All cycles
- 2024: D+27.7 2020: D+29.1 2016: D+22.8 2012: D+22.2 2008: D+28.4
Not yet ingested
- Civics
- —
Market trends
- HPI YoY
- ▼ -180.33%
- Current HPI
- 238.9661
- Rent YoY
- ▲ 3.78%
- Metro
- Indianapolis-Carmel-Anderson, IN
- State GDP YoY
- ▲ 2.90%
- F500 in state
- 18
Industry mix (Fortune 500 HQ in IN)
| Industry | F500 HQs | Revenue |
|---|---|---|
| Industrial Machinery | 2 | $37B |
|
||
| Healthcare | 1 | $177B |
|
||
| Pharmaceuticals | 1 | $45B |
|
||
| Metals / Steel | 1 | $18B |
|
||
| Agriculture | 1 | $17B |
|
||
| Packaging | 1 | $12B |
|
||
Price history
+126.7% since first listed13 events — show timeline
- 2026-04-23 Pending — MIBOR as Distributed by MLS Grid
- 2026-04-11 Price Changed $204,000 MIBOR as Distributed by MLS Grid
- 2026-03-30 Price Changed $204,900 MIBOR as Distributed by MLS Grid
- 2026-03-13 Listed $209,900 MIBOR as Distributed by MLS Grid
- 2018-02-15 Sold (MLS) $123,500 MIBOR as Distributed by MLS Grid
- 2017-12-28 Pending — MIBOR as Distributed by MLS Grid
- 2017-12-10 Contingent — MIBOR as Distributed by MLS Grid
- 2017-11-15 Listed $127,500 MIBOR as Distributed by MLS Grid
- 2010-01-04 Listing Removed — MIBOR as Distributed by MLS Grid
- 2009-12-31 Sold (MLS) $81,000 MIBOR as Distributed by MLS Grid
- 2009-09-22 Listing Removed — MIBOR as Distributed by MLS Grid
- 2009-09-21 Listed $86,000 MIBOR as Distributed by MLS Grid
- 2009-03-23 Listed $90,000 MIBOR as Distributed by MLS Grid
Property tax history
+9.8%/yrLatest (2025): $1,092 · +2.0% YoY. Source: county tax records.
Cash-flow waterfall
monthlySold comps — $/sqft
last 12 mo · ≤1 miLoading sold comps…