 Triplex
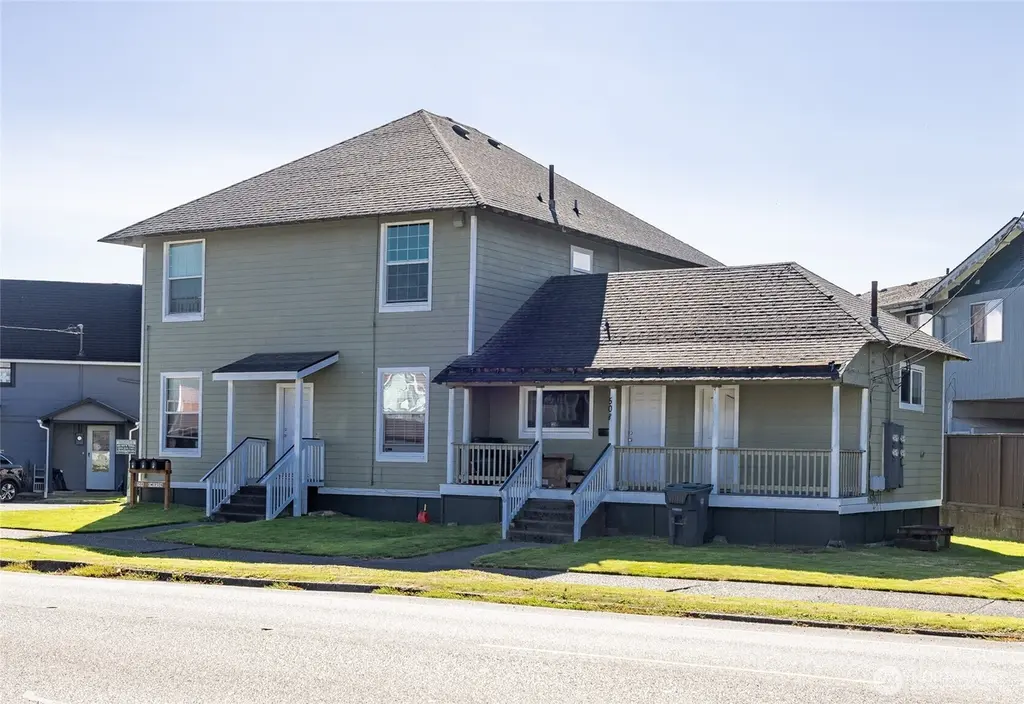
508 Emerson Ave · Hoquiam, WA
Flood risk 6/10 · Moderate
- FEMA flood zone
- AE
- Chance of flooding over 30 yrs
- 0.72%
- Est. flood insurance / yr
- $1,737 – $8,500
Fire risk 1/10 · Minimal
- Est. fire insurance / yr
- $604 – $1,122
Heat risk 1/10 · Minimal
- Hot days now (above 77°F)
- 8 days/yr
- Hot days in 30 yrs
- 19 days/yr
Wind risk 1/10 · Minimal
- Chance of severe wind over 30 yrs
- —
Air-quality risk 6/10 · Moderate
- Unhealthy air days now
- 6 days/yr
- Unhealthy air days in 30 yrs
- 6 days/yr
Risk factors via First Street. Map © Google.
Why this score? — see what drove the B- grade
The composite is a weighted blend of 9 inputs, each scored 0–100. Each bar is that input's sub-score; the figure is the points it added to the 100-point composite (weight × sub-score).
- Cash flow +30.0/30.0
- DSCR +10.0/10.0
- ARV discount +9.5/15.0
- 1% rule +8.2/10.0
- Livability +3.8/5.0
- Schools +3.2/10.0
- Rent growth +2.5/5.0
- Condition / age +2.5/5.0
- Appreciation +0.0/10.0
$385,000
🖨 Deal sheet 📄 Offer letter ✓ Due diligence
Multi-family units
County records classify this as Multi-Family (2-4 Unit). Listing-text estimate: 3 units. confirmed
Listing remarks
Remodeled Tri-plex on Emerson Ave in Hoquiam. Two of the units have 2 bedrooms and 1 bath. The third unit has 3 bedrooms and 1 bath. Many improvements: New siding & paint 2020-2022. New skirting 2019. New porch coverings 2020. Updated vinyl double pane windows. Most of the plumbing & wiring upgraded between 2015 - 2017. New bathroom tub/shower & paint unit #1. Fresh paint, flooring & new stove unit #3. New refrigerator unit #2. Insulated. Hardwired smoke alarms. Co-op laundry. A yard area in back for playground. Partially fenced. Only short vacancy in 1 unit, seller did upgrades during that time. 1 parking spot with street parking as well.
Key facts
- Plumbing upgraded
- New siding
- New paint
Tags
Neighborhood map
What this means for you Summary
Snapshot
- This is a 3 × 2-bed/?-bath units multifamily listed at $385k.
Deal economics
- At list price, monthly cash flow is $1k ($14k/yr) — positive. Per door: $400/mo.
- The deal already cash-flows at list — no discount required.
- Meets the 1% rule at list price ($5k rent vs $385k).
- Recommended offer: $350k (9.0% below list) — sets the bar for market timing.
- Cap rate 11.4% vs local median 3.8% in Hoquiam — top-decile yield for the area; either an underpriced asset or a hidden risk that comps aren't pricing in. Stress-test before assuming the spread holds.
Location & tenants
- Location reads 75/100 on livability (#171 in WA, #4,268 nationally) — a middle-class / working-renter tenant base. Strengths: commute A+, cost of living A+, housing A+; Watch: health & safety C-, employment D, schools D-.
- Hoquiam School District (town): math 30% / reading 41% proficiency, ranked #250 of 291 in WA (top 86%) — families likely to look elsewhere, expect single-tenant / working-renter base with shorter leases.
- Market conditions: 154 active listings in the ZIP; 297 units permitted in Grays Harbor County in 2024 (17 in 5+ unit buildings).
- At $5,093/mo this rent would consume 111% of the median local household income ($55k/yr) (locally 438% of renters already pay >50% of income on rent) — very limited rent-growth headroom before tenants either downsize or default.
Forward outlook
- Local home prices are declining (-3.0%/yr); year-one equity from $3k of loan paydown is wiped out by about $12k of value loss. Plan a longer hold.
- Grays Harbor County population projected at -24% by 2050 — secular population decline; favor cash flow + early exit over multi-decade hold.
- At projected returns (-3.0% appreciation + 3.0% rent growth), your $108k cash investment doubles in ~9 years — after that, you're playing with house money.
Negotiation context
- It's been on market 115 days — a 9% lower offer ($350k) is reasonable based on typical stale-listing flexibility.
- 3 sale attempts since 9y ago with the ask held roughly flat each time — persistent listings suggest the price (not the market) is what's stuck; bring a comps-based counter.
- Current owner paid $120k; list at $385k implies a 221% gain — meaningful room to come down on a strong offer.
Risks & watch-outs
- Watch-outs: flood insurance adds $427/mo; built in 1896 — expect roof / HVAC / electrical / plumbing capex.
- Climate carrying-cost: in FEMA flood zone AE (mandatory federal flood insurance) — expect insurance premiums to compound above CPI over the hold.
Questions for the listing agent
- It's been on market 115 days. Have you received any prior offers? Is the seller open to a 9% concession, seller financing, or rate buy-down credit?
- Can we see the unit-by-unit rent roll, current vacancy, and any below-market leases? What's the average tenancy length?
- What capital expenditures (roof, boiler, parking lot, exteriors) have been made in the last 5 years, and what's planned in the next 2?
- Built in 1896 — when were the roof, HVAC, electrical panel, plumbing, and water heater last replaced?
- What's the actual annual flood-insurance premium (NFIP or private), and is the property in a SFHA with mandatory coverage?
- Why hasn't it sold? Are there any deal-killer items the seller is aware of (foundation, flood, title, zoning, code violations)?
- Is there a deadline driving the sale (1031 exchange, divorce, estate, relocation)? That informs how much negotiation room exists.
- Schools are D-rated, which usually means shorter tenancies and higher turnover. Who's the typical renter profile here, and what's been the actual vacancy rate?
- What's the average days-on-market for RENTAL listings here right now (not sales)? A rising rental-DOM trend means longer vacancies and softer asking-rent achievability than the comps imply.
- What's the recent tenant-quality profile in this submarket — average credit score on applications, eviction rate, late-payment / NSF rate, and stable-employment percentage? A property-management company in the area should have these aggregated.
- How much new apartment / multifamily construction is in the pipeline within 1–3 miles? Heavy new supply (>2% of stock underway) typically softens rents 12–24 months out; light construction supports rent growth.
Investment metrics
- 1% rule
- 1.32% ✓
- Cap rate
- 11.37%
- Cash-on-cash
- 18.11%
- DSCR
- 1.81
- GRM
- 6.3
CMA / ARV
- ARV (median comp)
- $402,944
- List price
- $385,000
- Delta
- -4.45%
- Verdict
- FAIR
- Comps
- 5 within 1.0 mi
Projected returns pro-forma
-3.0% appreciation · 3.0% rent growth · sell at horizon
- IRR
- 3.4%
- Equity multiple
- 1.13×
- Total profit
- $14,269
- Equity at exit
- $57,405
- IRR
- 13.0%
- Equity multiple
- 2.04×
- Total profit
- $111,620
- Equity at exit
- $33,288
Cash invested: $107,800 (down + closing). Projections, not guarantees.
Landlord ↔ Tenant lean methodology
- Overall (STATE)
- 28 Tenant-Leaning
- State Washington
- 28 Tenant-Leaning · D+8
- County
- — inherits STATE
- City
- — inherits STATE
ZIP-level market 98550
- Active inventory
- 154
- Price-to-rent
- 18.9×
Monthly cashflow live
- Estimated rent
- $5,093 medium interval (Pro) →
- Mortgage (P&I)
- −$2,019
- Tax from tax record
- −$217 /mo · $2,601/yr
- Insurance
- −$160
- Flood insurance flood zone
- −$427 /mo · $5,118/yr
- HOA
- −$0
- Vacancy / Maint / Mgmt
- −$1,070
- Net cashflow
- $1,201
Break-even live
3-unit breakdown (identical units grouped — click to expand)
| Units | Beds | Baths | Est. rent |
|---|---|---|---|
| 3× units | 2 | — | $5,094 |
| #1 | 2 | — | $1,698 |
| #2 | 2 | — | $1,698 |
| #3 | 2 | — | $1,698 |
| Total (3 units) | $5,093 | ||
UW: 25.0% down · 7.5% · 30yr · 1.5% tax · 5.0% vac · 8.0% maint · 8.0% mgmt
Financing live
Cash to close
- Down payment
- $96,250
- Closing costs
- $11,550
- Reserves months
- —
- Total cash needed
- —
Loan-product check · same deal, 3 products live
Conventional
25% down · 7.5% · 30yr
- Down + closing
- —
- Monthly P&I
- —
- Monthly cashflow
- —
- DSCR
- —
- Eligible?
- —
Personal DTI + credit; lowest rate.
DSCR
20% down · 8.5% · 30yr
- Down + closing
- —
- Monthly P&I
- —
- Monthly cashflow
- —
- DSCR
- —
- Eligible?
- —
No personal income docs; deal must DSCR.
Hard money
10% down · 12.0% · 12mo
- Down + closing
- —
- Monthly P&I
- —
- Monthly cashflow
- —
- DSCR
- —
- Eligible?
- —
Short-term bridge; refi at stabilization.
Listing history 29 events
-
2026-06-19days on market $385,000 Active 115 DOM
-
2026-06-18days on market $385,000 Active 114 DOM
-
2026-06-17days on market $385,000 Active 113 DOM
-
2026-06-16days on market $385,000 Active 112 DOM
-
2026-06-15days on market $385,000 Active 111 DOM
-
2026-06-14days on market $385,000 Active 109 DOM
-
2026-06-12days on market $385,000 Active 108 DOM
-
2026-06-09days on market $385,000 Active 105 DOM
-
2026-06-08days on market $385,000 Active 104 DOM
-
2026-06-07days on market $385,000 Active 103 DOM
-
2026-06-05days on market $385,000 Active 100 DOM
-
2026-06-03days on market $385,000 Active 99 DOM
-
2026-06-02days on market $385,000 Active 98 DOM
-
2026-06-01days on market $385,000 Active 97 DOM
-
2026-05-31days on market $385,000 Active 96 DOM
-
2026-05-30days on market $385,000 Active 95 DOM
-
2026-04-30price $385,000
-
2026-03-31price $395,000
-
2026-03-30status Active
-
2026-03-26status Pending
-
2026-02-19$405,000 Active
-
2017-06-23soldstatus $120,000 Sold
-
2017-06-23soldstatus $120,000
-
2017-06-15status Pending
-
2017-06-12status Pending Inspection
-
2017-06-12status Pending
-
2017-05-22status Pending Inspection
-
2017-04-19$129,000 Active
-
2012-10-31soldstatus $12,000
ⓘ Source: listings_history table (triggers on properties + properties_extension) + one-shot
backfill from property_details.listing_events for pre-trigger history.
Tax reassessment forecast WA · Resets to sale price
- Current annual tax
- $2,601 · $217/mo
- Projected year-2 tax
- $3,773 · $314/mo
- Expected delta
- +$1,172/yr (+$98/mo · 45.1%)
ⓘ Screening estimate from a state-policy table — verify with the county assessor before closing.
Climate risk First Street
- Flood 6/10 Major FEMA zone AE · 72% chance over 30 yrs
- Wildfire 1/10 Low
- Heat 1/10 Low 8 d/yr ≥77°F today · 19 d/yr by 30 yrs out
- Wind 1/10 Low
- Air quality 6/10 Major 6 unhealthy d/yr today · 6 by 30 yrs out
Nearby sold comps map
Loading sold comps map…
Walkable amenities ~0.75 mi
Loading nearby amenities…
Taxation est. · year 1
- Rental income
- $61,116
- − Mortgage interest
- −$21,566
- − Property taxes
- −$2,601
- − Insurance
- −$7,044
- − Repairs & maintenance
- −$4,889
- − Management
- −$4,889
- − Depreciation
- −$11,200
- Taxable income
- $8,927
- Est. tax owed @ 24.0%
- −$2,142
- After-tax cash flow
- $12,267/yr
For passive investors: Depreciation is non-cash, so a rental often shows a tax loss while cash-flowing — sheltering income. Rental losses are passive: they offset passive income freely, and up to $25,000/yr can offset ordinary (W-2) income if you actively participate and your MAGI is under $100k (phasing out to $0 by $150k); unused losses carry forward. On sale, claimed depreciation is recaptured at up to 25%, and gains may owe capital-gains tax (a 1031 exchange can defer both). Figures are a year-1 estimate at your 24.0% rate — not tax advice; consult a CPA.
Schools (NCES district)
- District
- Hoquiam School District
- NCES district ID
- 5303660
- Math proficiency
- 30% ▬ 0.00%
- Reading proficiency
- 41% ▲ 1.00%
- Median HH income
- $39,039
- Composite
- 32.31/100
- National rank
- #10914
- State rank
- #250 of 291 in WA
Livability — Hoquiam
- Score
- 75/100
- State rank
- #171
- US rank
- #4268
Category grades
Schools grade is shown separately in the Schools card above.
Census & demographics
- Census place
- Hoquiam, WA
- County
- Grays Harbor County · 44,693 people
- City population
- 12,316
- Metro
- Aberdeen, WA
- Population (ZIP)
- 12,316
- Household income
- $55,040
- Rent vs Own
- Severe rent burden
- 438.0
Population outlook (Grays Harbor County) Hauer SSP2
- Today (2025)
- 66,443 people
- By 2030
- 63,255 · -4.8%
- By 2040
- 56,466 · -15.0%
- By 2050
- 50,516 · -24.0%
- By 2075
- 39,296 · -40.9%
- By 2100
- 31,142 · -53.1%
Race, ethnicity, and origin ACS 2023
- Neighborhood character
- Predominantly White (82%)
- Race & ethnicity
- White 82% Hispanic / Latino 6% Two or more races 6% Native American 4% Asian 2% Black 1%
- Hispanic origin (detail)
- Mexican 5%
- Common ancestry
- Portuguese 6% Romanian 4% Slovak 3%
- Foreign-born
- 4% · Canada, China
- Languages at home
- 94% English-only · Spanish 4% Chinese 1% Russian/Polish/Slavic 1%
Political lean MEDSL · Grays Harbor
- 2024 margin
- Lean R (+6.0) · D 45.6% · R 51.6% · Other 2.8%
- 2008→2024 swing
- -20.6pp toward R · 2008: 14.6pp · 2024: -6.0pp
- All cycles
- 2024: R+6.0 2020: R+6.6 2016: R+7.1 2012: D+14.0 2008: D+14.6
Not yet ingested
- Civics
- —
Market trends
- HPI YoY
- ▼ -136.94%
- Current HPI
- 249.3102
- Rent YoY
- —
- Metro
- Aberdeen, WA
- State GDP YoY
- ▲ 4.65%
- F500 in state
- 22
Industry mix (Fortune 500 HQ in WA)
| Industry | F500 HQs | Revenue |
|---|---|---|
| Retail | 2 | $269B |
|
||
| Technology / Retail | 1 | $638B |
|
||
| Technology | 1 | $245B |
|
||
| Telecommunications | 1 | $38B |
|
||
| Food / Beverage | 1 | $36B |
|
||
| Automotive / Trucks | 1 | $34B |
|
||
Price history
+3108.3% since first listed13 events — show timeline
- 2026-04-30 Price Changed $385,000 NWMLS as Distributed by MLS Grid
- 2026-03-31 Price Changed $395,000 NWMLS as Distributed by MLS Grid
- 2026-03-30 Relisted — NWMLS as Distributed by MLS Grid
- 2026-03-26 Pending — NWMLS as Distributed by MLS Grid
- 2026-02-19 Listed $405,000 NWMLS as Distributed by MLS Grid
- 2017-06-23 Sold (Public Records) $120,000 Public Records
- 2017-06-23 Sold (MLS) $120,000 NWMLS as Distributed by MLS Grid
- 2017-06-15 Pending — NWMLS as Distributed by MLS Grid
- 2017-06-12 Pending — NWMLS as Distributed by MLS Grid
- 2017-06-12 Pending — NWMLS as Distributed by MLS Grid
- 2017-05-22 Pending — NWMLS as Distributed by MLS Grid
- 2017-04-19 Listed $129,000 NWMLS as Distributed by MLS Grid
- 2012-10-31 Sold (Public Records) $12,000 Public Records
Property tax history
+10.3%/yrLatest (2026): $2,601 · +7.9% YoY. Source: county tax records.
Cash-flow waterfall
monthlySold comps — $/sqft
last 12 mo · ≤1 miLoading sold comps…