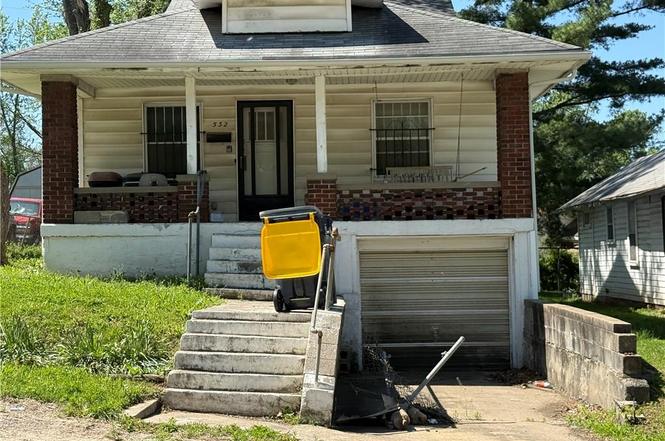
532 Blue Ridge Blvd · Kansas City, MO
Flood risk 1/10 · Minimal
- FEMA flood zone
- X (unshaded)
- Chance of flooding over 30 yrs
- 0.0%
- Est. flood insurance / yr
- $473 – $860
Fire risk 2/10 · Minimal
- Est. fire insurance / yr
- $1,054 – $1,958
Heat risk 4/10 · Minor
- Hot days now (above 106°F)
- 7 days/yr
- Hot days in 30 yrs
- 16 days/yr
Wind risk 2/10 · Minimal
- Chance of severe wind over 30 yrs
- —
Air-quality risk 3/10 · Minor
- Unhealthy air days now
- 2 days/yr
- Unhealthy air days in 30 yrs
- 3 days/yr
Risk factors via First Street. Map © Google.
Why this score? — see what drove the A- grade
The composite is a weighted blend of 9 inputs, each scored 0–100. Each bar is that input's sub-score; the figure is the points it added to the 100-point composite (weight × sub-score).
- Cash flow +30.0/30.0
- ARV discount +15.0/15.0
- DSCR +10.0/10.0
- Appreciation +10.0/10.0
- 1% rule +9.0/10.0
- Livability +3.9/5.0
- Rent growth +2.5/5.0
- Condition / age +2.5/5.0
- Schools +1.5/10.0
$80,000
🖨 Deal sheet (PDF) 📄 Offer letter ✓ Due diligence
Listing remarks
A house with character and potential. Bring you ideas and this is your fixer-upper! Home is sold as-is, in it's present condition.
Key facts
- 4,711 sq ft lot
- Garage
- Built 1918
Property features AI
Exterior
- Parking: 1-car garage with front-facing garage door; Basement access to garage
- Utilities: City/public water (verify); Public sewer
- Home design: Single-family residence; Bungalow style, 1.5 stories; Residential property
- Construction: Wood siding; Composition roof; Approximately 101+ years old
- Exterior features: Paved road frontage; Lot roughly 40 x 119; Not in a flood plain; Public road maintenance
Interior
- Kitchen: Kitchen on main level
- Bedrooms: 2 bedrooms (one bedroom on the second level)
- Bathrooms: 1 full bathroom
- Heating & cooling: Natural gas heating; Electric cooling
- Interior features: Eat-in kitchen; Full unfinished basement with garage entrance
- Laundry & utility: Basement utility access
Neighborhood map
What this means for you Summary
Snapshot
- This is a 2-bed/1.0-bath single-family listed at $80k.
Deal economics
- At list price, monthly cash flow is $381 ($5k/yr) — positive.
- The deal already cash-flows at list — no discount required.
- Meets the 1% rule at list price ($1k rent vs $80k).
- Cap rate 12.0% vs local median 3.9% in Kansas City — top-decile yield for the area; either an underpriced asset or a hidden risk that comps aren't pricing in. Stress-test before assuming the spread holds.
Location & tenants
- Location reads 78/100 on livability (#28 in MO, #2,671 nationally) — a middle-class / working-renter tenant base. Strengths: amenities A+, commute A+, cost of living A+; Watch: crime F.
- Kansas City 33 (urban): math 12% / reading 24% proficiency, ranked #308 of 324 in MO (top 95%) — low school quality limits family demand, transient renter base, plan for 1-2y turnover; 75% free/reduced lunch — lower-income household profile, screen leases tightly.
- Zoned schools: Ac Prep Elementary (math 12% / reading 27%, grade F, #941 of 1,115 statewide, top 86%, 341 students, 99% FRL); Northeast Middle School (math 4% / reading 9%, grade F, #384 of 391 statewide, top 98%, 555 students, 100% FRL); East High School (math 0% / reading 13%, grade F, #516 of 521 statewide, top 99%, 1,112 students, 100% FRL) — zoned schools average 99% FRL vs 75% district-wide (24 pts higher); higher-poverty schools than district average — tighter screening recommended.
- Market conditions: 12 active listings in the ZIP; 12 comparable units currently listed for rent nearby; rentals at typical pace (median 26d on market — plan ~3-4 weeks tenant-placement turnaround); 42% of comp listings sitting > 30 days — soft ceiling on asking rent; 4,002 units permitted in Jackson County in 2024 (2,271 in 5+ unit buildings).
Forward outlook
- In year one you build about $9k of equity ($553 loan paydown + $8k appreciation (10.0% local appreciation)).
- Jackson County population projected at +4% by 2050 — modest demand growth; plan on rents tracking national, not racing it.
- At projected returns (10.0% appreciation + 3.0% rent growth), your $22k cash investment doubles in ~2 years — after that, you're playing with house money.
- By year 4, paydown + projected appreciation supports a ~$30k cash-out refi (75% LTV) — recoverable capital for the next deal without selling this one.
Negotiation context
- Only 5 days on market — expect competitive offers; lowballing is unlikely to land.
Risks & watch-outs
- Watch-outs: built in 1918 — expect roof / HVAC / electrical / plumbing capex.
Questions for the listing agent
- Built in 1918 — when were the roof, HVAC, electrical panel, plumbing, and water heater last replaced?
- Is there a deadline driving the sale (1031 exchange, divorce, estate, relocation)? That informs how much negotiation room exists.
- Crime grade is F in this area — have there been break-ins, vandalism, or insurance claims at this property in the last 3 years? What carrier currently insures it and at what premium?
- What's the average days-on-market for RENTAL listings here right now (not sales)? A rising rental-DOM trend means longer vacancies and softer asking-rent achievability than the comps imply.
- What's the recent tenant-quality profile in this submarket — average credit score on applications, eviction rate, late-payment / NSF rate, and stable-employment percentage? A property-management company in the area should have these aggregated.
- How much new for-sale + rental construction is in the pipeline within 1–3 miles? Heavy new supply typically softens prices + rents 12–24 months out; constrained supply supports both.
Investment metrics
- 1% rule
- 1.40% ✓
- Cap rate
- 12.01%
- Cash-on-cash
- 20.40%
- DSCR
- 1.91
- GRM
- 6.0
CMA / ARV
- ARV (on-the-fly)
- $128,316
- Comps found
- 11
Show comp detail 11 sales within ~0.75 mi
| Address | Dist | Beds/Ba | Sqft | Sold | Price | $/sf | Match |
|---|---|---|---|---|---|---|---|
| 716 Lewis Ave | 0.12mi | 3/1.0 (+1) | 1,062 (-8%) | 8mo | $49,000 | $46 | 69 |
| 8715 E Roberts St | 0.06mi | 3/1.5 (+1) | 1,056 (-9%) | 12mo | $20,000 | $19 | 66 |
| 8727 E Lexington Ave | 0.22mi | 2/1.0 | 1,320 (+14%) | 3mo | $99,900 | $76 | 63 |
| 537 S Brookside Ave | 0.61mi | 3/1.0 (+1) | 1,185 (+2%) | 8mo | $162,500 | $137 | 55 |
| 8610 Smart Ave | 0.20mi | 3/2.0 (+1) | 1,280 (+11%) | 16mo | $175,000 | $137 | 50 |
| 531 S Brookside Ave | 0.62mi | 3/2.0 (+1) | 1,133 (-2%) | 12mo | $165,000 | $146 | 49 |
| 8919 E Independence Ave | 0.25mi | 2/1.0 | 988 (-14%) | 20mo | $140,000 | $142 | 48 |
| 807 Ditman Ave | 0.28mi | 3/1.5 (+1) | 1,300 (+12%) | 17mo | $129,900 | $100 | 45 |
| 578 S Oxford Ave | 0.65mi | 3/1.0 (+1) | 990 (-14%) | 2mo | $89,000 | $90 | 39 |
| 9300 E 9th St S | 0.71mi | 3/1.5 (+1) | 1,122 (-3%) | 21mo | $125,000 | $111 | 38 |
| 585 S Glenwood Ave | 0.73mi | 3/1.0 (+1) | 1,075 (-7%) | 14mo | $175,000 | $163 | 37 |
Match score weights: distance 35% · size 25% · config 20% · recency 20%. Top-matched comps best support the ARV.
Projected returns pro-forma
10.0% appreciation · 3.0% rent growth · sell at horizon
- IRR
- 39.5%
- Equity multiple
- 4.03×
- Total profit
- $67,815
- Equity at exit
- $72,070
- IRR
- 34.0%
- Equity multiple
- 9.06×
- Total profit
- $180,601
- Equity at exit
- $155,422
Cash invested: $22,400 (down + closing). Projections, not guarantees.
Landlord ↔ Tenant lean methodology
- Overall (STATE)
- 81 Strongly Landlord-Friendly
- State Missouri
- 81 Strongly Landlord-Friendly · R+10
- County
- — inherits STATE
- City
- — inherits STATE
ZIP-level market 64125
- Home prices YoY
- 3.1%
- Active inventory
- 12
- Price-to-rent
- 6.0×
Monthly cashflow live
- Estimated rent
- $1,120 high interval (Pro) →
- Mortgage (P&I)
- −$420
- Tax from tax record
- −$51 /mo · $611/yr
- Insurance
- −$33
- HOA
- −$0
- Vacancy / Maint / Mgmt
- −$235
- Net cashflow
- $381
Break-even live
Sensitivity live
| Price | -10% $426 | -5% $404 | +0% $381 | +5% $358 | +10% $336 |
|---|---|---|---|---|---|
| Rent | -10% $292 | -5% $337 | +0% $381 | +5% $425 | +10% $469 |
| Rate | -1.0pp $421 | -0.5pp $401 | base $381 | +0.5pp $360 | +1.0pp $339 |
UW: 25.0% down · 7.5% · 30yr · 1.5% tax · 5.0% vac · 8.0% maint · 8.0% mgmt
Financing live
Cash to close
- Down payment
- $20,000
- Closing costs
- $2,400
- Reserves months
- —
- Total cash needed
- —
Loan-product check · same deal, 3 products live
Conventional
25% down · 7.5% · 30yr
- Down + closing
- —
- Monthly P&I
- —
- Monthly cashflow
- —
- DSCR
- —
- Eligible?
- —
Personal DTI + credit; lowest rate.
DSCR
20% down · 8.5% · 30yr
- Down + closing
- —
- Monthly P&I
- —
- Monthly cashflow
- —
- DSCR
- —
- Eligible?
- —
No personal income docs; deal must DSCR.
Hard money
10% down · 12.0% · 12mo
- Down + closing
- —
- Monthly P&I
- —
- Monthly cashflow
- —
- DSCR
- —
- Eligible?
- —
Short-term bridge; refi at stabilization.
Rent comps 12 comps
| Address | Beds | Baths | Sqft | Rent | $/sqft | DOM | Units | Dist |
|---|---|---|---|---|---|---|---|---|
| 8705 E Smart Ave Independence, MO | 2.0 | 1.0 | 750 | $1,000 | $1.33 | 45d | 1 | 0.16mi |
| 576 S Oxford Ave Independence, MO | 3.0 | 2.0 | 1098 | $1,400 | $1.28 | 45d | 1 | 0.63mi |
| 578 S Oxford Ave Independence, MO | 3.0 | 1.0 | 990 | $1,400 | $1.41 | 0d | 1 | 0.63mi |
| 600 S Glenwood Ave Unit F Independence, MO | 2.0 | 1.0 | 750 | $995 | $1.33 | 22d | 1 | 0.66mi |
| 600 S Glenwood Ave Unit I Independence, MO | 1.0 | 1.0 | 700 | $695 | $0.99 | 45d | 1 | 0.67mi |
| 100 S Oxford Ave Independence, MO | 3.0 | 2.0 | 1141 | $1,425 | $1.25 | 46d | 1 | 0.77mi |
| 1138 S Glenwood Ave Independence, MO | 2.0 | 1.0 | 1180 | $1,095 | $0.93 | 22d | 1 | 0.84mi |
| 9528 E Winner Rd Independence, MO | 1.0–3.0 | 1.0 | 730 | $999 | $1.37 | 45d | 1 | 0.87mi |
| 10104 E Golf Ave Independence, MO | 3.0 | 2.0 | 1205 | $1,395 | $1.16 | 16d | 1 | 1.13mi |
| 611 Ewing Ave Unit B Kansas City, MO | 1.0 | 1.0 | 700 | $800 | $1.14 | 25d | 1 | 1.27mi |
| 611 Ewing Ave Unit A Kansas City, MO | 1.0 | 1.0 | 700 | $800 | $1.14 | 0d | 1 | 1.27mi |
| 10522 E 10th St S Independence, MO | 2.0 | 1.0 | 1020 | $1,099 | $1.08 | 25d | 1 | 1.47mi |
Listing history 4 events
-
2026-06-21days on market $80,000 Coming Soon 5 DOM
-
2026-06-18days on market $80,000 Coming Soon 2 DOM
-
2026-06-16remarks 131-char remark
-
2026-06-16$80,000 Coming Soon 1 DOM
ⓘ Source: listings_history table (triggers on properties + properties_extension) + one-shot
backfill from property_details.listing_events for pre-trigger history.
Tax reassessment forecast MO · Resets to sale price
- Current annual tax
- $611 · $51/mo
- Projected year-2 tax
- $776 · $65/mo
- Expected delta
- +$165/yr (+$14/mo · 27.0%)
ⓘ Screening estimate from a state-policy table — verify with the county assessor before closing.
Climate risk First Street
- Flood 1/10 Low FEMA zone X (unshaded) · 0% chance over 30 yrs
- Wildfire 2/10 Low
- Heat 4/10 Moderate 7 d/yr ≥106°F today · 16 d/yr by 30 yrs out
- Wind 2/10 Low
- Air quality 3/10 Moderate 2 unhealthy d/yr today · 3 by 30 yrs out
Nearby sold comps map
Loading sold comps map…
Walkable amenities ~0.75 mi
Loading nearby amenities…
Taxation est. · year 1
- Rental income
- $13,438
- − Mortgage interest
- −$4,481
- − Property taxes
- −$611
- − Insurance
- −$400
- − Repairs & maintenance
- −$1,075
- − Management
- −$1,075
- − Depreciation
- −$2,327
- Taxable income
- $3,468
- Est. tax owed @ 24.0%
- −$832
- After-tax cash flow
- $3,738/yr
For passive investors: Depreciation is non-cash, so a rental often shows a tax loss while cash-flowing — sheltering income. Rental losses are passive: they offset passive income freely, and up to $25,000/yr can offset ordinary (W-2) income if you actively participate and your MAGI is under $100k (phasing out to $0 by $150k); unused losses carry forward. On sale, claimed depreciation is recaptured at up to 25%, and gains may owe capital-gains tax (a 1031 exchange can defer both). Figures are a year-1 estimate at your 24.0% rate — not tax advice; consult a CPA.
Schools (NCES district)
- District
- Kansas City 33
- NCES district ID
- 2916400
- Math proficiency
- 12% ▼ -8.00%
- Reading proficiency
- 24% ▬ 0.00%
- Median HH income
- $35,227
- Composite
- 14.8/100
- National rank
- #9387
- State rank
- #308 of 324 in MO
Livability — Kansas City
- Score
- 78/100
- State rank
- #28
- US rank
- #2671
Category grades
Schools grade is shown separately in the Schools card above.
Census & demographics
- Census place
- Kansas City, MO
- City population
- 439,467
- Population (ZIP)
- 2,723
Population outlook (Jackson County) Hauer SSP2
- Today (2025)
- 719,589 people
- By 2030
- 731,456 · +1.6%
- By 2040
- 746,689 · +3.8%
- By 2050
- 749,289 · +4.1%
- By 2075
- 736,227 · +2.3%
- By 2100
- 668,210 · -7.1%
Race, ethnicity, and origin ACS 2023
- Neighborhood character
- Majority Hispanic (61%)
- Race & ethnicity
- Hispanic / Latino 61% White 26% Black 10% Two or more races 7%
- Hispanic origin (detail)
- Mexican 50% Puerto Rican 1%
- Common ancestry
- Serbian 1% Slovak 1%
- Foreign-born
- 15% · Canada, South Korea
- Languages at home
- 52% English-only · Spanish 48%
Political lean MEDSL · Jackson
- 2024 margin
- D (+19.3) · D 58.9% · R 39.5% · Other 1.6%
- 2008→2024 swing
- -6.1pp toward R · 2008: 25.4pp · 2024: 19.3pp
- All cycles
- 2024: D+19.3 2020: D+22.0 2016: D+16.6 2012: D+19.0 2008: D+25.4
Not yet ingested
- Civics
- —
Market trends
- HPI YoY
- ▲ 14.18%
- Current HPI
- 471.552
- Rent YoY
- —
- Metro
- —
- State GDP YoY
- ▲ 1.84%
- F500 in state
- 20
Industry mix (Fortune 500 HQ in MO)
| Industry | F500 HQs | Revenue |
|---|---|---|
| Healthcare | 1 | $163B |
|
||
| Insurance | 1 | $21B |
|
||
| Industrial Technology | 1 | $17B |
|
||
| Retail | 1 | $16B |
|
||
| Industrial Distribution | 1 | $10B |
|
||
| Utilities | 1 | $9B |
|
||
Price history
2 events — show timeline
- 2026-06-16 Coming Soon $80,000 Heartland MLS as Distributed by MLS Grid
- 1995-10-25 Sold (Public Records) — Public Records
Property tax history
+3.7%/yrLatest (2025): $611 · -40.1% YoY. Source: county tax records.
Cash-flow waterfall
monthlySold comps — $/sqft
last 12 mo · ≤1 miLoading sold comps…