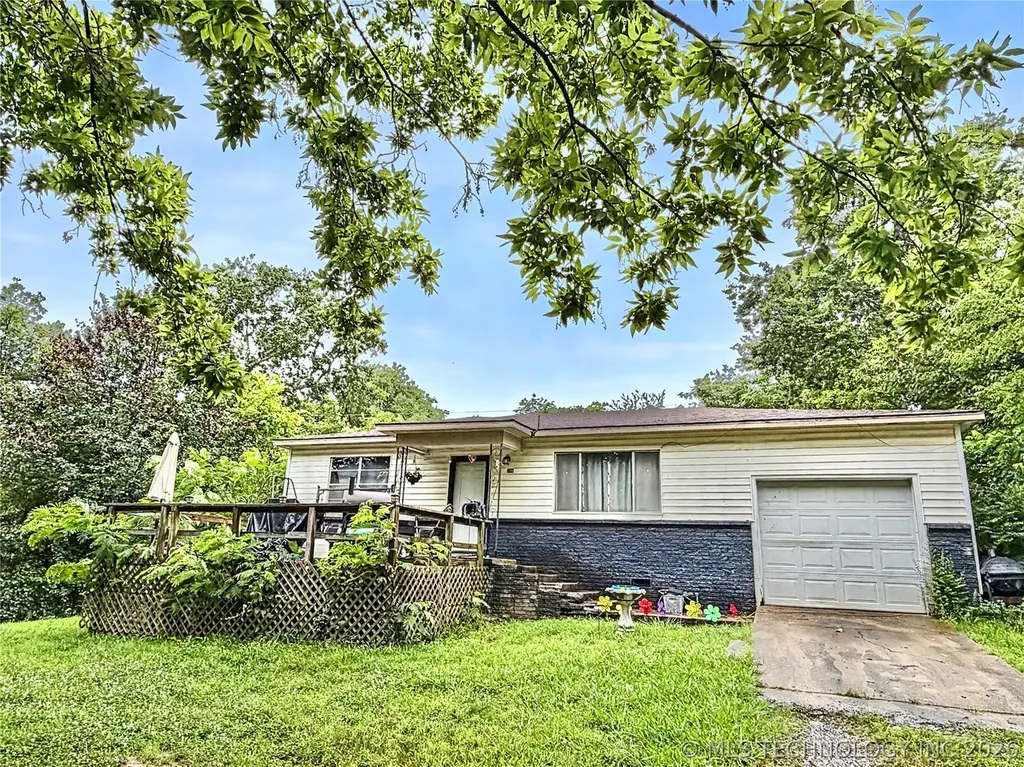
1306 Stickross Mountain Rd · Tahlequah, OK
Flood risk No data
- FEMA flood zone
- —
- Chance of flooding over 30 yrs
- —
- Est. flood insurance / yr
- —
Fire risk No data
- Est. fire insurance / yr
- —
Heat risk No data
- Hot days now (above threshold)
- —
- Hot days in 30 yrs
- —
Wind risk No data
- Chance of severe wind over 30 yrs
- —
Air-quality risk No data
- Unhealthy air days now
- —
- Unhealthy air days in 30 yrs
- —
Risk factors via First Street. Map © Google.
Why this score? — see what drove the B grade
The composite is a weighted blend of 9 inputs, each scored 0–100. Each bar is that input's sub-score; the figure is the points it added to the 100-point composite (weight × sub-score).
- Cash flow +27.6/30.0
- ARV discount +15.0/15.0
- DSCR +9.7/10.0
- 1% rule +6.4/10.0
- Rent growth +4.8/5.0
- Livability +3.3/5.0
- Condition / age +2.5/5.0
- Schools +2.1/10.0
- Appreciation +0.0/10.0
$94,900
🖨 Deal sheet (PDF) 📄 Offer letter ✓ Due diligence
Listing remarks
Centrally located and full of potential, this property offers flexibility for investors of all types. The current occupant would love to remain, making this an attractive option for those seeking immediate rental income. Prefer a renovation project? This home also presents a great opportunity for a remodel, flip, or addition to your rental portfolio. Prime central location. Potential rental income from day one. Remodel and value-add opportunity. Ideal for investors, flippers, or landlords. Endless possibilities to maximize returns.
Key facts
- Remodel opportunity
- 0.31 acre lot
- Garage
Tags
Property features AI
Exterior
- Parking: Attached garage (1 car)
- Security: No safety shelter
- Utilities: Public water; Septic tank sewer; Electricity available; Phone service available
- Home design: Single-story dwelling; Faces east; Crawlspace foundation
- Construction: Wood frame construction; Asphalt/fiberglass roof
- Exterior features: Dog run; Gravel driveway; Deck; Partial chain link fencing; Mature trees on lot
Interior
- Kitchen: Built-in range; Oven
- Flooring: Vinyl flooring
- Bathrooms: One full bathroom
- Heating & cooling: Gas heating; Window air conditioning units
- Interior features: Aluminum frame windows; Laminate countertops; No additional interior features listed
- Laundry & utility: Washer hookup; Electric water heater
Neighborhood map
What this means for you Summary
Snapshot
- This is a 2-bed/1.0-bath single-family listed at $95k.
Deal economics
- At list price, monthly cash flow is $283 ($3k/yr) — positive.
- The deal already cash-flows at list — no discount required.
- Meets the 1% rule at list price ($1k rent vs $95k).
- Recommended offer: $93k (1.5% below list) — sets the bar for market timing.
- Cap rate 9.9% vs local median 4.3% in Tahlequah — top-decile yield for the area; either an underpriced asset or a hidden risk that comps aren't pricing in. Stress-test before assuming the spread holds.
Location & tenants
- Location reads 66/100 on livability (#124 in OK) — a middle-class / working-renter tenant base. Strengths: cost of living A+, housing A; Watch: amenities D, commute F, employment F.
- Tahlequah (town): math 27% / reading 25% proficiency, ranked #109 of 270 in OK (top 40%) — low school quality limits family demand, transient renter base, plan for 1-2y turnover; 64% free/reduced lunch — lower-income household profile, screen leases tightly.
- Zoned schools: Greenwood Es (math 26% / reading 21%, grade F, #407 of 845 statewide, top 48%, 503 students, 0% FRL); Tahlequah Ms (math 28% / reading 25%, grade F, #77 of 345 statewide, top 22%, 676 students, 0% FRL); Tahlequah Hs (math 23% / reading 33%, grade F, #122 of 447 statewide, top 27%, 1,300 students, 0% FRL) — zoned schools average 0% FRL vs 64% district-wide (64 pts lower); this property's tenant base skews higher-income than the district average.
- Market conditions: Rents rising fast (+9.2%/yr); 369 active listings in the ZIP; 48 units permitted in Cherokee County in 2024 (0 in 5+ unit buildings).
Forward outlook
- Local home prices are declining (-3.0%/yr); year-one equity from $656 of loan paydown is wiped out by about $3k of value loss. Plan a longer hold.
- Cherokee County population projected at +15% by 2050 — modest demand growth; plan on rents tracking national, not racing it.
- At projected returns (-3.0% appreciation + 8.0% rent growth), your $27k cash investment doubles in ~7 years — after that, you're playing with house money.
Negotiation context
- It's been on market 20 days — a 2% lower offer ($93k) is reasonable based on typical stale-listing flexibility.
- Current owner paid $32k; list at $95k implies a 197% gain — meaningful room to come down on a strong offer.
Questions for the listing agent
- Built in 1960 — when were the roof, HVAC, electrical panel, plumbing, and water heater last replaced?
- Is there a deadline driving the sale (1031 exchange, divorce, estate, relocation)? That informs how much negotiation room exists.
- Schools are D-rated, which usually means shorter tenancies and higher turnover. Who's the typical renter profile here, and what's been the actual vacancy rate?
- What's the average days-on-market for RENTAL listings here right now (not sales)? A rising rental-DOM trend means longer vacancies and softer asking-rent achievability than the comps imply.
- What's the recent tenant-quality profile in this submarket — average credit score on applications, eviction rate, late-payment / NSF rate, and stable-employment percentage? A property-management company in the area should have these aggregated.
- How much new for-sale + rental construction is in the pipeline within 1–3 miles? Heavy new supply typically softens prices + rents 12–24 months out; constrained supply supports both.
Investment metrics
- 1% rule
- 1.14% ✓
- Cap rate
- 9.87%
- Cash-on-cash
- 12.76%
- DSCR
- 1.57
- GRM
- 7.3
CMA / ARV
- ARV (on-the-fly)
- $141,328
- Comps found
- 5
Show comp detail 5 sales within ~0.75 mi
| Address | Dist | Beds/Ba | Sqft | Sold | Price | $/sf | Match |
|---|---|---|---|---|---|---|---|
| 799 College Ct | 0.71mi | 3/1.0 (+1) | 978 (+1%) | 16mo | $142,500 | $146 | 47 |
| 903 Lamer Ave | 0.49mi | 1/1.0 (-1) | 1,032 (+7%) | 17mo | $125,000 | $121 | 47 |
| 835 Lamer Ave | 0.54mi | 3/2.0 (+1) | 912 (-6%) | 14mo | $149,900 | $164 | 45 |
| 535 S Mission Ave | 0.74mi | 2/1.0 | 868 (-10%) | 9mo | $108,900 | $125 | 41 |
| 708 S Cherokee Ave | 0.64mi | 3/1.5 (+1) | 1,112 (+15%) | 13mo | $171,000 | $154 | 27 |
Match score weights: distance 35% · size 25% · config 20% · recency 20%. Top-matched comps best support the ARV.
Projected returns pro-forma
-3.0% appreciation · 8.0% rent growth · sell at horizon
- IRR
- 7.6%
- Equity multiple
- 1.31×
- Total profit
- $8,287
- Equity at exit
- $14,150
- IRR
- 20.5%
- Equity multiple
- 3.12×
- Total profit
- $56,209
- Equity at exit
- $8,205
Cash invested: $26,572 (down + closing). Projections, not guarantees.
Landlord ↔ Tenant lean methodology
- Overall (STATE)
- 83 Strongly Landlord-Friendly
- State Oklahoma
- 83 Strongly Landlord-Friendly · R+20
- County
- — inherits STATE
- City
- — inherits STATE
ZIP-level market 74464
- Rents YoY
- 9.2%
- Active inventory
- 369
- Price-to-rent
- 7.3×
Monthly cashflow live
- Estimated rent
- $1,080 medium interval (Pro) →
- Mortgage (P&I)
- −$498
- Tax from tax record
- −$33 /mo · $398/yr
- Insurance
- −$40
- HOA
- −$0
- Vacancy / Maint / Mgmt
- −$227
- Net cashflow
- $283
Break-even live
Sensitivity live
| Price | -10% $336 | -5% $309 | +0% $283 | +5% $256 | +10% $229 |
|---|---|---|---|---|---|
| Rent | -10% $197 | -5% $240 | +0% $283 | +5% $325 | +10% $368 |
| Rate | -1.0pp $330 | -0.5pp $307 | base $283 | +0.5pp $258 | +1.0pp $233 |
UW: 25.0% down · 7.5% · 30yr · 1.5% tax · 5.0% vac · 8.0% maint · 8.0% mgmt
Financing live
Cash to close
- Down payment
- $23,725
- Closing costs
- $2,847
- Reserves months
- —
- Total cash needed
- —
Loan-product check · same deal, 3 products live
Conventional
25% down · 7.5% · 30yr
- Down + closing
- —
- Monthly P&I
- —
- Monthly cashflow
- —
- DSCR
- —
- Eligible?
- —
Personal DTI + credit; lowest rate.
DSCR
20% down · 8.5% · 30yr
- Down + closing
- —
- Monthly P&I
- —
- Monthly cashflow
- —
- DSCR
- —
- Eligible?
- —
No personal income docs; deal must DSCR.
Hard money
10% down · 12.0% · 12mo
- Down + closing
- —
- Monthly P&I
- —
- Monthly cashflow
- —
- DSCR
- —
- Eligible?
- —
Short-term bridge; refi at stabilization.
Listing history 15 events
-
2026-06-22days on market $94,900 Active 20 DOM
-
2026-06-19days on market $94,900 Active 17 DOM
-
2026-06-18days on market $94,900 Active 16 DOM
-
2026-06-17days on market $94,900 Active 15 DOM
-
2026-06-17price $94,900 Active 14 DOM
-
2026-06-16days on market $99,500 Active 14 DOM
-
2026-06-15days on market $99,500 Active 13 DOM
-
2026-06-14days on market $99,500 Active 11 DOM
-
2026-06-12days on market $99,500 Active 10 DOM
-
2026-06-09days on market $99,500 Active 7 DOM
-
2026-06-08days on market $99,500 Active 6 DOM
-
2026-06-07days on market $99,500 Active 5 DOM
-
2026-06-05days on market $99,500 Active 2 DOM
-
2026-06-03remarks 537-char remark
-
2026-06-03$99,500 Active 1 DOM
ⓘ Source: listings_history table (triggers on properties + properties_extension) + one-shot
backfill from property_details.listing_events for pre-trigger history.
Tax reassessment forecast OK · Resets to sale price
- Current annual tax
- $398 · $33/mo
- Projected year-2 tax
- $854 · $71/mo
- Expected delta
- +$456/yr (+$38/mo · 114.6%)
ⓘ Screening estimate from a state-policy table — verify with the county assessor before closing.
Nearby sold comps map
Loading sold comps map…
Walkable amenities ~0.75 mi
Loading nearby amenities…
Taxation est. · year 1
- Rental income
- $12,956
- − Mortgage interest
- −$5,316
- − Property taxes
- −$398
- − Insurance
- −$474
- − Repairs & maintenance
- −$1,036
- − Management
- −$1,036
- − Depreciation
- −$2,761
- Taxable income
- $1,934
- Est. tax owed @ 24.0%
- −$464
- After-tax cash flow
- $2,926/yr
For passive investors: Depreciation is non-cash, so a rental often shows a tax loss while cash-flowing — sheltering income. Rental losses are passive: they offset passive income freely, and up to $25,000/yr can offset ordinary (W-2) income if you actively participate and your MAGI is under $100k (phasing out to $0 by $150k); unused losses carry forward. On sale, claimed depreciation is recaptured at up to 25%, and gains may owe capital-gains tax (a 1031 exchange can defer both). Figures are a year-1 estimate at your 24.0% rate — not tax advice; consult a CPA.
Schools (NCES district)
- District
- Tahlequah
- NCES district ID
- 4029380
- Math proficiency
- 27% ▼ -14.00%
- Reading proficiency
- 25% ▼ -11.00%
- Median HH income
- $32,990
- Composite
- 21.28/100
- National rank
- #8393
- State rank
- #109 of 270 in OK
Livability — Tahlequah
- Score
- 66/100
- State rank
- #124
- US rank
- #12171
Category grades
Schools grade is shown separately in the Schools card above.
Census & demographics
- Census place
- Tahlequah, OK
- County
- Cherokee County · 31,116 people
- City population
- 31,116
- Metro
- Tahlequah, OK
- Population (ZIP)
- 31,116
- Household income
- $51,262
- Rent vs Own
- Severe rent burden
- 1058.0
Population outlook (Cherokee County) Hauer SSP2
- Today (2025)
- 51,747 people
- By 2030
- 53,481 · +3.4%
- By 2040
- 56,503 · +9.2%
- By 2050
- 59,370 · +14.7%
- By 2075
- 67,178 · +29.8%
- By 2100
- 70,900 · +37.0%
Race, ethnicity, and origin ACS 2023
- Neighborhood character
- Highly diverse neighborhood (Simpson 0.82)
- Race & ethnicity
- White 41% Native American 35% Two or more races 16% Hispanic / Latino 10% Black 2%
- Hispanic origin (detail)
- Mexican 8%
- Common ancestry
- Italian 2% Slovak 2% Lithuanian 1%
- Foreign-born
- 4% · Canada
- Languages at home
- 90% English-only · Spanish 6%
Political lean MEDSL · Cherokee
- 2024 margin
- Solid R (+32.6) · D 32.7% · R 65.3% · Other 2.0%
- 2008→2024 swing
- -20.4pp toward R · 2008: -12.2pp · 2024: -32.6pp
- All cycles
- 2024: R+32.6 2020: R+29.3 2016: R+27.5 2012: R+14.1 2008: R+12.2
Not yet ingested
- Civics
- —
Market trends
- HPI YoY
- ▼ -184.14%
- Current HPI
- 226.4004
- Rent YoY
- ▲ 9.23%
- Metro
- Tahlequah, OK
- State GDP YoY
- ▲ 1.55%
- F500 in state
- 6
Industry mix (Fortune 500 HQ in OK)
| Industry | F500 HQs | Revenue |
|---|---|---|
| Energy | 3 | $48B |
|
||
Price history
+210.9% since first listed2 events — show timeline
- 2026-06-02 Listed $99,500 MLS Technology, Inc.
- 2002-03-15 Sold (Public Records) $32,000 Public Records
Property tax history
+0.3%/yrLatest (2025): $398 · -5.5% YoY. Source: county tax records.
Cash-flow waterfall
monthlySold comps — $/sqft
last 12 mo · ≤1 miLoading sold comps…