21 Pine Arbor Ln · Florida Ridge, FL
Flood risk 9/10 · Severe
- FEMA flood zone
- X (unshaded)
- Chance of flooding over 30 yrs
- 0.99%
- Est. flood insurance / yr
- $507 – $1,088
Fire risk 4/10 · Minor
- Est. fire insurance / yr
- $947 – $1,759
Heat risk 10/10 · Severe
- Hot days now (above 106°F)
- 7 days/yr
- Hot days in 30 yrs
- 24 days/yr
Wind risk 10/10 · Severe
- Chance of severe wind over 30 yrs
- 99.0%
Air-quality risk 1/10 · Minimal
- Unhealthy air days now
- 0 days/yr
- Unhealthy air days in 30 yrs
- 0 days/yr
Risk factors via First Street. Map © Google.
Why this score? — see what drove the B- grade
The composite is a weighted blend of 9 inputs, each scored 0–100. Each bar is that input's sub-score; the figure is the points it added to the 100-point composite (weight × sub-score).
- Cash flow +29.1/30.0
- DSCR +10.0/10.0
- 1% rule +8.1/10.0
- ARV discount +5.9/15.0
- Schools +4.2/10.0
- Livability +3.6/5.0
- Rent growth +3.5/5.0
- Condition / age +2.5/5.0
- Appreciation +0.0/10.0
$115,000
🖨 Deal sheet 📄 Offer letter ✓ Due diligence
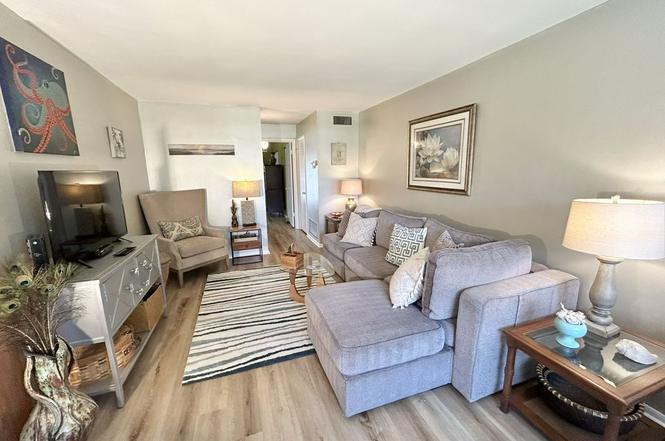
Listing remarks MLS
Short Sale. Take a look at this one! Clean, bright and well taken care of. Newer carpet & tile. Laundry is inside unit. Enclosed porch with views of tennis courts and pool. Storm Shutters. Community has 4 club houses, 4 heated pools, 3 tennis courts, shuffleboard and many activity rooms.
Key facts
- Tennis
- Turn key condo
- Shuffleboard
Tags
Neighborhood map
What this means for you Summary
Snapshot
- This is a 1-bed/1.5-bath townhouse listed at $115k.
Deal economics
- At list price, monthly cash flow is $331 ($4k/yr) — positive.
- The deal already cash-flows at list — no discount required.
- Meets the 1% rule at list price ($2k rent vs $115k).
- Recommended offer: $101k (12.0% below list) — sets the bar for market timing.
- Cap rate 10.4% vs local median 4.5% in Florida Ridge — top-decile yield for the area; either an underpriced asset or a hidden risk that comps aren't pricing in. Stress-test before assuming the spread holds.
Location & tenants
- Location reads 72/100 on livability (#353 in FL) — a middle-class / working-renter tenant base. Strengths: commute A+, cost of living A+, housing A+; Watch: schools D, employment D, amenities F.
- Indian River (other): math 48% / reading 52% proficiency, ranked #35 of 73 in FL (top 48%) — acceptable for families but not a draw, mixed tenant base, ~2y average lease.
- Market conditions: Rents rising fast (+4.2%/yr); 348 active listings in the ZIP; 32 comparable units currently listed for rent nearby; rentals at typical pace (median 21d on market — plan ~3-4 weeks tenant-placement turnaround); 564 units permitted in Indian River County in 2024 (281 in 5+ unit buildings).
Forward outlook
- Local home prices are declining (-3.0%/yr); year-one equity from $795 of loan paydown is wiped out by about $3k of value loss. Plan a longer hold.
- Indian River County population projected at +18% by 2050 — long-run rental-demand tailwind backs the buy-and-hold thesis.
- At projected returns (-3.0% appreciation + 4.2% rent growth), your $32k cash investment doubles in ~9 years — after that, you're playing with house money.
Negotiation context
- It's been on market 170 days — a 12% lower offer ($101k) is reasonable based on typical stale-listing flexibility.
- 3 sale attempts; this cycle's ask has dropped $19k (14%) from the opening price — seller is motivated, your offer sets the floor, not the list.
- Current owner paid $25k; list at $115k implies a 360% gain — meaningful room to come down on a strong offer.
Risks & watch-outs
- Watch-outs: flood insurance adds $66/mo.
- Climate carrying-cost: severe flood risk; severe wind risk, 99% chance of damaging wind over 30y; extreme-heat days projected 7→24/yr by 2055 (HVAC capex compounding) — expect insurance premiums to compound above CPI over the hold.
Questions for the listing agent
- It's been on market 170 days. Have you received any prior offers? Is the seller open to a 12% concession, seller financing, or rate buy-down credit?
- Built in 1979 — when were the roof, HVAC, electrical panel, plumbing, and water heater last replaced?
- What's the actual annual flood-insurance premium (NFIP or private), and is the property in a SFHA with mandatory coverage?
- Why hasn't it sold? Are there any deal-killer items the seller is aware of (foundation, flood, title, zoning, code violations)?
- Is there a deadline driving the sale (1031 exchange, divorce, estate, relocation)? That informs how much negotiation room exists.
- Schools are D-rated, which usually means shorter tenancies and higher turnover. Who's the typical renter profile here, and what's been the actual vacancy rate?
- What's the average days-on-market for RENTAL listings here right now (not sales)? A rising rental-DOM trend means longer vacancies and softer asking-rent achievability than the comps imply.
- What's the recent tenant-quality profile in this submarket — average credit score on applications, eviction rate, late-payment / NSF rate, and stable-employment percentage? A property-management company in the area should have these aggregated.
- How much new for-sale + rental construction is in the pipeline within 1–3 miles? Heavy new supply typically softens prices + rents 12–24 months out; constrained supply supports both.
Investment metrics
- 1% rule
- 1.31% ✓
- Cap rate
- 10.44%
- Cash-on-cash
- 14.81%
- DSCR
- 1.66
- GRM
- 6.4
CMA / ARV
- ARV (on-the-fly)
- $111,000
- Comps found
- 12
Show comp detail 12 sales within ~0.75 mi
| Address | Dist | Beds/Ba | Sqft | Sold | Price | $/sf | Match |
|---|---|---|---|---|---|---|---|
| 14 Vista Palm Ln #105 | 0.09mi | 1/1.5 | 750 (0%) | 0mo | $85,000 | $113 | 96 |
| 12 Vista Palm Ln #205 | 0.12mi | 1/1.5 | 750 (0%) | 4mo | $89,500 | $119 | 91 |
| 34 Pine Arbor Ln #203 | 0.21mi | 1/1.5 | 750 (0%) | 3mo | $120,000 | $160 | 88 |
| 55 Woodland Dr #203 | 0.44mi | 1/1.5 | 750 (0%) | 2mo | $90,000 | $120 | 78 |
| 46 Woodland Dr #103 | 0.49mi | 1/1.5 | 750 (0%) | 4mo | $116,500 | $155 | 74 |
| 61 Woodland Dr #205 | 0.51mi | 1/1.5 | 750 (0%) | 3mo | $46,500 | $62 | 73 |
| 89 Crooked Tree Ln #103 | 0.61mi | 1/1.5 | 750 (0%) | 2mo | $66,000 | $88 | 70 |
| 78 Royal Oak Dr #103 | 0.69mi | 1/1.5 | 750 (0%) | 2mo | $111,000 | $148 | 66 |
| 84 Crooked Tree Ln #105 | 0.67mi | 1/1.5 | 750 (0%) | 3mo | $124,000 | $165 | 66 |
| 3 Vista Palm Ln #204 | 0.25mi | 1/1.0 | 670 (-11%) | 6mo | $107,000 | $160 | 64 |
| 74 Royal Oak Ct #205 | 0.71mi | 1/1.5 | 750 (0%) | 4mo | $75,000 | $100 | 63 |
| 671 S Centre Ct SW #201 | 0.68mi | 2/2.0 (+1) | 814 (+8%) | 4mo | $125,000 | $154 | 44 |
Match score weights: distance 35% · size 25% · config 20% · recency 20%. Top-matched comps best support the ARV.
Projected returns pro-forma
-3.0% appreciation · 4.18% rent growth · sell at horizon
- IRR
- 3.4%
- Equity multiple
- 1.13×
- Total profit
- $4,324
- Equity at exit
- $17,147
- IRR
- 14.1%
- Equity multiple
- 2.20×
- Total profit
- $38,790
- Equity at exit
- $9,943
Cash invested: $32,200 (down + closing). Projections, not guarantees.
Landlord ↔ Tenant lean methodology
- Overall (STATE)
- 87 Strongly Landlord-Friendly
- State Florida
- 87 Strongly Landlord-Friendly · R+3
- County
- — inherits STATE
- City
- — inherits STATE
ZIP-level market 32962
- Rents YoY
- 4.2%
- Active inventory
- 348
- Price-to-rent
- 6.4×
Monthly cashflow live
- Estimated rent
- $1,509 high interval (Pro) →
- Mortgage (P&I)
- −$603
- Tax est. 1.5%
- −$144 /mo · $1,725/yr
- Insurance
- −$48
- Flood insurance flood zone
- −$66 /mo · $798/yr
- HOA
- −$0
- Vacancy / Maint / Mgmt
- −$317
- Net cashflow
- $331
Break-even live
UW: 25.0% down · 7.5% · 30yr · 1.5% tax · 5.0% vac · 8.0% maint · 8.0% mgmt
Financing live
Cash to close
- Down payment
- $28,750
- Closing costs
- $3,450
- Reserves months
- —
- Total cash needed
- —
Loan-product check · same deal, 3 products live
Conventional
25% down · 7.5% · 30yr
- Down + closing
- —
- Monthly P&I
- —
- Monthly cashflow
- —
- DSCR
- —
- Eligible?
- —
Personal DTI + credit; lowest rate.
DSCR
20% down · 8.5% · 30yr
- Down + closing
- —
- Monthly P&I
- —
- Monthly cashflow
- —
- DSCR
- —
- Eligible?
- —
No personal income docs; deal must DSCR.
Hard money
10% down · 12.0% · 12mo
- Down + closing
- —
- Monthly P&I
- —
- Monthly cashflow
- —
- DSCR
- —
- Eligible?
- —
Short-term bridge; refi at stabilization.
Rent comps 32 comps
| Address | Beds | Baths | Sqft | Rent | $/sqft | DOM | Units | Dist |
|---|---|---|---|---|---|---|---|---|
| 19 Pine Arbor Ln #105 Vero Beach, FL | 1.0 | 1.5 | 750 | $1,800 | $2.40 | 21d | 1 | 0.08mi |
| 28 Pine Arbor Ln #103 Vero Beach, FL | 1.0 | 1.5 | 750 | $1,200 | $1.60 | 21d | 1 | 0.09mi |
| 16 Vista Palm Ln Vero Beach, FL | 1.0–2.0 | 1.5–2.0 | 800 | $1,500 | $1.88 | 21d | 2 | 0.16mi |
| 37 Pine Arbor Ln #101 Vero Beach, FL | 2.0 | 2.0 | 1000 | $1,600 | $1.60 | 13d | 1 | 0.22mi |
| 5 Vista Palm Ln #203 Vero Beach, FL | 1.0 | 1.5 | 750 | $1,500 | $2.00 | 13d | 1 | 0.24mi |
| 36 Pine Arbor Ln Vero Beach, FL | 2.0 | 2.0 | 1000 | $1,550 | $1.55 | 21d | 2 | 0.24mi |
| 58 Woodland Dr #206 Vero Beach, FL | 2.0 | 2.0 | 1000 | $1,800 | $1.80 | 13d | 1 | 0.47mi |
| 50 Woodland Dr #203 Vero Beach, FL | 1.0 | 1.5 | 750 | $1,350 | $1.80 | 13d | 1 | 0.49mi |
| 60 Woodland Dr Vero Beach, FL | 1.0 | 1.0 | 630 | $1,125 | $1.79 | 21d | 1 | 0.52mi |
| 60 Woodland Dr #204 Vero Beach, FL | 1.0 | 1.0 | 630 | $1,250 | $1.98 | 13d | 1 | 0.52mi |
| 52 Woodland Dr #204 Vero Beach, FL | 1.0 | 1.0 | 630 | $1,300 | $2.06 | 21d | 1 | 0.53mi |
| 65 Woodland Dr #207 Vero Beach, FL | 2.0 | 2.0 | 1000 | $1,600 | $1.60 | 21d | 1 | 0.53mi |
| 86 Crooked Tree Ln #102 Vero Beach, FL | 2.0 | 2.0 | 1000 | $2,000 | $2.00 | 13d | 1 | 0.62mi |
| 85 Crooked Tree Ln #203 Vero Beach, FL | 1.0 | 1.5 | 750 | $1,450 | $1.93 | 21d | 1 | 0.65mi |
| 80 Crooked Tree Ln #106 Vero Beach, FL | 2.0 | 2.0 | 1000 | $1,900 | $1.90 | 13d | 1 | 0.67mi |
| 74 Royal Oak Ct #204 Vero Beach, FL | 1.0 | 1.0 | 630 | $1,175 | $1.87 | 21d | 1 | 0.68mi |
| 103 Royal Oak Dr #106 Vero Beach, FL | 2.0 | 2.0 | 1000 | $1,800 | $1.80 | 13d | 1 | 0.76mi |
| 101 Spring Lake Dr #204 Vero Beach, FL | 1.0 | 1.0 | 630 | $1,275 | $2.02 | 21d | 1 | 0.78mi |
| 95 Spring Lake Dr #103 Vero Beach, FL | 1.0 | 1.5 | 750 | $1,600 | $2.13 | 21d | 1 | 0.78mi |
| 102 Royal Oak Dr #105 Vero Beach, FL | 1.0 | 1.5 | 750 | $1,550 | $2.07 | 21d | 1 | 0.82mi |
| 15 Vista Gardens Trl #104 Vero Beach, FL | 1.0 | 1.0 | 630 | $1,300 | $2.06 | 13d | 1 | 1.07mi |
| 43 Vista Gardens Trl #205 Vero Beach, FL | 1.0 | 1.5 | 750 | $1,450 | $1.93 | 21d | 1 | 1.21mi |
| 23 Vista Gardens Trl #203 Vero Beach, FL | 1.0 | 1.5 | 750 | $1,500 | $2.00 | 21d | 1 | 1.24mi |
| 26 Vista Gardens Trl #203 Vero Beach, FL | 1.0 | 1.5 | 750 | $1,350 | $1.80 | 21d | 1 | 1.32mi |
| 33 Vista Gardens Trl #104 Vero Beach, FL | 1.0 | 1.0 | 630 | $1,500 | $2.38 | 13d | 1 | 1.35mi |
| 36 Vista Gardens Trl #201 Vero Beach, FL | 2.0 | 2.0 | 1000 | $1,390 | $1.39 | 21d | 1 | 1.36mi |
| 34 Vista Gardens Trl #107 Vero Beach, FL | 2.0 | 2.0 | 1000 | $1,350 | $1.35 | 21d | 1 | 1.36mi |
| 28 Vista Gardens Trl #102 Vero Beach, FL | 2.0 | 2.0 | 1000 | $1,550 | $1.55 | 21d | 1 | 1.37mi |
| 35 Vista Gardens Trl #205 Vero Beach, FL | 1.0 | 1.5 | 934 | $1,400 | $1.50 | 21d | 1 | 1.38mi |
| 11 Vista Gardens Trl #106 Vero Beach, FL | 2.0 | 2.0 | 1000 | $1,600 | $1.60 | 21d | 1 | 1.39mi |
| 4 Vista Gardens Trl #207 Vero Beach, FL | 2.0 | 2.0 | 1000 | $1,550 | $1.55 | 13d | 1 | 1.39mi |
| 528 7th Sq #102 Vero Beach, FL | 2.0 | 2.0 | 1095 | $3,000 | $2.74 | 21d | 1 | 1.50mi |
Listing history 9 events
-
2026-03-14historical Under Contract
-
2026-01-11status Active
-
2026-01-11price $115,000
-
2025-12-28historical
-
2025-09-19price $128,000
-
2025-09-11$134,000 Active
-
2025-08-09historical $1,300
-
2025-06-30$1,300
-
2013-03-20soldstatus $25,000 294-char remark
Show marketing remark (294 chars)
Short Sale. Take a look at this one! Clean, bright and well taken care of. Newer carpet & tile. Laundry is inside unit. Enclosed porch with views of tennis courts and pool. Storm Shutters. Community has 4 club houses, 4 heated pools, 3 tennis courts, shuffleboard and many activity rooms.
ⓘ Source: listings_history table (triggers on properties + properties_extension) + one-shot
backfill from property_details.listing_events for pre-trigger history.
Climate risk First Street
- Flood 9/10 Extreme FEMA zone X (unshaded) · 99% chance over 30 yrs
- Wildfire 4/10 Moderate
- Heat 10/10 Extreme 7 d/yr ≥106°F today · 24 d/yr by 30 yrs out
- Wind 10/10 Extreme 99% chance of damaging wind over 30 yrs
- Air quality 1/10 Low 0 unhealthy d/yr today · 0 by 30 yrs out
Nearby sold comps map
Loading sold comps map…
Walkable amenities ~0.75 mi
Loading nearby amenities…
Taxation est. · year 1
- Rental income
- $18,110
- − Mortgage interest
- −$6,442
- − Property taxes
- −$1,725
- − Insurance
- −$1,372
- − Repairs & maintenance
- −$1,449
- − Management
- −$1,449
- − Depreciation
- −$3,345
- Taxable income
- $2,327
- Est. tax owed @ 24.0%
- −$559
- After-tax cash flow
- $3,414/yr
For passive investors: Depreciation is non-cash, so a rental often shows a tax loss while cash-flowing — sheltering income. Rental losses are passive: they offset passive income freely, and up to $25,000/yr can offset ordinary (W-2) income if you actively participate and your MAGI is under $100k (phasing out to $0 by $150k); unused losses carry forward. On sale, claimed depreciation is recaptured at up to 25%, and gains may owe capital-gains tax (a 1031 exchange can defer both). Figures are a year-1 estimate at your 24.0% rate — not tax advice; consult a CPA.
Schools (NCES district)
- District
- Indian River
- NCES district ID
- 1200930
- Math proficiency
- 48% ▼ -9.00%
- Reading proficiency
- 52% ▼ -3.00%
- Median HH income
- $46,597
- Composite
- 42.45/100
- National rank
- #3218
- State rank
- #35 of 73 in FL
Livability — Florida Ridge
- Score
- 72/100
- State rank
- #353
- US rank
- #6129
Category grades
Schools grade is shown separately in the Schools card above.
Census & demographics
- Census place
- Florida Ridge, FL
- County
- Indian River County · 143,738 people
- City population
- 25,629
- Metro
- Sebastian-Vero Beach, FL
- Population (ZIP)
- 25,522
- Household income
- $66,664
- Rent vs Own
- Severe rent burden
- 425.0
Population outlook (Indian River County) Hauer SSP2
- Today (2025)
- 165,104 people
- By 2030
- 172,869 · +4.7%
- By 2040
- 185,640 · +12.4%
- By 2050
- 194,465 · +17.8%
- By 2075
- 211,115 · +27.9%
- By 2100
- 211,781 · +28.3%
Race, ethnicity, and origin ACS 2023
- Neighborhood character
- Predominantly White (70%)
- Race & ethnicity
- White 70% Black 13% Hispanic / Latino 12% Two or more races 5% Native American 1%
- Hispanic origin (detail)
- Mexican 1% Puerto Rican 2% Cuban 1%
- Common ancestry
- Romanian 4% Lithuanian 4% Italian 3%
- Foreign-born
- 12% · Canada, Jamaica, Dominican Republic
- Languages at home
- 85% English-only · Spanish 9% Other Indo-European 2% French/Haitian/Cajun 1%
Political lean MEDSL · Indian River
- 2024 margin
- Strong R (+27.4) · D 36.0% · R 63.4%
- 2008→2024 swing
- -12.5pp toward R · 2008: -14.8pp · 2024: -27.4pp
- All cycles
- 2024: R+27.4 2020: R+21.6 2016: R+24.5 2012: R+22.3 2008: R+14.8
Not yet ingested
- Civics
- —
Market trends
- HPI YoY
- ▼ -182.13%
- Current HPI
- 333.3274
- Rent YoY
- ▲ 4.18%
- Metro
- Sebastian-Vero Beach, FL
- State GDP YoY
- ▲ 3.28%
- F500 in state
- 36
Industry mix (Fortune 500 HQ in FL)
| Industry | F500 HQs | Revenue |
|---|---|---|
| Industrial Technology | 2 | $29B |
|
||
| Insurance | 2 | $17B |
|
||
| Retail | 1 | $60B |
|
||
| Technology Distribution | 1 | $58B |
|
||
| Homebuilding | 1 | $35B |
|
||
| Technology Manufacturing | 1 | $35B |
|
||
Price history
+360.0% since first listed9 events — show timeline
- 2026-03-14 Contingent — ForSaleByOwner.com
- 2026-01-11 Relisted — ForSaleByOwner.com
- 2026-01-11 Price Changed $115,000 ForSaleByOwner.com
- 2025-12-28 Delisted — ForSaleByOwner.com
- 2025-09-19 Price Changed $128,000 ForSaleByOwner.com
- 2025-09-11 Listed $134,000 ForSaleByOwner.com
- 2025-08-09 Rental Removed $1,300 SHOWMOJO
- 2025-06-30 Listed for Rent $1,300 SHOWMOJO
- 2013-03-20 Sold (MLS) $25,000 RAIRCMLS
Cash-flow waterfall
monthlySold comps — $/sqft
last 12 mo · ≤1 miLoading sold comps…