31 6th St · Colonial Beach, VA
Flood risk 1/10 · Minimal
- FEMA flood zone
- X (unshaded)
- Chance of flooding over 30 yrs
- 0.0%
- Est. flood insurance / yr
- $507 – $1,088
Fire risk 2/10 · Minimal
- Est. fire insurance / yr
- $666 – $1,236
Heat risk 8/10 · Major
- Hot days now (above 108°F)
- 7 days/yr
- Hot days in 30 yrs
- 16 days/yr
Wind risk 6/10 · Moderate
- Chance of severe wind over 30 yrs
- 27.0%
Air-quality risk 2/10 · Minimal
- Unhealthy air days now
- 1 days/yr
- Unhealthy air days in 30 yrs
- 2 days/yr
Risk factors via First Street. Map © Google.
Why this score? — see what drove the B+ grade
The composite is a weighted blend of 9 inputs, each scored 0–100. Each bar is that input's sub-score; the figure is the points it added to the 100-point composite (weight × sub-score).
- Cash flow +29.8/30.0
- ARV discount +15.0/15.0
- DSCR +10.0/10.0
- 1% rule +8.4/10.0
- Schools +4.6/10.0
- Livability +3.0/5.0
- Rent growth +2.5/5.0
- Condition / age +2.2/5.0
- Appreciation +0.0/10.0
$160,000
🖨 Deal sheet 📄 Offer letter ✓ Due diligence
Listing remarks
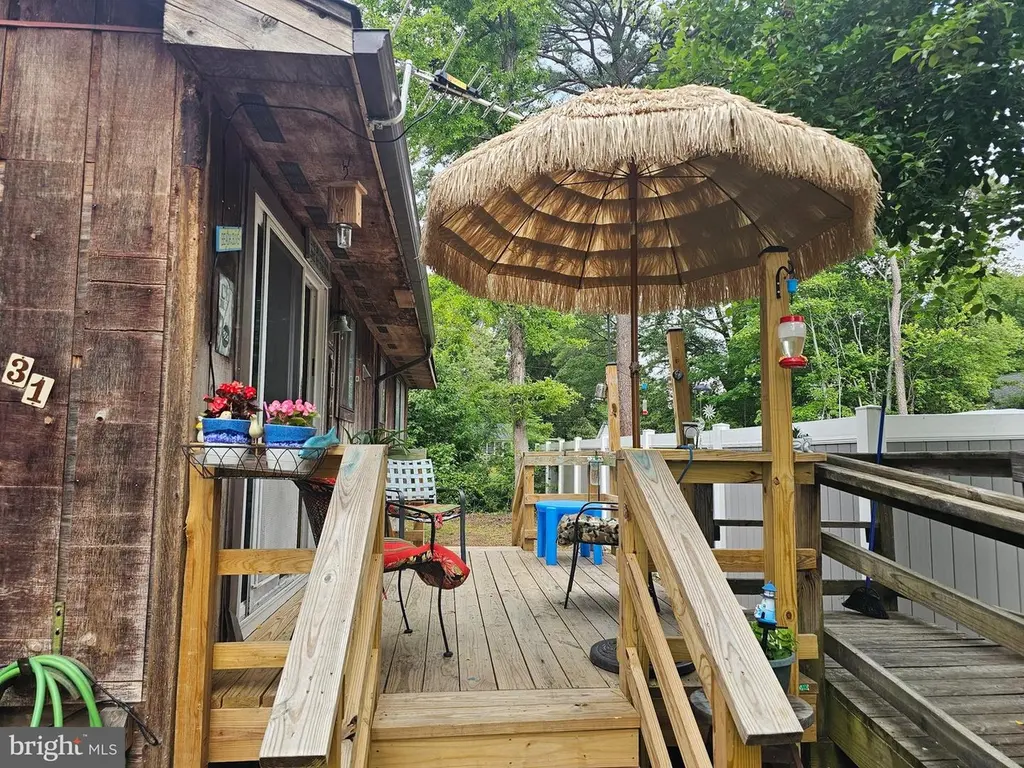
Opportunity awaits in the heart of Colonial Beach! This 3-bedroom, 1.5-bath fixer-upper is full of potential and ideally located just one block from the beautiful Potomac River. Enjoy the charm of this golf cart-friendly waterfront town with easy access to the town beach, fishing pier, marinas, restaurants, shopping, and year-round community events. A new deck adds outdoor living space perfect for relaxing or entertaining. Whether you're looking for an investment opportunity, vacation getaway, or project home to make your own, this property offers endless possibilities. Being sold AS IS. Due to the response on this property Best and Final offers are due no later than 5 pm on Saturday May 23
Key facts
- New deck
- Golf cart friendly
- Outdoor living space
Tags
Property features AI
Finance
- Other: Fee simple ownership; Main-level accessibility ramp
Exterior
- Parking: Gravel driveway with 2 driveway spaces (2 total garage/parking spaces)
- Utilities: Public water; Public sewer; Municipal trash service
- Home design: Detached property; Estimated year built
- Construction: Wood siding; Crawl space foundation
- Exterior features: Level lot; Deck(s); Above-grade other structures
Interior
- Kitchen: Refrigerator; Stove
- Bedrooms: Three bedrooms on the main level
- Flooring: Carpet
- Bathrooms: One full bathroom; One half bathroom
- Heating & cooling: Electric baseboard heating; Electric hot water
- Interior features: Open floor plan; Attic; Ceiling fans; Dining area; Master bath; Window treatments; Entry-level bedroom
- Laundry & utility: Washer in unit
Neighborhood map
What this means for you Summary
Snapshot
- This is a 3-bed/1.5-bath single-family listed at $160k. Condition is rated fair.
Deal economics
- At list price, monthly cash flow is $586 ($7k/yr) — positive.
- The deal already cash-flows at list — no discount required.
- Meets the 1% rule at list price ($2k rent vs $160k).
- Cap rate 10.7% vs local median 4.4% in Colonial Beach — top-decile yield for the area; either an underpriced asset or a hidden risk that comps aren't pricing in. Stress-test before assuming the spread holds.
Location & tenants
- Location reads 59/100 on livability (#460 in VA) — a working-class tenant base; expect higher turnover. Strengths: schools B, crime B, cost of living B; Watch: amenities F, commute F, health & safety F.
- Colonial Beach Public School District (town): math 42% / reading 68% proficiency, ranked #82 of 131 in VA (top 63%) — acceptable for families but not a draw, mixed tenant base, ~2y average lease.
- Market conditions: 197 active listings in the ZIP; 7 comparable units currently listed for rent nearby; rentals leasing fast (median 13d on market — plan ~1-2 weeks tenant-placement turnaround); 220 units permitted in Westmoreland County in 2024 (0 in 5+ unit buildings).
- This rent runs 40% of the median local income ($65k/yr) — at the standard rent-burdened threshold; future hikes will face affordability resistance.
Forward outlook
- Local home prices are declining (-3.0%/yr); year-one equity from $1k of loan paydown is wiped out by about $5k of value loss. Plan a longer hold.
- Westmoreland County population projected to shrink 7% by 2050 — rents likely to lag national; underwrite the cash flow, not the appreciation.
- At projected returns (-3.0% appreciation + 3.0% rent growth), your $45k cash investment doubles in ~8 years — after that, you're playing with house money.
Negotiation context
- Only 5 days on market — expect competitive offers; lowballing is unlikely to land.
Risks & watch-outs
- Climate carrying-cost: major wind risk, 27% chance of damaging wind over 30y; extreme-heat days projected 7→16/yr by 2055 (HVAC capex compounding) — expect insurance premiums to compound above CPI over the hold.
Questions for the listing agent
- Have any recent inspections been done? Can we get a copy of the seller's disclosures and any deferred-maintenance estimates?
- Built in 1978 — when were the roof, HVAC, electrical panel, plumbing, and water heater last replaced?
- Is there a deadline driving the sale (1031 exchange, divorce, estate, relocation)? That informs how much negotiation room exists.
- Schools are B-rated — typically a magnet for longer-tenancy family renters. What's the average tenant stay here, and is there a school-zone premium baked into asking?
- What's the average days-on-market for RENTAL listings here right now (not sales)? A rising rental-DOM trend means longer vacancies and softer asking-rent achievability than the comps imply.
- What's the recent tenant-quality profile in this submarket — average credit score on applications, eviction rate, late-payment / NSF rate, and stable-employment percentage? A property-management company in the area should have these aggregated.
- How much new for-sale + rental construction is in the pipeline within 1–3 miles? Heavy new supply typically softens prices + rents 12–24 months out; constrained supply supports both.
Investment metrics
- 1% rule
- 1.34% ✓
- Cap rate
- 10.69%
- Cash-on-cash
- 15.70%
- DSCR
- 1.70
- GRM
- 6.2
CMA / ARV
- ARV (on-the-fly)
- $301,600
- Comps found
- 12
Show comp detail 12 sales within ~0.75 mi
| Address | Dist | Beds/Ba | Sqft | Sold | Price | $/sf | Match |
|---|---|---|---|---|---|---|---|
| 114 5th St | 0.10mi | 3/1.0 | 975 (-6%) | 6mo | $294,000 | $302 | 78 |
| 26 11th St | 0.22mi | 2/1.0 (-1) | 1,060 (+2%) | 7mo | $150,000 | $142 | 74 |
| 150 5th | 0.17mi | 3/1.0 | 981 (-6%) | 15mo | $290,000 | $296 | 68 |
| 1115 Mckinney Blvd | 0.53mi | 3/2.0 | 1,022 (-2%) | 7mo | $289,999 | $284 | 65 |
| 119 1st St | 0.32mi | 3/1.0 | 962 (-8%) | 9mo | $279,000 | $290 | 64 |
| 126 5th St | 0.12mi | 3/2.0 | 1,120 (+8%) | 20mo | $310,000 | $277 | 63 |
| 418 Lincoln Ave | 0.48mi | 3/2.0 | 1,084 (+4%) | 13mo | $314,500 | $290 | 58 |
| 227 7th St | 0.27mi | 2/1.0 (-1) | 884 (-15%) | 2mo | $310,000 | $351 | 54 |
| 608 Kintz St | 0.49mi | 3/1.0 | 920 (-12%) | 5mo | $277,500 | $302 | 52 |
| 517 Billingsley | 0.53mi | 3/1.0 | 1,144 (+10%) | 8mo | $172,800 | $151 | 50 |
| 309 2nd St | 0.44mi | 3/1.0 | 928 (-11%) | 12mo | $269,500 | $290 | 50 |
| 310 Franklin St | 0.57mi | 3/1.0 | 912 (-12%) | 10mo | $250,000 | $274 | 43 |
Match score weights: distance 35% · size 25% · config 20% · recency 20%. Top-matched comps best support the ARV.
Projected returns pro-forma
-3.0% appreciation · 3.0% rent growth · sell at horizon
- IRR
- 6.5%
- Equity multiple
- 1.26×
- Total profit
- $11,432
- Equity at exit
- $23,857
- IRR
- 15.9%
- Equity multiple
- 2.30×
- Total profit
- $58,150
- Equity at exit
- $13,834
Cash invested: $44,800 (down + closing). Projections, not guarantees.
Landlord ↔ Tenant lean methodology
- Overall (STATE)
- 55 Moderately Landlord-Leaning
- State Virginia
- 55 Moderately Landlord-Leaning · D+2
- County
- — inherits STATE
- City
- — inherits STATE
ZIP-level market 22443
- Active inventory
- 197
- Price-to-rent
- 6.2×
Monthly cashflow live
- Estimated rent
- $2,142 high interval (Pro) →
- Mortgage (P&I)
- −$839
- Tax est. 1.5%
- −$200 /mo · $2,400/yr
- Insurance
- −$67
- HOA
- −$0
- Vacancy / Maint / Mgmt
- −$450
- Net cashflow
- $586
Break-even live
UW: 25.0% down · 7.5% · 30yr · 1.5% tax · 5.0% vac · 8.0% maint · 8.0% mgmt
Financing live
Cash to close
- Down payment
- $40,000
- Closing costs
- $4,800
- Reserves months
- —
- Total cash needed
- —
Loan-product check · same deal, 3 products live
Conventional
25% down · 7.5% · 30yr
- Down + closing
- —
- Monthly P&I
- —
- Monthly cashflow
- —
- DSCR
- —
- Eligible?
- —
Personal DTI + credit; lowest rate.
DSCR
20% down · 8.5% · 30yr
- Down + closing
- —
- Monthly P&I
- —
- Monthly cashflow
- —
- DSCR
- —
- Eligible?
- —
No personal income docs; deal must DSCR.
Hard money
10% down · 12.0% · 12mo
- Down + closing
- —
- Monthly P&I
- —
- Monthly cashflow
- —
- DSCR
- —
- Eligible?
- —
Short-term bridge; refi at stabilization.
Rent comps 7 comps
| Address | Beds | Baths | Sqft | Rent | $/sqft | DOM | Units | Dist |
|---|---|---|---|---|---|---|---|---|
| 343 12th St Colonial Beach, VA | 2.0 | 1.5 | 856 | $1,050 | $1.23 | 1d | 1 | 0.51mi |
| 520 Jackson St Colonial Beach, VA | 3.0 | 2.0 | 1200 | $2,900 | $2.42 | 11d | 1 | 0.56mi |
| 715 Washington Ave Colonial Beach, VA | 2.0 | 2.0 | 1100 | $2,200 | $2.00 | 12d | 1 | 0.58mi |
| 125 Lynnhaven Ct Colonial Beach, VA | 2.0 | 1.5 | 1160 | $1,950 | $1.68 | 14d | 1 | 0.87mi |
| 3214 Riverview Dr Colonial Beach, VA | 3.0 | 1.5 | 1248 | $2,150 | $1.72 | 12d | 1 | 0.90mi |
| 217 Mimosa Ave Colonial Beach, VA | 3.0 | 2.0 | 1060 | $1,895 | $1.79 | 23d | 1 | 0.96mi |
| 119 Cedar Ave Colonial Beach, VA | 2.0 | 1.0 | 832 | $1,600 | $1.92 | 12d | 1 | 1.03mi |
Listing history 1 events
-
2026-05-19$160,000 Active
ⓘ Source: listings_history table (triggers on properties + properties_extension) + one-shot
backfill from property_details.listing_events for pre-trigger history.
Climate risk First Street
- Flood 1/10 Low FEMA zone X (unshaded) · 0% chance over 30 yrs
- Wildfire 2/10 Low
- Heat 8/10 Severe 7 d/yr ≥108°F today · 16 d/yr by 30 yrs out
- Wind 6/10 Major 27% chance of damaging wind over 30 yrs
- Air quality 2/10 Low 1 unhealthy d/yr today · 2 by 30 yrs out
Nearby sold comps map
Loading sold comps map…
Walkable amenities ~0.75 mi
Loading nearby amenities…
Taxation est. · year 1
- Rental income
- $25,698
- − Mortgage interest
- −$8,962
- − Property taxes
- −$2,400
- − Insurance
- −$800
- − Repairs & maintenance
- −$2,056
- − Management
- −$2,056
- − Depreciation
- −$4,655
- Taxable income
- $4,769
- Est. tax owed @ 24.0%
- −$1,145
- After-tax cash flow
- $5,888/yr
For passive investors: Depreciation is non-cash, so a rental often shows a tax loss while cash-flowing — sheltering income. Rental losses are passive: they offset passive income freely, and up to $25,000/yr can offset ordinary (W-2) income if you actively participate and your MAGI is under $100k (phasing out to $0 by $150k); unused losses carry forward. On sale, claimed depreciation is recaptured at up to 25%, and gains may owe capital-gains tax (a 1031 exchange can defer both). Figures are a year-1 estimate at your 24.0% rate — not tax advice; consult a CPA.
Condition & rehab AI · 1 photo
This 3-bedroom fixer-upper in Colonial Beach, VA, offers potential for renovation and improvement. The property is in fair condition with significant repairs needed to the exterior and deck. Paint and minor repairs would greatly enhance its value.
Repairs flagged
- Major siding — Significant weathering
- Major deck — Worn and uneven
- Major interior walls — No photos, but likely in poor condition
Value-add opportunities
- Both paint exterior — Enhances curb appeal and value
- Both repair deck — Improves functionality and aesthetics
- Both replace worn flooring — Enhances comfort and value
- Both paint interior walls — Improves appearance and value
Renovation cost estimate screening
| Repair item | Severity | Est. cost |
|---|---|---|
| siding · Significant weathering | Major | $15,000–50,000 |
| deck · Worn and uneven | Major | $15,000–50,000 |
| interior walls · No photos, but likely in poor condition | Major | $15,000–50,000 |
| Total estimated repair cost · 3 items | $45,000–150,000 |
Value-add ROI direction
- Both paint exterior — Enhances curb appeal and value ↑
- Both repair deck — Improves functionality and aesthetics ↑
- Both replace worn flooring — Enhances comfort and value ↑
- Both paint interior walls — Improves appearance and value ↑
ⓘ Cost ranges are severity-bucket heuristics (US national rule-of-thumb). Get contractor quotes + a written scope before underwriting a rehab budget.
Schools (NCES district)
- District
- Colonial Beach Public School District
- NCES district ID
- 5100930
- Math proficiency
- 42% ▼ -35.00%
- Reading proficiency
- 68% ▼ -4.00%
- Median HH income
- $45,397
- Composite
- 46.38/100
- National rank
- #2459
- State rank
- #82 of 131 in VA
Livability — Colonial Beach
- Score
- 59/100
- State rank
- #460
- US rank
- #19615
Category grades
Schools grade is shown separately in the Schools card above.
Census & demographics
- Census place
- Colonial Beach, VA
- County
- Westmoreland County · 10,011 people
- City population
- 10,011
- Metro
- nan
- Population (ZIP)
- 10,011
- Household income
- $64,810
- Rent vs Own
- Severe rent burden
- 126.0
Population outlook (Westmoreland County) Hauer SSP2
- Today (2025)
- 17,643 people
- By 2030
- 17,520 · -0.7%
- By 2040
- 17,041 · -3.4%
- By 2050
- 16,397 · -7.1%
- By 2075
- 15,012 · -14.9%
- By 2100
- 12,917 · -26.8%
Race, ethnicity, and origin ACS 2023
- Neighborhood character
- Predominantly White (71%)
- Race & ethnicity
- White 71% Black 15% Two or more races 7% Hispanic / Latino 6% Asian 2%
- Hispanic origin (detail)
- Mexican 5%
- Common ancestry
- Slovak 2% Italian 2% Scotch-Irish 1%
- Foreign-born
- 3% · Canada
- Languages at home
- 96% English-only · Spanish 3%
Political lean MEDSL · Westmoreland
- 2024 margin
- R (+14.3) · D 42.4% · R 56.7%
- 2008→2024 swing
- -24.5pp toward R · 2008: 10.2pp · 2024: -14.3pp
- All cycles
- 2024: R+14.3 2020: R+8.2 2016: R+7.3 2012: D+0.5 2008: D+10.2
Not yet ingested
- Civics
- —
Market trends
- HPI YoY
- ▼ -127.23%
- Current HPI
- 152.1518
- Rent YoY
- —
- Metro
- nan
- State GDP YoY
- ▲ 2.40%
- F500 in state
- 50
Industry mix (Fortune 500 HQ in VA)
| Industry | F500 HQs | Revenue |
|---|---|---|
| Aerospace / Defense | 4 | $236B |
|
||
| Technology / Defense | 3 | $32B |
|
||
| Financial Services | 2 | $176B |
|
||
| Utilities | 2 | $27B |
|
||
| Insurance | 2 | $25B |
|
||
| Technology | 2 | $15B |
|
||
Price history
1 event — show timeline
- 2026-05-19 Listed $160,000 BRIGHT MLS
Cash-flow waterfall
monthlySold comps — $/sqft
last 12 mo · ≤1 miLoading sold comps…