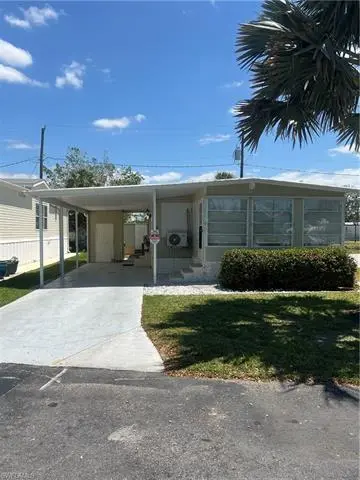
777 Walkerbilt Rd #9 · Naples Park, FL
Flood risk 10/10 · Severe
- FEMA flood zone
- AE
- Chance of flooding over 30 yrs
- 0.99%
- Est. flood insurance / yr
- $1,737 – $8,500
Fire risk 1/10 · Minimal
- Est. fire insurance / yr
- $947 – $1,759
Heat risk 10/10 · Severe
- Hot days now (above 107°F)
- 7 days/yr
- Hot days in 30 yrs
- 29 days/yr
Wind risk 10/10 · Severe
- Chance of severe wind over 30 yrs
- 99.0%
Air-quality risk 2/10 · Minimal
- Unhealthy air days now
- 1 days/yr
- Unhealthy air days in 30 yrs
- 1 days/yr
Risk factors via First Street. Map © Google.
Why this score? — see what drove the B grade
The composite is a weighted blend of 9 inputs, each scored 0–100. Each bar is that input's sub-score; the figure is the points it added to the 100-point composite (weight × sub-score).
- Cash flow +30.0/30.0
- 1% rule +10.0/10.0
- DSCR +10.0/10.0
- ARV discount +7.5/15.0
- Schools +5.0/10.0
- Livability +3.2/5.0
- Condition / age +2.5/5.0
- Rent growth +2.2/5.0
- Appreciation +0.0/10.0
$190,000
🖨 Deal sheet (PDF) 📄 Offer letter ✓ Due diligence
Listing remarks
Don’t miss this incredible opportunity to own your own piece of paradise! This charming two-bedroom, two-bath home offers comfort, warmth, and coastal living at its finest. Located in a peaceful 55+ community, you’ll enjoy direct water access to the Gulf, making it a true boater’s dream. The community features amenities like shuffleboard, a dedicated area for boat trailer parking, and even your own private slip. Just minutes from Barefoot Beach, you can soak up the sun and embrace the coastal lifestyle every day. Take in breathtaking sunset views, stroll to the nearby Bay House, or enjoy the convenience of being right next door to the Perry Hotel. Whether you’re look
Key facts
- Private slip
- Boat trailer parking
- Direct water access
Tags
Property features AI
Finance
- Other: Property is in a mobile home park; no commercial use allowed
- HOA & community: Mandatory HOA with professional management; Monthly HOA fee of $303 (total annual recurring fees $3,636); HOA maintenance includes lawn/land maintenance, recreation facilities, and street lights; Community amenities: bocce court, community boat ramp and slip, community gulf boat access, fishing pier, shuffleboard, streetlight; Community types: boating, mobile/manufactured, non-gated
Exterior
- Parking: Covered attached carport (1 space)
- Utilities: Central water; Central sewer; Cable available
- Home design: Manufactured residential home; Single-story; Zero lot line; Rear exposure facing east; Located in Riverbend Mobile Home Park (Lot/Unit 9)
- Construction: Manufactured construction; Built in 1975; See remarks for building description
- Exterior features: Storage; Shingle roof; Single-hung windows; Aluminum siding; Storm protection (see remarks)
Interior
- Kitchen: Electric cooktop; Dishwasher; Refrigerator
- Bedrooms: 2 bedrooms
- Flooring: Laminate flooring
- Bathrooms: 2 full bathrooms; Master bathroom with shower (no tub)
- Heating & cooling: Central electric cooling; Heating: see remarks
- Interior features: Smoke detectors; Partially furnished
Neighborhood map
What this means for you Summary
Snapshot
- This is a 2-bed/2.0-bath manufactured listed at $190k.
Deal economics
- At list price, monthly cash flow is $1k ($16k/yr) — positive.
- The deal already cash-flows at list — no discount required.
- Meets the 1% rule at list price ($4k rent vs $190k).
- Recommended offer: $184k (3.0% below list) — sets the bar for market timing.
Location & tenants
- Location reads 64/100 on livability (#696 in FL) — a middle-class / working-renter tenant base. Strengths: crime A+, housing A-, employment B+; Watch: health & safety D, schools F, amenities F.
- Collier (suburban): math 60% / reading 56% proficiency, ranked #16 of 73 in FL (top 22%) — acceptable for families but not a draw, mixed tenant base, ~2y average lease.
- Market conditions: Rents soft (-1.1%/yr); 595 active listings in the ZIP; 40 comparable units currently listed for rent nearby; rentals at typical pace (median 25d on market — plan ~3-4 weeks tenant-placement turnaround); solid renter incomes; 3,520 units permitted in Collier County in 2024 (959 in 5+ unit buildings).
- At $4,106/mo this rent would consume 50% of the median local household income ($98k/yr) (locally 1006% of renters already pay >50% of income on rent) — very limited rent-growth headroom before tenants either downsize or default.
Forward outlook
- Local home prices are declining (-3.0%/yr); year-one equity from $1k of loan paydown is wiped out by about $6k of value loss. Plan a longer hold.
- Collier County population projected at +30% by 2050 — long-run rental-demand tailwind backs the buy-and-hold thesis.
- At projected returns (-3.0% appreciation + 0.0% rent growth), your $53k cash investment doubles in ~5 years — after that, you're playing with house money.
Negotiation context
- It's been on market 46 days — a 3% lower offer ($184k) is reasonable based on typical stale-listing flexibility.
- 5 sale attempts with the ask held roughly flat each time — persistent listings suggest the price (not the market) is what's stuck; bring a comps-based counter.
- Current owner paid $70k; list at $190k implies a 171% gain — meaningful room to come down on a strong offer.
Risks & watch-outs
- Watch-outs: flood insurance adds $427/mo.
- Climate carrying-cost: in FEMA flood zone AE (mandatory federal flood insurance); severe wind risk, 99% chance of damaging wind over 30y; extreme-heat days projected 7→29/yr by 2055 (HVAC capex compounding) — expect insurance premiums to compound above CPI over the hold.
Questions for the listing agent
- It's been on market 46 days. Have you received any prior offers? Is the seller open to a 3% concession, seller financing, or rate buy-down credit?
- Built in 1975 — when were the roof, HVAC, electrical panel, plumbing, and water heater last replaced?
- What's the actual annual flood-insurance premium (NFIP or private), and is the property in a SFHA with mandatory coverage?
- What does the HOA fee cover, when was the last increase, and are there any pending special assessments or reserve-fund shortfalls?
- Is there a deadline driving the sale (1031 exchange, divorce, estate, relocation)? That informs how much negotiation room exists.
- Schools are F-rated, which usually means shorter tenancies and higher turnover. Who's the typical renter profile here, and what's been the actual vacancy rate?
- What's the average days-on-market for RENTAL listings here right now (not sales)? A rising rental-DOM trend means longer vacancies and softer asking-rent achievability than the comps imply.
- What's the recent tenant-quality profile in this submarket — average credit score on applications, eviction rate, late-payment / NSF rate, and stable-employment percentage? A property-management company in the area should have these aggregated.
- How much new for-sale + rental construction is in the pipeline within 1–3 miles? Heavy new supply typically softens prices + rents 12–24 months out; constrained supply supports both.
Investment metrics
- 1% rule
- 2.16% ✓
- Cap rate
- 17.44%
- Cash-on-cash
- 39.82%
- DSCR
- 2.77
- GRM
- 3.9
CMA / ARV
No comps found within radius.
Projected returns pro-forma
-3.0% appreciation · 0.0% rent growth · sell at horizon
- IRR
- 20.7%
- Equity multiple
- 1.81×
- Total profit
- $42,875
- Equity at exit
- $28,330
- IRR
- 26.3%
- Equity multiple
- 2.92×
- Total profit
- $102,362
- Equity at exit
- $16,428
Cash invested: $53,200 (down + closing). Projections, not guarantees.
Landlord ↔ Tenant lean methodology
- Overall (STATE)
- 87 Strongly Landlord-Friendly
- State Florida
- 87 Strongly Landlord-Friendly · R+3
- County
- — inherits STATE
- City
- — inherits STATE
ZIP-level market 34110
- Rents YoY
- -1.1%
- Active inventory
- 595
- Price-to-rent
- 3.9×
Monthly cashflow live
- Estimated rent
- $4,106 high interval (Pro) →
- Mortgage (P&I)
- −$996
- Tax from tax record
- −$100 /mo · $1,195/yr
- Insurance
- −$79
- Flood insurance flood zone
- −$427 /mo · $5,118/yr
- HOA
- −$303
- Vacancy / Maint / Mgmt
- −$862
- Net cashflow
- $1,339
Break-even live
Sensitivity live
| Price | -10% $1,446 | -5% $1,393 | +0% $1,339 | +5% $1,285 | +10% $1,231 |
|---|---|---|---|---|---|
| Rent | -10% $1,014 | -5% $1,177 | +0% $1,339 | +5% $1,501 | +10% $1,663 |
| Rate | -1.0pp $1,434 | -0.5pp $1,387 | base $1,339 | +0.5pp $1,290 | +1.0pp $1,239 |
UW: 25.0% down · 7.5% · 30yr · 1.5% tax · 5.0% vac · 8.0% maint · 8.0% mgmt
Financing live
Cash to close
- Down payment
- $47,500
- Closing costs
- $5,700
- Reserves months
- —
- Total cash needed
- —
Loan-product check · same deal, 3 products live
Conventional
25% down · 7.5% · 30yr
- Down + closing
- —
- Monthly P&I
- —
- Monthly cashflow
- —
- DSCR
- —
- Eligible?
- —
Personal DTI + credit; lowest rate.
DSCR
20% down · 8.5% · 30yr
- Down + closing
- —
- Monthly P&I
- —
- Monthly cashflow
- —
- DSCR
- —
- Eligible?
- —
No personal income docs; deal must DSCR.
Hard money
10% down · 12.0% · 12mo
- Down + closing
- —
- Monthly P&I
- —
- Monthly cashflow
- —
- DSCR
- —
- Eligible?
- —
Short-term bridge; refi at stabilization.
Rent comps 40 comps
| Address | Beds | Baths | Sqft | Rent | $/sqft | DOM | Units | Dist |
|---|---|---|---|---|---|---|---|---|
| 706 111th Ave N Naples, FL | 2.0 | 2.0 | 1080 | $1,850 | $1.71 | 24d | 1 | 0.63mi |
| 699 110th Ave N Unit B Naples, FL | 2.0 | 2.0 | 910 | $2,250 | $2.47 | 24d | 1 | 0.66mi |
| 699 110th Ave N Unit A Naples, FL | 2.0 | 1.0 | 1000 | $2,150 | $2.15 | 24d | 1 | 0.66mi |
| 602 111th Ave N Naples, FL | 2.0 | 2.0 | 1104 | $4,000 | $3.62 | 24d | 1 | 0.73mi |
| 746 109th Ave N Naples, FL | 2.0 | 1.0 | 850 | $1,895 | $2.23 | 24d | 1 | 0.73mi |
| 800 108th Ave N Unit 1534808P Naples, FL | 2.0 | 2.0 | 914 | $5,897 | $6.45 | 15d | 1 | 0.81mi |
| 778 107th Ave N Unit B Naples, FL | 2.0 | 1.0 | 588 | $1,750 | $2.98 | 24d | 1 | 0.86mi |
| 829 107th Ave N Unit 1 Naples, FL | 2.0 | 2.0 | 1000 | $2,200 | $2.20 | 24d | 1 | 0.87mi |
| 564 109th Ave N Naples, FL | 2.0 | 2.0 | 1080 | $16,000 | $14.81 | 24d | 1 | 0.89mi |
| 826 Wiggins Pass Rd #201 Naples, FL | 1.0 | 1.0 | 570 | $1,400 | $2.46 | 24d | 1 | 0.89mi |
| 830 Wiggins Pass Rd #10 Naples, FL | 1.0 | 1.0 | 800 | $1,350 | $1.69 | 24d | 1 | 0.89mi |
| 12945 Vanderbilt Dr Naples, FL | 2.0 | 2.0 | 1301 | $5,250 | $4.04 | 24d | 2 | 0.90mi |
| 527 109th Ave N Naples, FL | 2.0 | 2.0 | 990 | $2,750 | $2.78 | 24d | 1 | 0.91mi |
| 10580 6th St Naples, FL | 2.0 | 1.0 | 1000 | $2,300 | $2.30 | 24d | 1 | 1.00mi |
| 650 103rd Ave N Naples, FL | 3.0 | 2.0 | 1025 | $2,700 | $2.63 | 24d | 1 | 1.14mi |
| 751 100th Ave N Naples, FL | 2.0 | 1.0 | 912 | $4,000 | $4.39 | 24d | 1 | 1.26mi |
| 5 Bluebill Ave #103 Naples, FL | 1.0 | 1.0 | 809 | $2,750 | $3.40 | 24d | 1 | 1.27mi |
| 5 Bluebill Ave #209 Naples, FL | 2.0 | 2.0 | 1076 | $8,500 | $7.90 | 24d | 1 | 1.27mi |
| 5 Bluebill Ave #104 Naples, FL | 1.0 | 1.0 | 817 | $5,000 | $6.12 | 24d | 1 | 1.27mi |
| 5 Bluebill Ave #504 Naples, FL | 1.0 | 1.0 | 896 | $7,000 | $7.81 | 24d | 1 | 1.27mi |
| 5 Bluebill Ave Unit 505/605 Naples, FL | 2.0 | 2.5 | 1035 | $6,500 | $6.28 | 24d | 1 | 1.27mi |
| 5 Bluebill Ave Unit 303-1 Naples, FL | 2.0 | 2.0 | 1068 | $6,500 | $6.09 | 24d | 1 | 1.27mi |
| 5 Bluebill Ave #210 Naples, FL | 1.0 | 1.0 | 812 | $6,000 | $7.39 | 24d | 1 | 1.27mi |
| 5 Bluebill Ave Unit 108s Naples, FL | 1.0 | 1.0 | 859 | $4,995 | $5.81 | 24d | 1 | 1.27mi |
| 5 Bluebill Ave Unit 108A Naples, FL | 1.0 | 1.0 | 859 | $1,995 | $2.32 | 24d | 1 | 1.27mi |
| 5 Bluebill Ave #403 Naples, FL | 2.0 | 2.0 | 1086 | $8,500 | $7.83 | 22d | 1 | 1.27mi |
| 3 Bluebill Ave #610 Naples, FL | 1.0 | 1.0 | 810 | $5,000 | $6.17 | 24d | 1 | 1.28mi |
| 3 Bluebill Ave #303 Naples, FL | 2.0 | 2.0 | 1071 | $8,000 | $7.47 | 22d | 1 | 1.28mi |
| 663 100th Ave N Naples, FL | 2.0 | 1.0 | 1000 | $2,650 | $2.65 | 24d | 1 | 1.28mi |
| 1 Bluebill Ave #412 Naples, FL | 2.0 | 2.0 | 1050 | $8,000 | $7.62 | 24d | 1 | 1.29mi |
| 1 Bluebill Ave #210 Naples, FL | 2.0 | 2.0 | 1040 | $5,900 | $5.67 | 24d | 1 | 1.29mi |
| 1 Bluebill Ave #709 Naples, FL | 1.0 | 1.0 | 800 | $6,000 | $7.50 | 24d | 1 | 1.29mi |
| 1 Bluebill Ave #703 Naples, FL | 1.0 | 1.0 | 800 | $7,000 | $8.75 | 24d | 1 | 1.29mi |
| 1 Bluebill Ave #501 Naples, FL | 1.0 | 1.0 | 768 | $2,095 | $2.73 | 24d | 1 | 1.29mi |
| 1 Bluebill Ave #707 Naples, FL | 1.0 | 1.0 | 1040 | $6,500 | $6.25 | 24d | 1 | 1.29mi |
| 1 Bluebill Ave Naples, FL | 2.0 | 2.0 | 1051 | $7,500 | $7.14 | 24d | 1 | 1.29mi |
| 547 101st Ave N Naples, FL | 2.0 | 1.0 | 768 | $2,750 | $3.58 | 24d | 1 | 1.31mi |
| 953 Bunker Hill Dr Naples, FL | 2.0 | 2.0 | 1100 | $3,200 | $2.91 | 15d | 1 | 1.31mi |
| 536 101st Ave N Naples, FL | 3.0 | 1.0 | 1016 | $2,500 | $2.46 | 15d | 1 | 1.34mi |
| 10686 Gulf Shore Dr Unit A-104 Naples, FL | 2.0 | 2.0 | 1107 | $8,000 | $7.23 | 15d | 1 | 1.35mi |
HOA detail
- Monthly dues
- $303 · $3,636/yr
- Likely covers
- water
Listing history 28 events
-
2026-06-21days on market $190,000 Active 46 DOM
-
2026-06-18days on market $190,000 Active 43 DOM
-
2026-06-17days on market $190,000 Active 42 DOM
-
2026-06-16days on market $190,000 Active 41 DOM
-
2026-06-15days on market $190,000 Active 40 DOM
-
2026-06-14days on market $190,000 Active 38 DOM
-
2026-06-10days on market $190,000 Active 35 DOM
-
2026-06-09days on market $190,000 Active 34 DOM
-
2026-06-08days on market $190,000 Active 33 DOM
-
2026-06-07days on market $190,000 Active 32 DOM
-
2026-06-03days on market $190,000 Active 28 DOM
-
2026-06-02days on market $190,000 Active 27 DOM
-
2026-06-01days on market $190,000 Active 26 DOM
-
2026-05-31days on market $190,000 Active 25 DOM
-
2026-05-30days on market $190,000 Active 24 DOM
-
2026-05-08price $1,600
-
2026-05-06$190,000 Active
-
2026-05-02historical
-
2026-04-21$1,800
-
2026-04-15historical $1,800
-
2026-03-18price $225,000
-
2026-02-13$1,800
-
2026-02-13historical $1,800
-
2025-10-22price $259,000
-
2025-05-05$269,000 Active
-
2025-04-24$1,800
-
2024-01-05soldstatus $70,000
-
1995-01-01soldstatus $22,000
ⓘ Source: listings_history table (triggers on properties + properties_extension) + one-shot
backfill from property_details.listing_events for pre-trigger history.
Tax reassessment forecast FL · Resets to sale price
- Current annual tax
- $1,195 · $100/mo
- Projected year-2 tax
- $1,577 · $131/mo
- Expected delta
- +$382/yr (+$32/mo · 32.0%)
ⓘ Screening estimate from a state-policy table — verify with the county assessor before closing.
Climate risk First Street
- Flood 10/10 Extreme FEMA zone AE · 99% chance over 30 yrs
- Wildfire 1/10 Low
- Heat 10/10 Extreme 7 d/yr ≥107°F today · 29 d/yr by 30 yrs out
- Wind 10/10 Extreme 99% chance of damaging wind over 30 yrs
- Air quality 2/10 Low 1 unhealthy d/yr today · 1 by 30 yrs out
Nearby sold comps map
Loading sold comps map…
Walkable amenities ~0.75 mi
Loading nearby amenities…
Taxation est. · year 1
- Rental income
- $49,268
- − Mortgage interest
- −$10,643
- − Property taxes
- −$1,195
- − Insurance
- −$6,068
- − Repairs & maintenance
- −$3,941
- − Management
- −$3,941
- − HOA
- −$3,636
- − Depreciation
- −$5,527
- Taxable income
- $14,315
- Est. tax owed @ 24.0%
- −$3,436
- After-tax cash flow
- $12,630/yr
For passive investors: Depreciation is non-cash, so a rental often shows a tax loss while cash-flowing — sheltering income. Rental losses are passive: they offset passive income freely, and up to $25,000/yr can offset ordinary (W-2) income if you actively participate and your MAGI is under $100k (phasing out to $0 by $150k); unused losses carry forward. On sale, claimed depreciation is recaptured at up to 25%, and gains may owe capital-gains tax (a 1031 exchange can defer both). Figures are a year-1 estimate at your 24.0% rate — not tax advice; consult a CPA.
Schools (NCES district)
- District
- Collier
- NCES district ID
- 1200330
- Math proficiency
- 60% ▼ -4.00%
- Reading proficiency
- 56% ▼ -2.00%
- Median HH income
- $58,275
- Composite
- 50.23/100
- National rank
- #1892
- State rank
- #16 of 73 in FL
Livability — Naples Park
- Score
- 64/100
- State rank
- #696
- US rank
- #14564
Category grades
Schools grade is shown separately in the Schools card above.
Census & demographics
- County
- Collier County · 396,295 people
- Metro
- Naples-Marco Island, FL
- Population (ZIP)
- 25,630
- Household income
- $97,564
- Rent vs Own
- Severe rent burden
- 1006.0
Population outlook (Collier County) Hauer SSP2
- Today (2025)
- 420,858 people
- By 2030
- 450,054 · +6.9%
- By 2040
- 502,232 · +19.3%
- By 2050
- 544,932 · +29.5%
- By 2075
- 627,203 · +49.0%
- By 2100
- 659,015 · +56.6%
Race, ethnicity, and origin ACS 2023
- Neighborhood character
- Predominantly White (84%)
- Race & ethnicity
- White 84% Hispanic / Latino 10% Two or more races 9% Asian 2% Black 1%
- Hispanic origin (detail)
- Mexican 2% Puerto Rican 1% Cuban 3%
- Common ancestry
- Romanian 4% Lithuanian 3% Slovak 2%
- Foreign-born
- 11% · Canada, South Korea
- Languages at home
- 87% English-only · Spanish 7% Other Indo-European 3% French/Haitian/Cajun 1%
Political lean MEDSL · Collier
- 2024 margin
- Solid R (+33.1) · D 33.1% · R 66.2%
- 2008→2024 swing
- -10.6pp toward R · 2008: -22.5pp · 2024: -33.1pp
- All cycles
- 2024: R+33.1 2020: R+24.7 2016: R+26.0 2012: R+30.1 2008: R+22.5
Not yet ingested
- Civics
- —
Market trends
- HPI YoY
- ▼ -172.68%
- Current HPI
- 267.4644
- Rent YoY
- ▼ -1.06%
- Metro
- Naples-Marco Island, FL
- State GDP YoY
- ▲ 3.28%
- F500 in state
- 36
Industry mix (Fortune 500 HQ in FL)
| Industry | F500 HQs | Revenue |
|---|---|---|
| Industrial Technology | 2 | $29B |
|
||
| Insurance | 2 | $17B |
|
||
| Retail | 1 | $60B |
|
||
| Technology Distribution | 1 | $58B |
|
||
| Homebuilding | 1 | $35B |
|
||
| Technology Manufacturing | 1 | $35B |
|
||
Price history
-92.7% since first listed13 events — show timeline
- 2026-05-08 Price Changed $1,600 NAPLESMLS
- 2026-05-06 Listed $190,000 NAPLESMLS
- 2026-05-02 Listing Removed — NAPLESMLS
- 2026-04-21 Listed for Rent $1,800 NAPLESMLS
- 2026-04-15 Rental Removed $1,800 FGCMLS
- 2026-03-18 Price Changed $225,000 NAPLESMLS
- 2026-02-13 Listed for Rent $1,800 FGCMLS
- 2026-02-13 Rental Removed $1,800 NAPLESMLS
- 2025-10-22 Price Changed $259,000 NAPLESMLS
- 2025-05-05 Listed $269,000 NAPLESMLS
- 2025-04-24 Listed for Rent $1,800 NAPLESMLS
- 2024-01-05 Sold (Public Records) $70,000 Public Records
- 1995-01-01 Sold (Public Records) $22,000 Public Records
Property tax history
+12.6%/yrLatest (2025): $1,195 · +0.2% YoY. Source: county tax records.
Cash-flow waterfall
monthlySold comps — $/sqft
last 12 mo · ≤1 miLoading sold comps…