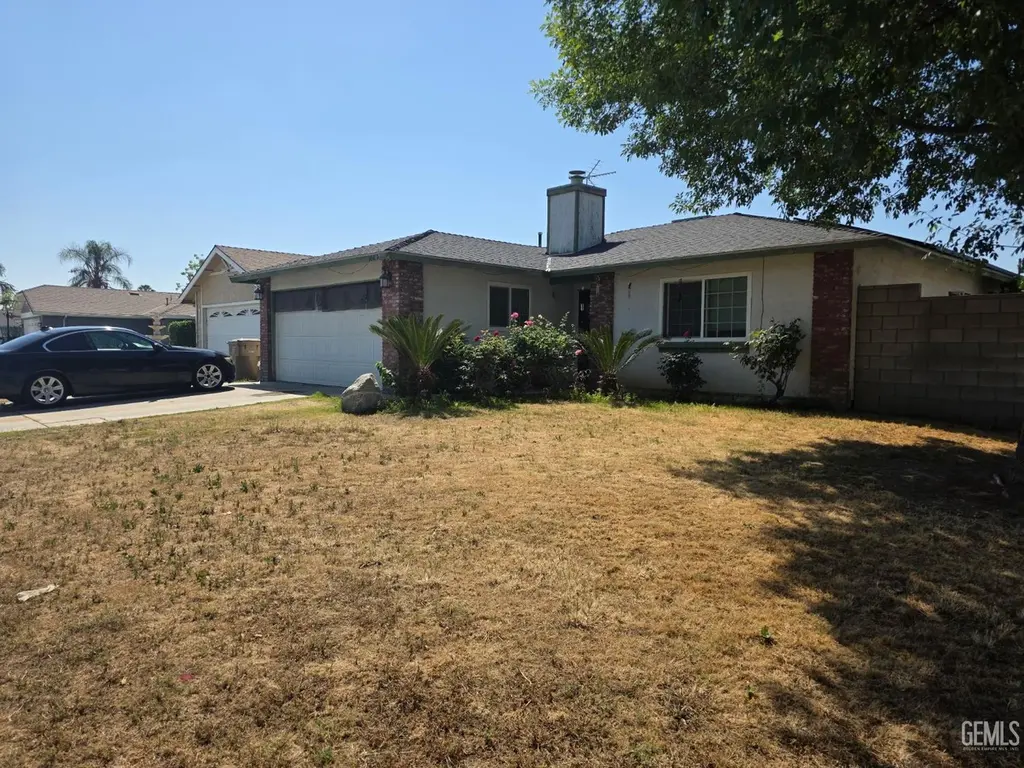
1009 Fairview Rd · Bakersfield, CA
Flood risk 1/10 · Minimal
- FEMA flood zone
- X (unshaded)
- Chance of flooding over 30 yrs
- 0.0%
- Est. flood insurance / yr
- $507 – $1,088
Fire risk 4/10 · Minor
- Est. fire insurance / yr
- $659 – $1,223
Heat risk 8/10 · Major
- Hot days now (above 105°F)
- 7 days/yr
- Hot days in 30 yrs
- 18 days/yr
Wind risk 1/10 · Minimal
- Chance of severe wind over 30 yrs
- —
Air-quality risk 10/10 · Severe
- Unhealthy air days now
- 33 days/yr
- Unhealthy air days in 30 yrs
- 37 days/yr
Risk factors via First Street. Map © Google.
Why this score? — see what drove the D grade
The composite is a weighted blend of 9 inputs, each scored 0–100. Each bar is that input's sub-score; the figure is the points it added to the 100-point composite (weight × sub-score).
- ARV discount +14.4/15.0
- Cash flow +10.1/30.0
- Rent growth +3.9/5.0
- Schools +3.4/10.0
- DSCR +2.9/10.0
- Livability +2.9/5.0
- Condition / age +2.5/5.0
- 1% rule +2.4/10.0
- Appreciation +0.0/10.0
$277,777
🖨 Deal sheet (PDF) 📄 Offer letter ✓ Due diligence
Listing remarks MLS
Nice home located on a coner lot in move in condition. Brand new carpet and tile in kitchen and bathrooms. Bring me an offer today this one is in great condition.
Key facts
- Near schools
- Convenient location
- Spacious driveway
Tags
Property features AI
Exterior
- Parking: 2-car garage
- Utilities: Public water; Sewer
- Home design: Residential single-family (R1 zoning)
- Construction: Composition roof; Slab foundation
- Exterior features: Uncovered slab patio; Front and rear automatic sprinklers; Corner lot
Interior
- Kitchen: Dishwasher
- Bathrooms: 2 full bathrooms
- Heating & cooling: Central heating; Central air conditioning
- Interior features: Great room; Breakfast area; Fireplace; Dishwasher; Central A/C; Central heating
Neighborhood map
What this means for you Summary
Snapshot
- This is a 3-bed/2.0-bath single-family listed at $278k.
Deal economics
- At list price, monthly cash flow is $-163 ($-2k/yr) — negative.
- To cash-flow at today's rent, offer at most $249k (10.3% below list).
- To meet the 1% rule (rent ≥ 1% of price), the offer needs to be $204k (26.4% below list).
- Recommended offer: $204k (26.4% below list) — sets the bar for 1% rule.
- Cap rate 5.6% vs local median 3.6% in Bakersfield — top-decile yield for the area; either an underpriced asset or a hidden risk that comps aren't pricing in. Stress-test before assuming the spread holds.
Location & tenants
- Location reads 58/100 on livability (#716 in CA) — a working-class tenant base; expect higher turnover. Strengths: housing A+; Watch: health & safety D, crime F, amenities F.
- Kern High (urban): math 21% / reading 51% proficiency, ranked #860 of 1,400 in CA (top 61%) — families likely to look elsewhere, expect single-tenant / working-renter base with shorter leases.
- Zoned schools: Golden Valley High (reading 77%, 2,533 students, 91% FRL).
- Market conditions: Rents rising fast (+5.7%/yr); 314 active listings in the ZIP; 28 comparable units currently listed for rent nearby; rentals leasing fast (median 5d on market — plan ~1-2 weeks tenant-placement turnaround); 3,244 units permitted in Kern County in 2024 (73 in 5+ unit buildings).
- This rent runs 43% of the median local income ($56k/yr) — at the standard rent-burdened threshold; future hikes will face affordability resistance.
Forward outlook
- Local home prices are declining (-3.0%/yr); year-one equity from $2k of loan paydown is wiped out by about $8k of value loss. Plan a longer hold.
- Kern County population projected at +17% by 2050 — long-run rental-demand tailwind backs the buy-and-hold thesis.
Negotiation context
- It's been on market 53 days — a 3% lower offer ($269k) is reasonable based on typical stale-listing flexibility.
- 4 sale attempts since 26y ago with the ask held roughly flat each time — persistent listings suggest the price (not the market) is what's stuck; bring a comps-based counter.
- Current owner paid $115k; list at $278k implies a 142% gain — meaningful room to come down on a strong offer.
Risks & watch-outs
- Climate carrying-cost: extreme-heat days projected 7→18/yr by 2055 (HVAC capex compounding) — expect insurance premiums to compound above CPI over the hold.
Questions for the listing agent
- What do current leases actually rent for vs. the listed asking? Can we see a recent rent roll and the last 12 months of T-12 income?
- It's been on market 53 days. Have you received any prior offers? Is the seller open to a 26% concession, seller financing, or rate buy-down credit?
- Is there a deadline driving the sale (1031 exchange, divorce, estate, relocation)? That informs how much negotiation room exists.
- Schools are D-rated, which usually means shorter tenancies and higher turnover. Who's the typical renter profile here, and what's been the actual vacancy rate?
- Crime grade is F in this area — have there been break-ins, vandalism, or insurance claims at this property in the last 3 years? What carrier currently insures it and at what premium?
- The area grade is low — what's the realistic commute time and amenity access for the typical tenant pool here? Any planned neighborhood developments (good or bad) we should know about?
- What's the average days-on-market for RENTAL listings here right now (not sales)? A rising rental-DOM trend means longer vacancies and softer asking-rent achievability than the comps imply.
- What's the recent tenant-quality profile in this submarket — average credit score on applications, eviction rate, late-payment / NSF rate, and stable-employment percentage? A property-management company in the area should have these aggregated.
- How much new for-sale + rental construction is in the pipeline within 1–3 miles? Heavy new supply typically softens prices + rents 12–24 months out; constrained supply supports both.
Investment metrics
- 1% rule
- 0.74% ✗
- Cap rate
- 5.59%
- Cash-on-cash
- -2.51%
- DSCR
- 0.89
- GRM
- 11.3
CMA / ARV
- ARV (median comp)
- $327,834
- List price
- $277,777
- Delta
- -15.27%
- Verdict
- UNDERPRICED
- Comps
- 20 within 1.0 mi
Show comp detail 12 sales within ~0.75 mi
| Address | Dist | Beds/Ba | Sqft | Sold | Price | $/sf | Match |
|---|---|---|---|---|---|---|---|
| 5817 Osborne Ct | 0.14mi | 4/2.0 (+1) | 1,231 (-2%) | 1mo | $308,000 | $250 | 84 |
| 1001 Giuseppe Ct | 0.06mi | 3/2.0 | 1,160 (-8%) | 1mo | $335,000 | $289 | 82 |
| 5813 Lenz Ct | 0.17mi | 3/2.0 | 1,171 (-7%) | 4mo | $355,000 | $303 | 77 |
| 6500 Finch Way | 0.51mi | 3/2.0 | 1,286 (+2%) | 1mo | $282,000 | $219 | 72 |
| 5217 Stancliff | 0.43mi | 3/2.0 | 1,200 (-5%) | 2mo | $325,000 | $271 | 70 |
| 5804 Chandler Way | 0.23mi | 3/2.0 | 1,401 (+11%) | 2mo | $245,000 | $175 | 69 |
| 402 El Fuerte Ave | 0.68mi | 3/2.0 | 1,252 (-1%) | 1mo | $250,000 | $200 | 66 |
| 1304 Santiago Ct | 0.22mi | 3/2.5 | 1,414 (+12%) | 2mo | $320,000 | $226 | 66 |
| 5817 Gary | 0.74mi | 3/2.0 | 1,262 (-0%) | 2mo | $315,000 | $250 | 63 |
| 6810 Lowry St | 0.73mi | 3/2.0 | 1,337 (+6%) | 1mo | $330,000 | $247 | 55 |
| 2012 Butterfield | 0.69mi | 3/2.0 | 1,388 (+10%) | 4mo | $340,000 | $245 | 48 |
| 1900 Faxon Ave | 0.73mi | 4/2.0 (+1) | 1,405 (+11%) | 3mo | $350,000 | $249 | 40 |
Match score weights: distance 35% · size 25% · config 20% · recency 20%. Top-matched comps best support the ARV.
Projected returns pro-forma
-3.0% appreciation · 5.71% rent growth · sell at horizon
- IRR
- -17.7%
- Equity multiple
- 0.36×
- Total profit
- $-49,708
- Equity at exit
- $41,417
- IRR
- -5.7%
- Equity multiple
- 0.59×
- Total profit
- $-32,037
- Equity at exit
- $24,017
Cash invested: $77,778 (down + closing). Projections, not guarantees.
Landlord ↔ Tenant lean methodology
- Overall (STATE)
- 18 Strongly Tenant-Friendly
- State California
- 18 Strongly Tenant-Friendly · D+13
- County
- — inherits STATE
- City
- — inherits STATE
ZIP-level market 93307
- Rents YoY
- 5.7%
- Active inventory
- 314
- Price-to-rent
- 11.3×
Monthly cashflow live
- Estimated rent
- $2,043 high interval (Pro) →
- Mortgage (P&I)
- −$1,457
- Tax from tax record
- −$204 /mo · $2,451/yr
- Insurance
- −$116
- HOA
- −$0
- Vacancy / Maint / Mgmt
- −$429
- Net cashflow
- $-163
Break-even live
Sensitivity live
| Price | -10% $-5 | -5% $-84 | +0% $-163 | +5% $-241 | +10% $-320 |
|---|---|---|---|---|---|
| Rent | -10% $-324 | -5% $-243 | +0% $-163 | +5% $-82 | +10% $-1 |
| Rate | -1.0pp $-23 | -0.5pp $-92 | base $-163 | +0.5pp $-235 | +1.0pp $-308 |
UW: 25.0% down · 7.5% · 30yr · 1.5% tax · 5.0% vac · 8.0% maint · 8.0% mgmt
Financing live
Cash to close
- Down payment
- $69,444
- Closing costs
- $8,333
- Reserves months
- —
- Total cash needed
- —
Loan-product check · same deal, 3 products live
Conventional
25% down · 7.5% · 30yr
- Down + closing
- —
- Monthly P&I
- —
- Monthly cashflow
- —
- DSCR
- —
- Eligible?
- —
Personal DTI + credit; lowest rate.
DSCR
20% down · 8.5% · 30yr
- Down + closing
- —
- Monthly P&I
- —
- Monthly cashflow
- —
- DSCR
- —
- Eligible?
- —
No personal income docs; deal must DSCR.
Hard money
10% down · 12.0% · 12mo
- Down + closing
- —
- Monthly P&I
- —
- Monthly cashflow
- —
- DSCR
- —
- Eligible?
- —
Short-term bridge; refi at stabilization.
Rent comps 28 comps
| Address | Beds | Baths | Sqft | Rent | $/sqft | DOM | Units | Dist |
|---|---|---|---|---|---|---|---|---|
| 5516 Dustin St Bakersfield, CA | 4.0 | 2.0 | 1507 | $2,450 | $1.63 | 45d | 1 | 0.17mi |
| 1000 Pacheco Rd Unit 131 Bakersfield, CA | 3.0 | 1.0 | 1095 | $1,650 | $1.51 | 4d | 1 | 0.57mi |
| 331 Pacheco Rd Bakersfield, CA | 2.0–3.0 | 1.5–2.0 | 1147 | $1,700 | $1.48 | 4d | 3 | 0.62mi |
| 4513 Barry St Bakersfield, CA | 3.0 | 2.0 | 1492 | $1,975 | $1.32 | 4d | 1 | 0.74mi |
| 6513 Pine View Dr Bakersfield, CA | 3.0 | 2.5 | 1600 | $1,950 | $1.22 | 4d | 1 | 0.77mi |
| 4519 Gordon St Bakersfield, CA | 3.0 | 1.0 | 1051 | $1,695 | $1.61 | 4d | 1 | 0.82mi |
| 4605 Mount Everest Way Bakersfield, CA | 3.0 | 2.0 | 1465 | $2,250 | $1.54 | 4d | 1 | 0.87mi |
| 4412 Gordon St Bakersfield, CA | 3.0 | 1.0 | 1039 | $1,795 | $1.73 | 4d | 1 | 0.88mi |
| 2308 Kelso Peak Ave Bakersfield, CA | 3.0 | 2.5 | 1752 | $3,900 | $2.23 | 5d | 1 | 1.03mi |
| 1318 Evadonna Rd Bakersfield, CA | 3.0 | 2.0 | 1012 | $2,200 | $2.17 | 12d | 1 | 1.11mi |
| 400 White Ln Bakersfield, CA | 2.0 | 1.0 | 900 | $1,399 | $1.55 | 4d | 1 | 1.14mi |
| 2625 Miria Dr Bakersfield, CA | 3.0 | 1.0 | 1308 | $1,850 | $1.41 | 25d | 1 | 1.16mi |
| 1305 Quartz Hill Rd Bakersfield, CA | 3.0 | 2.0 | 1351 | $2,250 | $1.67 | 4d | 1 | 1.20mi |
| 1050 E Panama Ln Bakersfield, CA | 2.0 | 2.0 | 1015 | $1,895 | $1.87 | 45d | 1 | 1.23mi |
| 710 Chateau Ct Bakersfield, CA | 3.0 | 2.0 | 1729 | $2,200 | $1.27 | 45d | 1 | 1.34mi |
| 600 Hosking Ave Unit 73D Bakersfield, CA | 3.0 | 2.0 | 1230 | $1,850 | $1.50 | 45d | 1 | 1.38mi |
| 600 Hosking Ave Unit 43B Bakersfield, CA | 2.0 | 1.5 | 1050 | $1,650 | $1.57 | 45d | 1 | 1.38mi |
| 600 Hosking Ave Unit 56A Bakersfield, CA | 3.0 | 2.0 | 1200 | $1,750 | $1.46 | 4d | 1 | 1.38mi |
| 600 Hosking Ave Unit 51D Bakersfield, CA | 3.0 | 2.0 | 1200 | $1,800 | $1.50 | 5d | 1 | 1.38mi |
| 600 Hosking Ave Unit 47C Bakersfield, CA | 2.0 | 1.5 | 1008 | $1,650 | $1.64 | 4d | 1 | 1.38mi |
| 600 Hosking Ave Unit 75B Bakersfield, CA | 2.0 | 1.5 | 1008 | $1,650 | $1.64 | 23d | 1 | 1.38mi |
| 600 Hosking Ave Unit 47B Bakersfield, CA | 2.0 | 1.5 | 1008 | $1,650 | $1.64 | 12d | 1 | 1.38mi |
| 600 Hosking Ave Apt 69A Bakersfield, CA | 3.0 | 2.0 | 1208 | $1,850 | $1.53 | 21d | 1 | 1.38mi |
| 3608 Balboa Dr Bakersfield, CA | 3.0 | 1.5 | 1051 | $2,195 | $2.09 | 4d | 1 | 1.41mi |
| 4140 Teal St Apt 10 Bakersfield, CA | 2.0 | 1.0 | 950 | $1,295 | $1.36 | 25d | 1 | 1.42mi |
| 4140 Teal St Bakersfield, CA | 2.0 | 1.0 | 950 | $1,525 | $1.61 | 4d | 1 | 1.42mi |
| 4140 Teal St Unit 12A Bakersfield, CA | 2.0 | 1.0 | 950 | $1,525 | $1.61 | 12d | 1 | 1.42mi |
| 3461 S Chester Ave Apt 19 Bakersfield, CA | 2.0 | 1.5 | 975 | $1,295 | $1.33 | 45d | 1 | 1.47mi |
Listing history 32 events
-
2026-06-21days on market $277,777 Active 53 DOM
-
2026-06-18days on market $277,777 Active 50 DOM
-
2026-06-17days on market $277,777 Active 49 DOM
-
2026-06-16days on market $277,777 Active 48 DOM
-
2026-06-15days on market $277,777 Active 47 DOM
-
2026-06-14days on market $277,777 Active 45 DOM
-
2026-06-13days on market $277,777 Active 44 DOM
-
2026-06-10days on market $277,777 Active 42 DOM
-
2026-06-09days on market $277,777 Active 41 DOM
-
2026-06-08days on market $277,777 Active 40 DOM
-
2026-06-07days on market $277,777 Active 39 DOM
-
2026-06-05days on market $277,777 Active 36 DOM
-
2026-06-03days on market $277,777 Active 35 DOM
-
2026-06-03days on market $277,777 Active 34 DOM
-
2026-06-01days on market $277,777 Active 33 DOM
-
2026-05-31days on market $277,777 Active 32 DOM
-
2026-04-29$277,777 Active 332-char remark
-
2009-12-04price $108,900 162-char remark
Show marketing remark (162 chars)
Nice home located on a coner lot in move in condition. Brand new carpet and tile in kitchen and bathrooms. Bring me an offer today this one is in great condition.
-
2009-12-03soldstatus $115,000 162-char remark
Show marketing remark (162 chars)
Nice home located on a coner lot in move in condition. Brand new carpet and tile in kitchen and bathrooms. Bring me an offer today this one is in great condition.
-
2009-12-03soldstatus $115,000
Show marketing remark (162 chars)
Nice home located on a coner lot in move in condition. Brand new carpet and tile in kitchen and bathrooms. Bring me an offer today this one is in great condition.
-
2009-10-10historical 162-char remark
Show marketing remark (162 chars)
Nice home located on a coner lot in move in condition. Brand new carpet and tile in kitchen and bathrooms. Bring me an offer today this one is in great condition.
-
2009-08-05$115,000 162-char remark
Show marketing remark (162 chars)
Nice home located on a coner lot in move in condition. Brand new carpet and tile in kitchen and bathrooms. Bring me an offer today this one is in great condition.
-
2004-12-17price $179,900
Show marketing remark (133 chars)
3 Bedroom 2 bath home in corner lot w/ fireplace and 2 car garage in SW Bakersfield w/ lots of extras. Won't last long at this price!
-
2004-12-16soldstatus $180,000
Show marketing remark (133 chars)
3 Bedroom 2 bath home in corner lot w/ fireplace and 2 car garage in SW Bakersfield w/ lots of extras. Won't last long at this price!
-
2004-12-16soldstatus $180,000
Show marketing remark (133 chars)
3 Bedroom 2 bath home in corner lot w/ fireplace and 2 car garage in SW Bakersfield w/ lots of extras. Won't last long at this price!
-
2004-09-29historical
Show marketing remark (133 chars)
3 Bedroom 2 bath home in corner lot w/ fireplace and 2 car garage in SW Bakersfield w/ lots of extras. Won't last long at this price!
-
2004-09-27$180,000
Show marketing remark (133 chars)
3 Bedroom 2 bath home in corner lot w/ fireplace and 2 car garage in SW Bakersfield w/ lots of extras. Won't last long at this price!
-
2002-04-05price $21,900
-
2001-09-14soldstatus $92,500
-
2000-10-20soldstatus $25,050
-
2000-08-29historical
-
2000-08-10$25,050
ⓘ Source: listings_history table (triggers on properties + properties_extension) + one-shot
backfill from property_details.listing_events for pre-trigger history.
Tax reassessment forecast CA · Resets to sale price
- Current annual tax
- $2,451 · $204/mo
- Projected year-2 tax
- $2,451 · $204/mo
- Expected delta
- $0/yr ($0/mo · 0.0%)
ⓘ Screening estimate from a state-policy table — verify with the county assessor before closing.
Climate risk First Street
- Flood 1/10 Low FEMA zone X (unshaded) · 0% chance over 30 yrs
- Wildfire 4/10 Moderate
- Heat 8/10 Severe 7 d/yr ≥105°F today · 18 d/yr by 30 yrs out
- Wind 1/10 Low
- Air quality 10/10 Extreme 33 unhealthy d/yr today · 37 by 30 yrs out
Nearby sold comps map
Loading sold comps map…
Walkable amenities ~0.75 mi
Loading nearby amenities…
Taxation est. · year 1
- Rental income
- $24,517
- − Mortgage interest
- −$15,560
- − Property taxes
- −$2,451
- − Insurance
- −$1,389
- − Repairs & maintenance
- −$1,961
- − Management
- −$1,961
- − Depreciation
- −$8,081
- Taxable loss
- −$6,887
- Est. tax savings @ 24.0%
- +$1,653
- After-tax cash flow
- $-299/yr
For passive investors: Depreciation is non-cash, so a rental often shows a tax loss while cash-flowing — sheltering income. Rental losses are passive: they offset passive income freely, and up to $25,000/yr can offset ordinary (W-2) income if you actively participate and your MAGI is under $100k (phasing out to $0 by $150k); unused losses carry forward. On sale, claimed depreciation is recaptured at up to 25%, and gains may owe capital-gains tax (a 1031 exchange can defer both). Figures are a year-1 estimate at your 24.0% rate — not tax advice; consult a CPA.
Schools (NCES district)
- District
- Kern High
- NCES district ID
- 0619540
- Math proficiency
- 21% ▬ 0.00%
- Reading proficiency
- 51% ▲ 2.00%
- Median HH income
- $49,686
- Composite
- 33.68/100
- National rank
- #10443
- State rank
- #860 of 1400 in CA
Livability — Bakersfield
- Score
- 58/100
- State rank
- #716
- US rank
- #21355
Category grades
Schools grade is shown separately in the Schools card above.
Census & demographics
- Census place
- Bakersfield, CA
- County
- Kern County · 710,371 people
- City population
- 499,124
- Metro
- Bakersfield, CA
- Population (ZIP)
- 85,945
- Household income
- $56,446
- Rent vs Own
- Severe rent burden
- 3246.0
Population outlook (Kern County) Hauer SSP2
- Today (2025)
- 947,286 people
- By 2030
- 978,984 · +3.3%
- By 2040
- 1,045,018 · +10.3%
- By 2050
- 1,105,232 · +16.7%
- By 2075
- 1,229,538 · +29.8%
- By 2100
- 1,238,059 · +30.7%
Race, ethnicity, and origin ACS 2023
- Neighborhood character
- Predominantly Hispanic (80%)
- Race & ethnicity
- Hispanic / Latino 80% Two or more races 12% White 10% Black 6% Asian 3% Native American 1%
- Hispanic origin (detail)
- Mexican 73%
- Common ancestry
- Lithuanian 0%
- Foreign-born
- 31% · Canada
- Languages at home
- 28% English-only · Spanish 69% Other Indo-European 1% Arabic 1%
Political lean MEDSL · Kern
- 2024 margin
- Strong R (+21.1) · D 38.2% · R 59.3% · Other 2.5%
- 2008→2024 swing
- -3.3pp toward R · 2008: -17.8pp · 2024: -21.1pp
- All cycles
- 2024: R+21.1 2020: R+10.2 2016: R+15.0 2012: R+20.9 2008: R+17.8
Not yet ingested
- Civics
- —
Market trends
- HPI YoY
- ▼ -263.59%
- Current HPI
- 447.1746
- Rent YoY
- ▲ 5.71%
- Metro
- Bakersfield, CA
- State GDP YoY
- ▲ 3.21%
- F500 in state
- 116
Industry mix (Fortune 500 HQ in CA)
| Industry | F500 HQs | Revenue |
|---|---|---|
| Technology | 27 | $1,492B |
|
||
| Financial Services | 3 | $174B |
|
||
| Retail | 3 | $44B |
|
||
| Insurance | 3 | $26B |
|
||
| Media / Entertainment | 2 | $115B |
|
||
| Pharmaceuticals / Biotech | 2 | $62B |
|
||
Price history
+1008.9% since first listed16 events — show timeline
- 2026-04-29 Listed $277,777 GEMLS
- 2009-12-04 Price Changed $108,900 GEMLS
- 2009-12-03 Sold (Public Records) $115,000 Public Records
- 2009-12-03 Sold (MLS) $115,000 GEMLS
- 2009-10-10 Delisted — GEMLS
- 2009-08-05 Listed $115,000 GEMLS
- 2004-12-17 Price Changed $179,900 GEMLS
- 2004-12-16 Sold (Public Records) $180,000 Public Records
- 2004-12-16 Sold (MLS) $180,000 GEMLS
- 2004-09-29 Delisted — GEMLS
- 2004-09-27 Listed $180,000 GEMLS
- 2002-04-05 Price Changed $21,900 GEMLS
- 2001-09-14 Sold (Public Records) $92,500 Public Records
- 2000-10-20 Sold (MLS) $25,050 GEMLS
- 2000-08-29 Delisted — GEMLS
- 2000-08-10 Listed $25,050 GEMLS
Property tax history
+2.7%/yrLatest (2025): $2,451 · +2.1% YoY. Source: county tax records.
Cash-flow waterfall
monthlySold comps — $/sqft
last 12 mo · ≤1 miLoading sold comps…