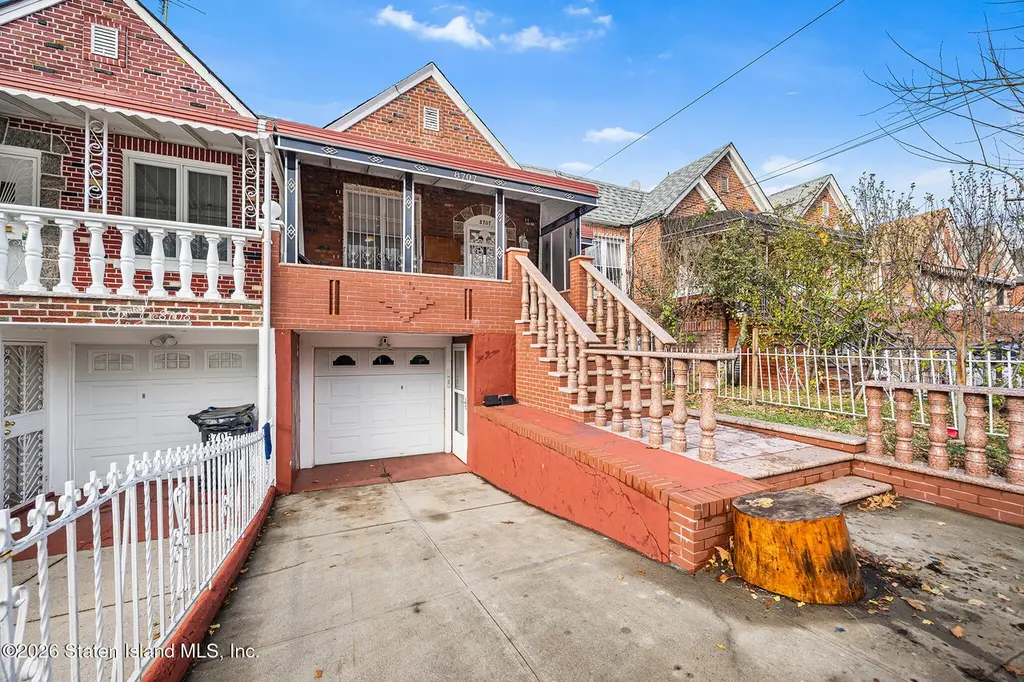
8707 Avenue B · New York, NY
Flood risk 1/10 · Minimal
- FEMA flood zone
- X (unshaded)
- Chance of flooding over 30 yrs
- 0.0%
- Est. flood insurance / yr
- $507 – $1,088
Fire risk 1/10 · Minimal
- Est. fire insurance / yr
- $691 – $1,283
Heat risk 7/10 · Major
- Hot days now (above 97°F)
- 7 days/yr
- Hot days in 30 yrs
- 15 days/yr
Wind risk 6/10 · Moderate
- Chance of severe wind over 30 yrs
- 65.0%
Air-quality risk 5/10 · Moderate
- Unhealthy air days now
- 6 days/yr
- Unhealthy air days in 30 yrs
- 8 days/yr
Risk factors via First Street. Map © Google.
Why this score? — see what drove the D- grade
The composite is a weighted blend of 9 inputs, each scored 0–100. Each bar is that input's sub-score; the figure is the points it added to the 100-point composite (weight × sub-score).
- Appreciation +10.0/10.0
- Cash flow +7.4/30.0
- Schools +5.0/10.0
- Rent growth +4.4/5.0
- Livability +3.8/5.0
- Condition / age +2.5/5.0
- 1% rule +2.1/10.0
- DSCR +1.5/10.0
- ARV discount +0.2/15.0
$859,000
🖨 Deal sheet (PDF) 📄 Offer letter ✓ Due diligence
Listing remarks
Charming and well-maintained single-family brick home located on a quiet residential block in Canarsie. This spacious property features a bright living room and an eat-in kitchen with great layout potential. The upper level offers generously sized bedrooms with ample closet space. A finished/partially finished basement provides additional space and includes access to a built-in garage, offering convenient parking and storage. Enjoy a private backyard perfect for outdoor enjoyment and entertaining. Conveniently located near shopping, schools, parks, and public transportation. A solid, well-built home with excellent potential—don't miss this opportunity.
Key facts
- Ample closet space
- Bright living room
- Eat-in kitchen
Tags
Property features AI
Finance
- Financial info: Annual tax amount reported
Exterior
- Parking: One-car garage (attached: no)
- Utilities: 220-volt electrical service
- Home design: Two-story building; Approximately 1,872 building area
- Construction: Brick construction; Year built listed as approximate
- Exterior features: Lot approximately 0.05 acres (about 2,200 sq ft); Lot dimensions approximately 22 x 100; Zoned R-5
Interior
- Bathrooms: One full bathroom; One three-quarter bathroom (total two bathrooms)
- Heating & cooling: Natural gas heating; Other heating type
- Interior features: Natural gas heating available
Neighborhood map
What this means for you Summary
Snapshot
- This is a 3-bed/2.0-bath single-family listed at $859k.
Deal economics
- At list price, monthly cash flow is $-1k ($-13k/yr) — negative.
- To cash-flow at today's rent, offer at most $698k (18.8% below list).
- To meet the 1% rule (rent ≥ 1% of price), the offer needs to be $610k (29.0% below list).
- Recommended offer: $610k (29.0% below list) — sets the bar for 1% rule.
- Cap rate 4.7% vs local median 2.6% in New York — top-decile yield for the area; either an underpriced asset or a hidden risk that comps aren't pricing in. Stress-test before assuming the spread holds.
Location & tenants
- Location reads 75/100 on livability (#268 in NY, #4,188 nationally) — a middle-class / working-renter tenant base. Strengths: amenities A+, commute A+, health & safety A; Watch: crime F, cost of living F.
- Zoned schools: Elm Tree Elementary School (math 27% / reading 52%, grade F, #1,444 of 2,108 statewide, top 71%, 806 students, 94% FRL); Jhs 383 Philippa Schuyler (math 32% / reading 67%, grade C, #280 of 729 statewide, top 40%, 822 students, 85% FRL); Midwood High School (math 94% / reading 96%, grade A+, #83 of 1,100 statewide, top 8%, 4,062 students, 73% FRL).
- Market conditions: Rents rising fast (+7.5%/yr); 87 active listings in the ZIP; 1 comparable units currently listed for rent nearby; solid renter incomes; 10,063 units permitted in Kings County in 2024 (9,789 in 5+ unit buildings).
- At $6,102/mo this rent would consume 79% of the median local household income ($93k/yr) (locally 5275% of renters already pay >50% of income on rent) — very limited rent-growth headroom before tenants either downsize or default.
Forward outlook
- In year one you build about $92k of equity ($6k loan paydown + $86k appreciation (10.0% local appreciation)).
- Kings County population projected at +13% by 2050 — modest demand growth; plan on rents tracking national, not racing it.
- By year 2, paydown + projected appreciation supports a ~$148k cash-out refi (75% LTV) — recoverable capital for the next deal without selling this one.
Negotiation context
- Only 4 days on market — expect competitive offers; lowballing is unlikely to land.
Risks & watch-outs
- Watch-outs: built in 1940 — expect roof / HVAC / electrical / plumbing capex.
- Climate carrying-cost: major wind risk, 65% chance of damaging wind over 30y; extreme-heat days projected 7→15/yr by 2055 (HVAC capex compounding) — expect insurance premiums to compound above CPI over the hold.
Questions for the listing agent
- What do current leases actually rent for vs. the listed asking? Can we see a recent rent roll and the last 12 months of T-12 income?
- Built in 1940 — when were the roof, HVAC, electrical panel, plumbing, and water heater last replaced?
- Is there a deadline driving the sale (1031 exchange, divorce, estate, relocation)? That informs how much negotiation room exists.
- Schools are B-rated — typically a magnet for longer-tenancy family renters. What's the average tenant stay here, and is there a school-zone premium baked into asking?
- Crime grade is F in this area — have there been break-ins, vandalism, or insurance claims at this property in the last 3 years? What carrier currently insures it and at what premium?
- The area grade is low — what's the realistic commute time and amenity access for the typical tenant pool here? Any planned neighborhood developments (good or bad) we should know about?
- What's the average days-on-market for RENTAL listings here right now (not sales)? A rising rental-DOM trend means longer vacancies and softer asking-rent achievability than the comps imply.
- What's the recent tenant-quality profile in this submarket — average credit score on applications, eviction rate, late-payment / NSF rate, and stable-employment percentage? A property-management company in the area should have these aggregated.
- How much new for-sale + rental construction is in the pipeline within 1–3 miles? Heavy new supply typically softens prices + rents 12–24 months out; constrained supply supports both.
Investment metrics
- 1% rule
- 0.71% ✗
- Cap rate
- 4.73%
- Cash-on-cash
- -5.57%
- DSCR
- 0.75
- GRM
- 11.7
CMA / ARV
- ARV (on-the-fly)
- $739,440
- Comps found
- 8
Show comp detail 8 sales within ~0.75 mi
| Address | Dist | Beds/Ba | Sqft | Sold | Price | $/sf | Match |
|---|---|---|---|---|---|---|---|
| 150 E 88th St | 0.05mi | 2/2.0 (-1) | 1,690 (-10%) | 15mo | $669,000 | $396 | 64 |
| 151 E 87th St | 0.04mi | 2/2.0 (-1) | 1,671 (-11%) | 20mo | $660,000 | $395 | 59 |
| 5517 Whitty Ln | 0.64mi | 3/2.0 | 1,710 (-9%) | 2mo | $630,000 | $368 | 54 |
| 8813 Glenwood Rd | 0.71mi | 3/1.5 | 1,792 (-4%) | 11mo | $342,090 | $191 | 49 |
| 586 E 54th St | 0.49mi | 3/2.0 | 1,620 (-14%) | 7mo | $685,000 | $423 | 49 |
| 1039 East 92nd St | 0.67mi | 2/1.5 (-1) | 1,872 (0%) | 22mo | $670,000 | $358 | 44 |
| 743 E 49th St | 0.71mi | 3/2.0 | 2,100 (+12%) | 5mo | $775,000 | $369 | 42 |
| 801 E 51 St | 0.69mi | 3/2.5 | 1,632 (-13%) | 12mo | $739,000 | $453 | 34 |
Match score weights: distance 35% · size 25% · config 20% · recency 20%. Top-matched comps best support the ARV.
Projected returns pro-forma
10.0% appreciation · 7.48% rent growth · sell at horizon
- IRR
- 21.6%
- Equity multiple
- 2.77×
- Total profit
- $425,617
- Equity at exit
- $773,855
- IRR
- 20.5%
- Equity multiple
- 6.73×
- Total profit
- $1,379,222
- Equity at exit
- $1,668,848
Cash invested: $240,520 (down + closing). Projections, not guarantees.
Landlord ↔ Tenant lean methodology
- Overall (CITY)
- 0 Strongly Tenant-Friendly
- State New York
- 15 Strongly Tenant-Friendly · D+10
- County
- — inherits STATE
- City New York
- 0 Strongly Tenant-Friendly · D+34
ZIP-level market 10009
- Home prices YoY
- 2.2%
- Rents YoY
- 7.5%
- Active inventory
- 87
- Price-to-rent
- 11.7×
Monthly cashflow live
- Estimated rent
- $6,102 medium interval (Pro) →
- Mortgage (P&I)
- −$4,505
- Tax est. 1.5%
- −$1,074 /mo · $12,885/yr
- Insurance
- −$358
- HOA
- −$0
- Vacancy / Maint / Mgmt
- −$1,281
- Net cashflow
- $-1,116
Break-even live
Sensitivity live
| Price | -10% $-522 | -5% $-819 | +0% $-1,116 | +5% $-1,412 | +10% $-1,709 |
|---|---|---|---|---|---|
| Rent | -10% $-1,598 | -5% $-1,357 | +0% $-1,116 | +5% $-875 | +10% $-634 |
| Rate | -1.0pp $-683 | -0.5pp $-897 | base $-1,116 | +0.5pp $-1,338 | +1.0pp $-1,565 |
UW: 25.0% down · 7.5% · 30yr · 1.5% tax · 5.0% vac · 8.0% maint · 8.0% mgmt
Financing live
Cash to close
- Down payment
- $214,750
- Closing costs
- $25,770
- Reserves months
- —
- Total cash needed
- —
Loan-product check · same deal, 3 products live
Conventional
25% down · 7.5% · 30yr
- Down + closing
- —
- Monthly P&I
- —
- Monthly cashflow
- —
- DSCR
- —
- Eligible?
- —
Personal DTI + credit; lowest rate.
DSCR
20% down · 8.5% · 30yr
- Down + closing
- —
- Monthly P&I
- —
- Monthly cashflow
- —
- DSCR
- —
- Eligible?
- —
No personal income docs; deal must DSCR.
Hard money
10% down · 12.0% · 12mo
- Down + closing
- —
- Monthly P&I
- —
- Monthly cashflow
- —
- DSCR
- —
- Eligible?
- —
Short-term bridge; refi at stabilization.
Rent comps 1 comps
| Address | Beds | Baths | Sqft | Rent | $/sqft | DOM | Units | Dist |
|---|---|---|---|---|---|---|---|---|
| 819 Saratoga Ave Brooklyn, NY | 3.0 | 1.5 | 1300 | $3,350 | $2.58 | 26d | 1 | 0.89mi |
Listing history 3 events
-
2026-06-21days on market $859,000 Active 4 DOM
-
2026-06-18remarks 660-char remark
-
2026-06-18$859,000 Active 1 DOM
ⓘ Source: listings_history table (triggers on properties + properties_extension) + one-shot
backfill from property_details.listing_events for pre-trigger history.
Climate risk First Street
- Flood 1/10 Low FEMA zone X (unshaded) · 0% chance over 30 yrs
- Wildfire 1/10 Low
- Heat 7/10 Severe 7 d/yr ≥97°F today · 15 d/yr by 30 yrs out
- Wind 6/10 Major 65% chance of damaging wind over 30 yrs
- Air quality 5/10 Major 6 unhealthy d/yr today · 8 by 30 yrs out
Nearby sold comps map
Loading sold comps map…
Walkable amenities ~0.75 mi
Loading nearby amenities…
Taxation est. · year 1
- Rental income
- $73,226
- − Mortgage interest
- −$48,117
- − Property taxes
- −$12,885
- − Insurance
- −$4,295
- − Repairs & maintenance
- −$5,858
- − Management
- −$5,858
- − Depreciation
- −$24,989
- Taxable loss
- −$28,777
- Est. tax savings @ 24.0%
- +$6,906
- After-tax cash flow
- $-6,481/yr
For passive investors: Depreciation is non-cash, so a rental often shows a tax loss while cash-flowing — sheltering income. Rental losses are passive: they offset passive income freely, and up to $25,000/yr can offset ordinary (W-2) income if you actively participate and your MAGI is under $100k (phasing out to $0 by $150k); unused losses carry forward. On sale, claimed depreciation is recaptured at up to 25%, and gains may owe capital-gains tax (a 1031 exchange can defer both). Figures are a year-1 estimate at your 24.0% rate — not tax advice; consult a CPA.
Schools (NCES district)
No district data.
Livability — New York
- Score
- 75/100
- State rank
- #268
- US rank
- #4188
Category grades
Schools grade is shown separately in the Schools card above.
Census & demographics
- Census place
- New York, NY
- County
- New York County · 1,599,927 people
- City population
- 7,731,280
- Metro
- New York-Newark-Jersey City, NY-NJ-PA
- Population (ZIP)
- 60,209
- Household income
- $92,876
- Rent vs Own
- Severe rent burden
- 5275.0
Population outlook (Kings County) Hauer SSP2
- Today (2025)
- 2,847,441 people
- By 2030
- 2,937,006 · +3.1%
- By 2040
- 3,095,491 · +8.7%
- By 2050
- 3,228,968 · +13.4%
- By 2075
- 3,321,723 · +16.7%
- By 2100
- 3,111,387 · +9.3%
Race, ethnicity, and origin ACS 2023
- Neighborhood character
- Diverse neighborhood (Simpson 0.66)
- Race & ethnicity
- White 51% Hispanic / Latino 24% Asian 13% Two or more races 11% Black 8%
- Hispanic origin (detail)
- Mexican 1% Puerto Rican 11% Cuban 2% Dominican 5%
- Common ancestry
- Romanian 3% Subsaharan African 2% Scotch-Irish 2%
- Foreign-born
- 25% · China, Canada, Jamaica
- Languages at home
- 64% English-only · Spanish 18% Chinese 8% Other Indo-European 3%
Political lean MEDSL · Kings
- 2024 margin
- Solid D (+44.0) · D 72.0% · R 28.0%
- 2008→2024 swing
- -15.5pp toward R · 2008: 59.4pp · 2024: 44.0pp
- All cycles
- 2024: D+44.0 2020: D+54.8 2016: D+61.8 2012: D+63.9 2008: D+59.4
Not yet ingested
- Civics
- —
Market trends
- HPI YoY
- ▲ 10.20%
- Current HPI
- 473.6656
- Rent YoY
- ▲ 7.48%
- Metro
- New York-Newark-Jersey City, NY-NJ-PA
- State GDP YoY
- ▲ 2.60%
- F500 in state
- 92
Industry mix (Fortune 500 HQ in NY)
| Industry | F500 HQs | Revenue |
|---|---|---|
| Financial Services | 10 | $950B |
|
||
| Consumer Goods | 9 | $162B |
|
||
| Insurance | 4 | $225B |
|
||
| Telecommunications | 2 | $144B |
|
||
| Pharmaceuticals | 2 | $112B |
|
||
| Media / Entertainment | 2 | $69B |
|
||
Price history
1 event — show timeline
- 2026-06-17 Listed $859,000 SIBORMLS
Cash-flow waterfall
monthlySold comps — $/sqft
last 12 mo · ≤1 miLoading sold comps…