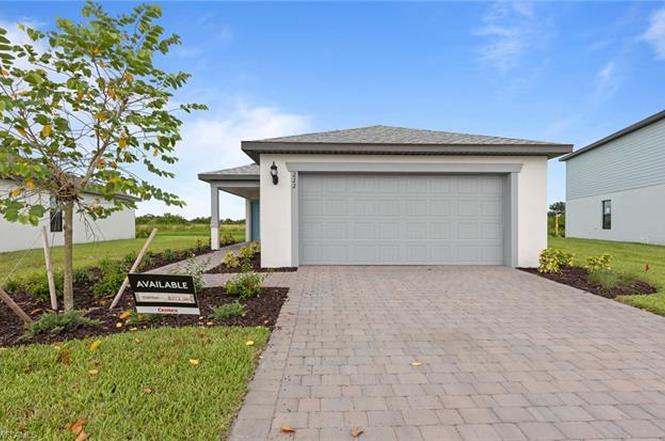
222 Silent Lake Dr · Lehigh Acres, FL
Flood risk No data
- FEMA flood zone
- —
- Chance of flooding over 30 yrs
- —
- Est. flood insurance / yr
- —
Fire risk No data
- Est. fire insurance / yr
- —
Heat risk No data
- Hot days now (above threshold)
- —
- Hot days in 30 yrs
- —
Wind risk No data
- Chance of severe wind over 30 yrs
- —
Air-quality risk No data
- Unhealthy air days now
- —
- Unhealthy air days in 30 yrs
- —
Risk factors via First Street. Map © Google.
Why this score? — see what drove the D- grade
The composite is a weighted blend of 9 inputs, each scored 0–100. Each bar is that input's sub-score; the figure is the points it added to the 100-point composite (weight × sub-score).
- Appreciation +10.0/10.0
- Cash flow +6.6/30.0
- ARV discount +6.5/15.0
- Schools +4.1/10.0
- Livability +3.0/5.0
- Condition / age +2.5/5.0
- 1% rule +1.7/10.0
- Rent growth +1.3/5.0
- DSCR +0.9/10.0
$313,385
🖨 Deal sheet 📄 Offer letter ✓ Due diligence
Key facts
- 2 garage spots
- Built 2025
- Listed 364 days
Property features AI
Finance
- Financial info: List price: $313,385
Exterior
- Parking: 2 total parking spaces; 2-car garage
- Home design: Single-family spec home — Plan: Daniel; Active listing
- Exterior features: Address: 222 Silent Lake Dr, Lehigh Acres, FL 33974
Interior
- Bedrooms: 4 bedrooms
- Bathrooms: 2 full bathrooms
- Interior features: Open living area (1,580 livable area)
Neighborhood map
What this means for you Summary
Snapshot
- This is a 4-bed/2.0-bath single-family listed at $313k.
Deal economics
- At list price, monthly cash flow is $-512 ($-6k/yr) — negative.
- To cash-flow at today's rent, offer at most $239k (23.6% below list).
- To meet the 1% rule (rent ≥ 1% of price), the offer needs to be $209k (33.2% below list).
- Recommended offer: $209k (33.2% below list) — sets the bar for 1% rule.
Location & tenants
- Location reads 59/100 on livability (#826 in FL) — a working-class tenant base; expect higher turnover. Strengths: cost of living A+, housing A+; Watch: crime C-, employment D+, schools D-.
- Lee (suburban): math 47% / reading 50% proficiency, ranked #42 of 73 in FL (top 58%) — families likely to look elsewhere, expect single-tenant / working-renter base with shorter leases.
- Market conditions: Rents falling (-4.7%/yr); 2460 active listings in the ZIP; 40 comparable units currently listed for rent nearby; rentals at typical pace (median 24d on market — plan ~3-4 weeks tenant-placement turnaround); 15,411 units permitted in Lee County in 2024 (4,686 in 5+ unit buildings).
- This rent runs 35% of the median local income ($72k/yr) — at the standard rent-burdened threshold; future hikes will face affordability resistance.
Forward outlook
- In year one you build about $34k of equity ($2k loan paydown + $31k appreciation (10.0% local appreciation)).
- Lee County population projected at +44% by 2050 — long-run rental-demand tailwind backs the buy-and-hold thesis.
- By year 2, paydown + projected appreciation supports a ~$54k cash-out refi (75% LTV) — recoverable capital for the next deal without selling this one.
Negotiation context
- It's been on market 365 days — a 12% lower offer ($276k) is reasonable based on typical stale-listing flexibility.
Questions for the listing agent
- What do current leases actually rent for vs. the listed asking? Can we see a recent rent roll and the last 12 months of T-12 income?
- It's been on market 365 days. Have you received any prior offers? Is the seller open to a 33% concession, seller financing, or rate buy-down credit?
- Why hasn't it sold? Are there any deal-killer items the seller is aware of (foundation, flood, title, zoning, code violations)?
- Is there a deadline driving the sale (1031 exchange, divorce, estate, relocation)? That informs how much negotiation room exists.
- Schools are D-rated, which usually means shorter tenancies and higher turnover. Who's the typical renter profile here, and what's been the actual vacancy rate?
- The area grade is low — what's the realistic commute time and amenity access for the typical tenant pool here? Any planned neighborhood developments (good or bad) we should know about?
- What's the average days-on-market for RENTAL listings here right now (not sales)? A rising rental-DOM trend means longer vacancies and softer asking-rent achievability than the comps imply.
- What's the recent tenant-quality profile in this submarket — average credit score on applications, eviction rate, late-payment / NSF rate, and stable-employment percentage? A property-management company in the area should have these aggregated.
- How much new for-sale + rental construction is in the pipeline within 1–3 miles? Heavy new supply typically softens prices + rents 12–24 months out; constrained supply supports both.
Investment metrics
- 1% rule
- 0.67% ✗
- Cap rate
- 4.33%
- Cash-on-cash
- -7.00%
- DSCR
- 0.69
- GRM
- 12.5
CMA / ARV
- ARV (on-the-fly)
- $306,520
- Comps found
- 12
Show comp detail 12 sales within ~0.75 mi
| Address | Dist | Beds/Ba | Sqft | Sold | Price | $/sf | Match |
|---|---|---|---|---|---|---|---|
| 626 Linville Pl | 0.20mi | 3/2.0 (-1) | 1,608 (+2%) | 4mo | $290,000 | $180 | 79 |
| 261 Moonlit Lake Trl | 0.20mi | 3/2.0 (-1) | 1,521 (-4%) | 6mo | $310,000 | $204 | 74 |
| 654 Lakeside Oasis Ave | 0.18mi | 3/2.0 (-1) | 1,521 (-4%) | 11mo | $327,529 | $215 | 71 |
| 252 Moonlit Lake Trl | 0.16mi | 3/2.0 (-1) | 1,742 (+10%) | 3mo | $345,500 | $198 | 68 |
| 763 Cadis St E | 0.61mi | 4/2.0 | 1,600 (+1%) | 3mo | $310,000 | $194 | 67 |
| 193 Verdun Ave S | 0.44mi | 3/2.0 (-1) | 1,566 (-1%) | 10mo | $325,900 | $208 | 65 |
| 212 Lausanne Ave | 0.53mi | 4/2.0 | 1,638 (+4%) | 6mo | $340,000 | $208 | 64 |
| 723 Cadis St E | 0.44mi | 4/2.0 | 1,700 (+8%) | 4mo | $319,000 | $188 | 64 |
| 200 Danby Rd | 0.44mi | 3/2.0 (-1) | 1,678 (+6%) | 3mo | $289,000 | $172 | 62 |
| 218 Lomax Ave S | 0.44mi | 3/2.5 (-1) | 1,713 (+8%) | 3mo | $275,000 | $161 | 56 |
| 320 Laurel Ave | 0.68mi | 3/2.0 (-1) | 1,652 (+5%) | 2mo | $250,000 | $151 | 54 |
| 379 Charwood Ave S | 0.69mi | 3/3.0 (-1) | 1,780 (+13%) | 3mo | $250,000 | $140 | 36 |
Match score weights: distance 35% · size 25% · config 20% · recency 20%. Top-matched comps best support the ARV.
Projected returns pro-forma
10.0% appreciation · 0.0% rent growth · sell at horizon
- IRR
- 18.6%
- Equity multiple
- 2.50×
- Total profit
- $131,958
- Equity at exit
- $282,322
- IRR
- 16.7%
- Equity multiple
- 5.60×
- Total profit
- $403,324
- Equity at exit
- $608,838
Cash invested: $87,748 (down + closing). Projections, not guarantees.
Landlord ↔ Tenant lean methodology
- Overall (STATE)
- 87 Strongly Landlord-Friendly
- State Florida
- 87 Strongly Landlord-Friendly · R+3
- County
- — inherits STATE
- City
- — inherits STATE
ZIP-level market 33974
- Home prices YoY
- 5.8%
- Rents YoY
- -4.7%
- Active inventory
- 2460
- Price-to-rent
- 12.5×
Monthly cashflow live
- Estimated rent
- $2,093 high interval (Pro) →
- Mortgage (P&I)
- −$1,643
- Tax est. 1.5%
- −$392 /mo · $4,701/yr
- Insurance
- −$131
- HOA
- −$0
- Vacancy / Maint / Mgmt
- −$440
- Net cashflow
- $-512
Break-even live
UW: 25.0% down · 7.5% · 30yr · 1.5% tax · 5.0% vac · 8.0% maint · 8.0% mgmt
Financing live
Cash to close
- Down payment
- $78,346
- Closing costs
- $9,402
- Reserves months
- —
- Total cash needed
- —
Loan-product check · same deal, 3 products live
Conventional
25% down · 7.5% · 30yr
- Down + closing
- —
- Monthly P&I
- —
- Monthly cashflow
- —
- DSCR
- —
- Eligible?
- —
Personal DTI + credit; lowest rate.
DSCR
20% down · 8.5% · 30yr
- Down + closing
- —
- Monthly P&I
- —
- Monthly cashflow
- —
- DSCR
- —
- Eligible?
- —
No personal income docs; deal must DSCR.
Hard money
10% down · 12.0% · 12mo
- Down + closing
- —
- Monthly P&I
- —
- Monthly cashflow
- —
- DSCR
- —
- Eligible?
- —
Short-term bridge; refi at stabilization.
Rent comps 40 comps
| Address | Beds | Baths | Sqft | Rent | $/sqft | DOM | Units | Dist |
|---|---|---|---|---|---|---|---|---|
| 270 Silent Lake Dr Lehigh Acres, FL | 4.0 | 2.0 | 1800 | $1,895 | $1.05 | 12d | 1 | 0.13mi |
| 202 Eaglesmere Dr Lehigh Acres, FL | 3.0 | 2.0 | 1443 | $1,695 | $1.17 | 24d | 1 | 0.30mi |
| 202 Eaglesmere Dr Lehigh Acres, FL | 3.0 | 2.0 | 1443 | $1,600 | $1.11 | 3d | 1 | 0.30mi |
| 286 Justene Cir Lehigh Acres, FL | 3.0 | 2.0 | 1839 | $1,900 | $1.03 | 24d | 1 | 0.37mi |
| 217 Jayview Ave Lehigh Acres, FL | 3.0 | 2.0 | 1491 | $1,600 | $1.07 | 14d | 1 | 0.40mi |
| 718 Sunrise Blvd Lehigh Acres, FL | 3.0 | 2.0 | 1100 | $1,610 | $1.46 | 24d | 1 | 0.41mi |
| 242 S Lake Dr Lehigh Acres, FL | 3.0 | 2.0 | 1572 | $1,600 | $1.02 | 24d | 1 | 0.41mi |
| 230 E Malden Ave S Lehigh Acres, FL | 4.0 | 2.0 | 1833 | $1,875 | $1.02 | 24d | 1 | 0.55mi |
| 727 Cane St E Lehigh Acres, FL | 3.0 | 2.0 | 1582 | $2,000 | $1.26 | 24d | 1 | 0.61mi |
| 719 Center Lake St Lehigh Acres, FL | 3.0 | 2.0 | 1616 | $1,750 | $1.08 | 24d | 1 | 0.62mi |
| 713 Cardinal St E Lehigh Acres, FL | 3.0 | 2.0 | 1100 | $1,635 | $1.49 | 3d | 1 | 0.64mi |
| 264 Ground Dove Cir Lehigh Acres, FL | 4.0 | 2.0 | 1683 | $2,300 | $1.37 | 24d | 1 | 0.67mi |
| 506 Corinne Dr Unit 506 Lehigh Acres, FL | 3.0 | 2.0 | 1706 | $2,300 | $1.35 | 24d | 1 | 0.68mi |
| 127 Highview Ave Lehigh Acres, FL | 3.0 | 2.0 | 1495 | $1,860 | $1.24 | 3d | 1 | 0.68mi |
| 219 Beckley Dr Lehigh Acres, FL | 3.0 | 2.5 | 1548 | $1,890 | $1.22 | 16d | 1 | 0.70mi |
| 107 W Lake Dr Lehigh Acres, FL | 3.0 | 2.0 | 1610 | $2,100 | $1.30 | 24d | 1 | 0.72mi |
| 706 Arianne Ct Lehigh Acres, FL | 4.0 | 3.0 | 2009 | $2,600 | $1.29 | 24d | 1 | 0.74mi |
| 750 Cane St E Lehigh Acres, FL | 4.0 | 3.0 | 1537 | $2,800 | $1.82 | 3d | 1 | 0.76mi |
| 374 Compese Ave S Lehigh Acres, FL | 3.0 | 2.0 | 1200 | $1,750 | $1.46 | 16d | 1 | 0.79mi |
| 759 Cane St E Lehigh Acres, FL | 3.0 | 2.0 | 1169 | $1,950 | $1.67 | 3d | 1 | 0.79mi |
| 346 Bell Blvd S Lehigh Acres, FL | 3.0 | 2.0 | 1185 | $1,495 | $1.26 | 3d | 1 | 0.84mi |
| 346 Bell Blvd S Lehigh Acres, FL | 3.0 | 2.0 | 1185 | $1,495 | $1.26 | 15d | 1 | 0.84mi |
| 333 Bell Blvd S Lehigh Acres, FL | 3.0 | 2.0 | 1114 | $1,300 | $1.17 | 3d | 1 | 0.84mi |
| 532 Ilaria Ct Lehigh Acres, FL | 4.0 | 2.0 | 1598 | $2,300 | $1.44 | 16d | 1 | 0.85mi |
| 397 Carrillon Ave S Lehigh Acres, FL | 3.0 | 2.0 | 1200 | $1,550 | $1.29 | 3d | 1 | 0.88mi |
| 350 Limerick Ave S Lehigh Acres, FL | 3.0 | 2.0 | 1199 | $1,800 | $1.50 | 3d | 1 | 0.91mi |
| 222 Ground Dove Cir Lehigh Acres, FL | 3.0 | 2.0 | 1417 | $1,695 | $1.20 | 10d | 1 | 0.91mi |
| 388 Bell Blvd S Lehigh Acres, FL | 3.0 | 2.0 | 1200 | $1,780 | $1.48 | 24d | 1 | 0.93mi |
| 477 Rayford St Lehigh Acres, FL | 4.0 | 3.0 | 1715 | $2,000 | $1.17 | 24d | 1 | 0.94mi |
| 312 Lenz Ave Lehigh Acres, FL | 3.0 | 2.5 | 2208 | $2,500 | $1.13 | 24d | 1 | 0.95mi |
| 404 Chalet Ave S Lehigh Acres, FL | 3.0 | 2.0 | 1200 | $1,850 | $1.54 | 24d | 1 | 0.95mi |
| 406 Chalet Ave S Lehigh Acres, FL | 3.0 | 2.0 | 1200 | $1,850 | $1.54 | 24d | 1 | 0.96mi |
| 472 Rajah St Lehigh Acres, FL | 3.0 | 2.0 | 1715 | $2,200 | $1.28 | 3d | 1 | 0.96mi |
| 129 Wanatah Ave Lehigh Acres, FL | 4.0 | 2.0 | 1798 | $1,911 | $1.06 | 3d | 1 | 0.98mi |
| 815 Porter St E Lehigh Acres, FL | 3.0 | 2.0 | 1659 | $1,800 | $1.08 | 24d | 1 | 1.03mi |
| 20055 Lake Vista Cir N Lehigh Acres, FL | 3.0 | 2.0 | 1442 | $1,700 | $1.18 | 24d | 1 | 1.04mi |
| 467 Raymer St Lehigh Acres, FL | 4.0 | 2.0 | 1833 | $1,850 | $1.01 | 10d | 1 | 1.04mi |
| 337 Rancho Ave Lehigh Acres, FL | 3.0 | 2.0 | 1723 | $2,150 | $1.25 | 24d | 1 | 1.06mi |
| 1406 Ford Cir Lehigh Acres, FL | 3.0 | 2.5 | 1662 | $2,100 | $1.26 | 24d | 1 | 1.07mi |
| 351 Ranchito Ave Lehigh Acres, FL | 3.0 | 2.5 | 1500 | $2,000 | $1.33 | 24d | 1 | 1.07mi |
Listing history 8 events
-
2026-06-17days on market $313,385 Active 365 DOM
-
2026-06-16days on market $313,385 Active 364 DOM
-
2026-06-16days on market $313,385 Active 363 DOM
-
2026-06-13days on market $313,385 Active 361 DOM
-
2026-06-09days on market $313,385 Active 357 DOM
-
2026-06-07days on market $313,385 Active 355 DOM
-
2026-06-01days on market $313,385 Active 349 DOM
-
2026-06-01days on market $313,385 Active 348 DOM
ⓘ Source: listings_history table (triggers on properties + properties_extension) + one-shot
backfill from property_details.listing_events for pre-trigger history.
Nearby sold comps map
Loading sold comps map…
Walkable amenities ~0.75 mi
Loading nearby amenities…
Taxation est. · year 1
- Rental income
- $25,118
- − Mortgage interest
- −$17,554
- − Property taxes
- −$4,701
- − Insurance
- −$1,567
- − Repairs & maintenance
- −$2,009
- − Management
- −$2,009
- − Depreciation
- −$9,117
- Taxable loss
- −$11,839
- Est. tax savings @ 24.0%
- +$2,841
- After-tax cash flow
- $-3,304/yr
For passive investors: Depreciation is non-cash, so a rental often shows a tax loss while cash-flowing — sheltering income. Rental losses are passive: they offset passive income freely, and up to $25,000/yr can offset ordinary (W-2) income if you actively participate and your MAGI is under $100k (phasing out to $0 by $150k); unused losses carry forward. On sale, claimed depreciation is recaptured at up to 25%, and gains may owe capital-gains tax (a 1031 exchange can defer both). Figures are a year-1 estimate at your 24.0% rate — not tax advice; consult a CPA.
Schools (NCES district)
- District
- Lee
- NCES district ID
- 1201080
- Math proficiency
- 47% ▼ -11.00%
- Reading proficiency
- 50% ▼ -4.00%
- Median HH income
- $49,518
- Composite
- 41.49/100
- National rank
- #3458
- State rank
- #42 of 73 in FL
Livability — Lehigh Acres
- Score
- 59/100
- State rank
- #826
- US rank
- #20055
Category grades
Schools grade is shown separately in the Schools card above.
Census & demographics
- Census place
- Lehigh Acres, FL
- County
- Lee County · 788,662 people
- City population
- 130,638
- Metro
- Cape Coral-Fort Myers, FL
- Population (ZIP)
- 19,927
- Household income
- $72,192
- Rent vs Own
- Severe rent burden
- 434.0
Population outlook (Lee County) Hauer SSP2
- Today (2025)
- 871,946 people
- By 2030
- 955,468 · +9.6%
- By 2040
- 1,113,587 · +27.7%
- By 2050
- 1,256,891 · +44.1%
- By 2075
- 1,560,270 · +78.9%
- By 2100
- 1,726,848 · +98.0%
Race, ethnicity, and origin ACS 2023
- Neighborhood character
- Diverse neighborhood (Simpson 0.64)
- Race & ethnicity
- Hispanic / Latino 52% Two or more races 31% White 26% Black 18%
- Hispanic origin (detail)
- Mexican 12% Puerto Rican 7% Cuban 20% Dominican 4%
- Common ancestry
- Hispanic 7% Italian 1% Portuguese 1%
- Foreign-born
- 32% · Canada, Jamaica
- Languages at home
- 48% English-only · Spanish 43% French/Haitian/Cajun 7% Other Indo-European 1%
Political lean MEDSL · Lee
- 2024 margin
- Strong R (+28.4) · D 35.5% · R 63.9%
- 2008→2024 swing
- -18.0pp toward R · 2008: -10.4pp · 2024: -28.4pp
- All cycles
- 2024: R+28.4 2020: R+19.2 2016: R+20.4 2012: R+16.6 2008: R+10.4
Not yet ingested
- Civics
- —
Market trends
- HPI YoY
- ▲ 16.53%
- Current HPI
- 303.3399
- Rent YoY
- ▼ -4.68%
- Metro
- Cape Coral-Fort Myers, FL
- State GDP YoY
- ▲ 3.28%
- F500 in state
- 36
Industry mix (Fortune 500 HQ in FL)
| Industry | F500 HQs | Revenue |
|---|---|---|
| Industrial Technology | 2 | $29B |
|
||
| Insurance | 2 | $17B |
|
||
| Retail | 1 | $60B |
|
||
| Technology Distribution | 1 | $58B |
|
||
| Homebuilding | 1 | $35B |
|
||
| Technology Manufacturing | 1 | $35B |
|
||
Cash-flow waterfall
monthlySold comps — $/sqft
last 12 mo · ≤1 miLoading sold comps…