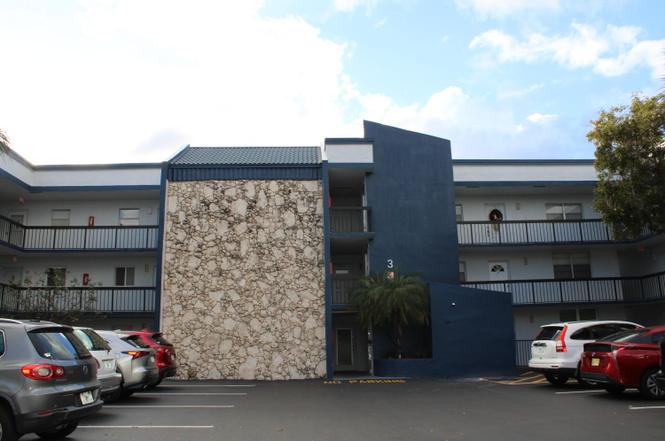
3200 Holiday Springs Blvd #105 · Margate, FL
Flood risk 1/10 · Minimal
- FEMA flood zone
- X (unshaded)
- Chance of flooding over 30 yrs
- 0.0%
- Est. flood insurance / yr
- $507 – $1,088
Fire risk 1/10 · Minimal
- Est. fire insurance / yr
- $947 – $1,759
Heat risk 9/10 · Severe
- Hot days now (above 106°F)
- 7 days/yr
- Hot days in 30 yrs
- 27 days/yr
Wind risk 10/10 · Severe
- Chance of severe wind over 30 yrs
- 99.0%
Air-quality risk 3/10 · Minor
- Unhealthy air days now
- 2 days/yr
- Unhealthy air days in 30 yrs
- 3 days/yr
Risk factors via First Street. Map © Google.
Why this score? — see what drove the D grade
The composite is a weighted blend of 9 inputs, each scored 0–100. Each bar is that input's sub-score; the figure is the points it added to the 100-point composite (weight × sub-score).
- 1% rule +10.0/10.0
- Cash flow +8.9/30.0
- ARV discount +7.5/15.0
- Schools +4.1/10.0
- Livability +4.0/5.0
- Rent growth +3.0/5.0
- DSCR +2.5/10.0
- Condition / age +2.5/5.0
- Appreciation +0.0/10.0
$124,900
🖨 Deal sheet (PDF) 📄 Offer letter ✓ Due diligence
Listing remarks
The community offers a heated pool, fitness center, tennis courts, and shuffleboard. Common laundry available. Cable TV and internet are included in the maintenance. One assigned parking space plus guest parking. Emotional support and service animals only. This beautiful 1st floor corner unit provides added privacy, very close to the Mosque, walk distance, lots of closet space, nice furniture will stay all-laminate flooring throughout. A new A/C was installed in September 2025. Located in a well-maintained community—come and take a look at this lovely apartment!
Key facts
- Fitness center
- Cable tv
- Tennis courts
Tags
Property features AI
Finance
- Financial info: Property is in a senior community; Pets allowed with size restrictions
- HOA & community: Homeowners association with monthly dues; HOA includes clubhouse and pool; HOA fee covers cable TV, grounds maintenance, and trash; Monthly HOA fee (amount provided separately)
Exterior
- Parking: 1 open parking space
- Security: Smoke detector(s)
- Utilities: Public sewer; Sewer service available
- Home design: Condominium; Resale property; Faces east; 3 total stories
- Construction: Brick construction
- Exterior features: Patio
Interior
- Kitchen: Dishwasher; Electric range; Microwave; Refrigerator
- Bedrooms: 2 bedrooms on the main level
- Flooring: Laminate flooring
- Bathrooms: 2 full bathrooms (both on the main level)
- Heating & cooling: Central heating; Central electric air conditioning
- Interior features: No notable built-in interior features listed; Partially furnished
- Laundry & utility: No laundry location or appliances specified
Neighborhood map
What this means for you Summary
Snapshot
- This is a 2-bed/2.0-bath condo listed at $125k.
Deal economics
- At list price, monthly cash flow is $-100 ($-1k/yr) — negative.
- To cash-flow at today's rent, offer at most $110k (11.6% below list).
- Meets the 1% rule at list price ($2k rent vs $125k).
- Recommended offer: $110k (12.0% below list) — sets the bar for market timing.
- Cap rate 5.3% vs local median 4.3% in Margate — meaningfully above typical; check what's discounted (condition, days-on-market, listing class) to confirm the premium yield is real.
Location & tenants
- Location reads 81/100 on livability (#85 in FL, #1,398 nationally) — a professional / high-income tenant draw. Strengths: commute A+, housing A+, health & safety A+; Watch: amenities F.
- Broward (suburban): math 42% / reading 53% proficiency, ranked #46 of 73 in FL (top 63%) — families likely to look elsewhere, expect single-tenant / working-renter base with shorter leases.
- Zoned schools: Margate Elementary School (math 35% / reading 43%, grade F, #1,560 of 2,144 statewide, top 73%, 1,023 students, 68% FRL); Nova Middle School (math 44% / reading 53%, grade C-, #274 of 571 statewide, top 50%, 1,284 students, 68% FRL); Coral Springs High School (math 16% / reading 38%, grade F, #478 of 667 statewide, top 73%, 2,320 students, 59% FRL).
- Market conditions: Rents rising (+1.9%/yr); 560 active listings in the ZIP; 40 comparable units currently listed for rent nearby; rentals at typical pace (median 15d on market — plan ~3-4 weeks tenant-placement turnaround); 2,111 units permitted in Broward County in 2024 (1,265 in 5+ unit buildings).
- This rent runs 36% of the median local income ($63k/yr) — at the standard rent-burdened threshold; future hikes will face affordability resistance.
Forward outlook
- Local home prices are declining (-3.0%/yr); year-one equity from $864 of loan paydown is wiped out by about $4k of value loss. Plan a longer hold.
- Broward County population projected at +34% by 2050 — long-run rental-demand tailwind backs the buy-and-hold thesis.
Negotiation context
- It's been on market 162 days — a 12% lower offer ($110k) is reasonable based on typical stale-listing flexibility.
Risks & watch-outs
- Watch-outs: HOA is 39% of rent.
- Climate carrying-cost: severe wind risk, 99% chance of damaging wind over 30y; extreme-heat days projected 7→27/yr by 2055 (HVAC capex compounding) — expect insurance premiums to compound above CPI over the hold.
Questions for the listing agent
- What do current leases actually rent for vs. the listed asking? Can we see a recent rent roll and the last 12 months of T-12 income?
- It's been on market 162 days. Have you received any prior offers? Is the seller open to a 12% concession, seller financing, or rate buy-down credit?
- Built in 1974 — when were the roof, HVAC, electrical panel, plumbing, and water heater last replaced?
- What does the HOA fee cover, when was the last increase, and are there any pending special assessments or reserve-fund shortfalls?
- Any open or pending special assessments — roof, HVAC, plumbing, elevator, façade? What's the per-unit balance and payoff schedule, and is the seller paying it off at close or rolling it to the buyer?
- Why hasn't it sold? Are there any deal-killer items the seller is aware of (foundation, flood, title, zoning, code violations)?
- Is there a deadline driving the sale (1031 exchange, divorce, estate, relocation)? That informs how much negotiation room exists.
- The area grade is low — what's the realistic commute time and amenity access for the typical tenant pool here? Any planned neighborhood developments (good or bad) we should know about?
- What's the average days-on-market for RENTAL listings here right now (not sales)? A rising rental-DOM trend means longer vacancies and softer asking-rent achievability than the comps imply.
- What's the recent tenant-quality profile in this submarket — average credit score on applications, eviction rate, late-payment / NSF rate, and stable-employment percentage? A property-management company in the area should have these aggregated.
- How much new apartment / multifamily construction is in the pipeline within 1–3 miles? Heavy new supply (>2% of stock underway) typically softens rents 12–24 months out; light construction supports rent growth.
Investment metrics
- 1% rule
- 1.52% ✓
- Cap rate
- 5.33%
- Cash-on-cash
- -3.43%
- DSCR
- 0.85
- GRM
- 5.5
CMA / ARV
No comps found within radius.
Projected returns pro-forma
-3.0% appreciation · 1.94% rent growth · sell at horizon
- IRR
- -23.8%
- Equity multiple
- 0.20×
- Total profit
- $-28,129
- Equity at exit
- $18,623
- IRR
- -24.0%
- Equity multiple
- -0.11×
- Total profit
- $-38,778
- Equity at exit
- $10,799
Cash invested: $34,972 (down + closing). Projections, not guarantees.
Landlord ↔ Tenant lean methodology
- Overall (STATE)
- 87 Strongly Landlord-Friendly
- State Florida
- 87 Strongly Landlord-Friendly · R+3
- County
- — inherits STATE
- City
- — inherits STATE
ZIP-level market 33063
- Home prices YoY
- -18.1%
- Rents YoY
- 1.9%
- Active inventory
- 560
- Price-to-rent
- 5.5×
Monthly cashflow live
- Estimated rent
- $1,893 high interval (Pro) →
- Mortgage (P&I)
- −$655
- Tax est. 1.5%
- −$156 /mo · $1,874/yr
- Insurance
- −$52
- HOA
- −$732
- Vacancy / Maint / Mgmt
- −$397
- Net cashflow
- $-100
Break-even live
Sensitivity live
| Price | -10% $-14 | -5% $-57 | +0% $-100 | +5% $-143 | +10% $-186 |
|---|---|---|---|---|---|
| Rent | -10% $-250 | -5% $-175 | +0% $-100 | +5% $-25 | +10% $49 |
| Rate | -1.0pp $-37 | -0.5pp $-68 | base $-100 | +0.5pp $-132 | +1.0pp $-165 |
UW: 25.0% down · 7.5% · 30yr · 1.5% tax · 5.0% vac · 8.0% maint · 8.0% mgmt
Financing live
Cash to close
- Down payment
- $31,225
- Closing costs
- $3,747
- Reserves months
- —
- Total cash needed
- —
Loan-product check · same deal, 3 products live
Conventional
25% down · 7.5% · 30yr
- Down + closing
- —
- Monthly P&I
- —
- Monthly cashflow
- —
- DSCR
- —
- Eligible?
- —
Personal DTI + credit; lowest rate.
DSCR
20% down · 8.5% · 30yr
- Down + closing
- —
- Monthly P&I
- —
- Monthly cashflow
- —
- DSCR
- —
- Eligible?
- —
No personal income docs; deal must DSCR.
Hard money
10% down · 12.0% · 12mo
- Down + closing
- —
- Monthly P&I
- —
- Monthly cashflow
- —
- DSCR
- —
- Eligible?
- —
Short-term bridge; refi at stabilization.
Rent comps 40 comps
| Address | Beds | Baths | Sqft | Rent | $/sqft | DOM | Units | Dist |
|---|---|---|---|---|---|---|---|---|
| 2977 Riverside Dr Coral Springs, FL | 2.0 | 2.0 | 1030 | $2,200 | $2.14 | 0d | 1 | 0.12mi |
| 2947 Riverside Dr #129 Coral Springs, FL | 1.0 | 1.0 | 620 | $1,650 | $2.66 | 0d | 1 | 0.14mi |
| 2947 Riverside Dr #129 Coral Springs, FL | 1.0 | 1.0 | 620 | $1,650 | $2.66 | 12d | 1 | 0.14mi |
| 2980 Riverside Dr #228 Coral Springs, FL | 1.0 | 1.5 | 1060 | $1,525 | $1.44 | 26d | 1 | 0.23mi |
| 3300 Pinewalk Dr N Margate, FL | 1.0–2.0 | 1.0–2.0 | 869 | $1,985 | $2.28 | 0d | 2 | 0.25mi |
| 3300 Pinewalk Dr N Margate, FL | 1.0–2.0 | 1.0–2.0 | 869 | $1,985 | $2.28 | 24d | 2 | 0.25mi |
| 2771 Riverside Dr Unit 405A Coral Springs, FL | 1.0 | 1.0 | 619 | $1,540 | $2.49 | 3d | 1 | 0.26mi |
| 2771 Riverside Dr Unit 316A Coral Springs, FL | 1.0 | 1.0 | 619 | $1,500 | $2.42 | 16d | 1 | 0.26mi |
| 2771 Riverside Dr Unit 416A Coral Springs, FL | 1.0 | 1.0 | 619 | $1,600 | $2.58 | 26d | 1 | 0.26mi |
| 2771 Riverside Dr Unit 405A Coral Springs, FL | 1.0 | 1.0 | 619 | $1,565 | $2.53 | 26d | 1 | 0.26mi |
| 2771 Riverside Dr Unit 211-A Coral Springs, FL | 1.0 | 1.0 | 541 | $1,350 | $2.50 | 0d | 1 | 0.26mi |
| 2771 Riverside Dr Unit 316A Coral Springs, FL | 1.0 | 1.0 | 619 | $1,475 | $2.38 | 6d | 1 | 0.26mi |
| 3310 Pinewalk Dr N #1812 Margate, FL | 2.0 | 2.0 | 963 | $1,875 | $1.95 | 18d | 1 | 0.27mi |
| 2710 Riverside Dr Unit 102A Coral Springs, FL | 1.0 | 1.5 | 795 | $1,650 | $2.08 | 26d | 1 | 0.28mi |
| 2733 Forest Hills Blvd Coral Springs, FL | 1.0–2.0 | 1.0–2.0 | 1009 | $2,265 | $2.24 | 0d | 6 | 0.31mi |
| 3330 Pinewalk Dr N #1623 Margate, FL | 1.0 | 1.0 | 712 | $1,750 | $2.46 | 13d | 1 | 0.32mi |
| 3330 Pinewalk Dr N #1623 Margate, FL | 1.0 | 1.0 | 712 | $1,700 | $2.39 | 6d | 1 | 0.32mi |
| 2701 Riverside Dr Apt 516 Coral Springs, FL | 1.0 | 1.0 | 619 | $1,500 | $2.42 | 12d | 1 | 0.32mi |
| 2701 Riverside Dr Unit 316B Coral Springs, FL | 1.0 | 1.0 | 619 | $1,400 | $2.26 | 26d | 1 | 0.32mi |
| 3187 Coral Lake Dr Unit 3187 Coral Springs, FL | 2.0 | 2.0 | 910 | $1,900 | $2.09 | 9d | 1 | 0.32mi |
| 3226 Coral Lake Ln Unit 3226 Coral Springs, FL | 2.0 | 2.0 | 910 | $2,100 | $2.31 | 5d | 1 | 0.33mi |
| 3222 Coral Lake Ln Coral Springs, FL | 2.0 | 2.0 | 910 | $2,100 | $2.31 | 26d | 1 | 0.33mi |
| 3226 Coral Lake Ln Unit 3226 Coral Springs, FL | 2.0 | 2.0 | 910 | $2,175 | $2.39 | 12d | 1 | 0.33mi |
| 3204 Coral Lake Ln Coral Springs, FL | 1.0 | 1.0 | 720 | $1,750 | $2.43 | 26d | 1 | 0.33mi |
| 3188 Coral Lake Way #3188 Coral Springs, FL | 1.0 | 1.0 | 720 | $1,750 | $2.43 | 26d | 1 | 0.33mi |
| 3188 Coral Lake Way #3188 Coral Springs, FL | 1.0 | 1.0 | 720 | $1,750 | $2.43 | 7d | 1 | 0.33mi |
| 8409 Forest Hills Dr #204 Coral Springs, FL | 2.0 | 2.0 | 1068 | $2,000 | $1.87 | 9d | 1 | 0.34mi |
| 3031 Holiday Springs Blvd Margate, FL | 1.0 | 2.0 | 750 | $1,525 | $2.03 | 14d | 1 | 0.34mi |
| 3031 Holiday Springs Blvd Unit 1APT 201 Margate, FL | 1.0 | 1.5 | 750 | $1,525 | $2.03 | 16d | 1 | 0.34mi |
| 8429 Forest Hills Dr Unit 111 Coral Springs, FL | 2.0 | 2.0 | 1068 | $2,000 | $1.87 | 26d | 1 | 0.36mi |
| 8429 Forest Hills Dr Coral Springs, FL | 2.0 | 2.0 | 1061 | $2,050 | $1.93 | 26d | 2 | 0.36mi |
| 3350 Pinewalk Dr N #1413 Margate, FL | 1.0 | 1.0 | 712 | $1,750 | $2.46 | 12d | 1 | 0.37mi |
| 2671 Riverside Dr #6 Coral Springs, FL | 2.0 | 1.0 | 800 | $1,725 | $2.16 | 24d | 1 | 0.37mi |
| 3340 Pinewalk Dr N #1518 Margate, FL | 2.0 | 2.0 | 1027 | $2,000 | $1.95 | 26d | 1 | 0.37mi |
| 3350 Pinewalk Dr N Margate, FL | 1.0–2.0 | 1.0–2.0 | 837 | $2,050 | $2.45 | 9d | 3 | 0.37mi |
| 8441 Forest Hills Dr #202 Coral Springs, FL | 2.0 | 2.0 | 1068 | $2,000 | $1.87 | 26d | 1 | 0.39mi |
| 8429 Forest Hills Dr #305 Coral Springs, FL | 2.0 | 2.0 | 1068 | $2,100 | $1.97 | 9d | 1 | 0.39mi |
| 2598 Riverside Dr Unit 2598 Coral Springs, FL | 2.0 | 2.0 | 820 | $1,600 | $1.95 | 26d | 1 | 0.43mi |
| 3351 NW 85th Ave #218 Coral Springs, FL | 2.0 | 2.0 | 925 | $2,100 | $2.27 | 0d | 1 | 0.44mi |
| 3380 Pinewalk Dr N #1113 Margate, FL | 2.0 | 1.0 | 912 | $1,850 | $2.03 | 26d | 1 | 0.47mi |
HOA detail condo
- Monthly dues
- $732 · $8,784/yr
- Likely covers
- internetcablepoolgymparking
- Assessments
- None detected in remarks — confirm with the listing agent.
Listing history 15 events
-
2026-06-21days on market $124,900 Active 162 DOM
-
2026-06-18days on market $124,900 Active 159 DOM
-
2026-06-17days on market $124,900 Active 158 DOM
-
2026-06-16days on market $124,900 Active 157 DOM
-
2026-06-15days on market $124,900 Active 156 DOM
-
2026-06-13days on market $124,900 Active 154 DOM
-
2026-06-09days on market $124,900 Active 150 DOM
-
2026-06-07days on market $124,900 Active 148 DOM
-
2026-06-04days on market $124,900 Active 145 DOM
-
2026-06-03days on market $124,900 Active 144 DOM
-
2026-06-02days on market $124,900 Active 143 DOM
-
2026-06-01days on market $124,900 Active 142 DOM
-
2026-05-31days on market $124,900 Active 141 DOM
-
2026-03-21price $124,900
-
2026-01-10$150,000 Active
ⓘ Source: listings_history table (triggers on properties + properties_extension) + one-shot
backfill from property_details.listing_events for pre-trigger history.
Climate risk First Street
- Flood 1/10 Low FEMA zone X (unshaded) · 0% chance over 30 yrs
- Wildfire 1/10 Low
- Heat 9/10 Extreme 7 d/yr ≥106°F today · 27 d/yr by 30 yrs out
- Wind 10/10 Extreme 99% chance of damaging wind over 30 yrs
- Air quality 3/10 Moderate 2 unhealthy d/yr today · 3 by 30 yrs out
Nearby sold comps map
Loading sold comps map…
Walkable amenities ~0.75 mi
Loading nearby amenities…
Taxation est. · year 1
- Rental income
- $22,711
- − Mortgage interest
- −$6,996
- − Property taxes
- −$1,874
- − Insurance
- −$624
- − Repairs & maintenance
- −$1,817
- − Management
- −$1,817
- − HOA
- −$8,784
- − Depreciation
- −$3,633
- Taxable loss
- −$2,835
- Est. tax savings @ 24.0%
- +$680
- After-tax cash flow
- $-520/yr
For passive investors: Depreciation is non-cash, so a rental often shows a tax loss while cash-flowing — sheltering income. Rental losses are passive: they offset passive income freely, and up to $25,000/yr can offset ordinary (W-2) income if you actively participate and your MAGI is under $100k (phasing out to $0 by $150k); unused losses carry forward. On sale, claimed depreciation is recaptured at up to 25%, and gains may owe capital-gains tax (a 1031 exchange can defer both). Figures are a year-1 estimate at your 24.0% rate — not tax advice; consult a CPA.
Schools (NCES district)
- District
- Broward
- NCES district ID
- 1200180
- Math proficiency
- 42% ▼ -18.00%
- Reading proficiency
- 53% ▼ -5.00%
- Median HH income
- $52,139
- Composite
- 40.88/100
- National rank
- #3621
- State rank
- #46 of 73 in FL
Livability — Margate
- Score
- 81/100
- State rank
- #85
- US rank
- #1398
Category grades
Schools grade is shown separately in the Schools card above.
Census & demographics
- Census place
- Margate, FL
- County
- Broward County · 1,963,430 people
- City population
- 55,466
- Metro
- Miami-Fort Lauderdale-Pompano Beach, FL
- Population (ZIP)
- 55,466
- Household income
- $62,918
- Rent vs Own
- Severe rent burden
- 2290.0
Population outlook (Broward County) Hauer SSP2
- Today (2025)
- 2,207,033 people
- By 2030
- 2,360,704 · +7.0%
- By 2040
- 2,661,208 · +20.6%
- By 2050
- 2,946,698 · +33.5%
- By 2075
- 3,602,273 · +63.2%
- By 2100
- 3,970,984 · +79.9%
Race, ethnicity, and origin ACS 2023
- Neighborhood character
- Highly diverse neighborhood (Simpson 0.72)
- Race & ethnicity
- White 34% Hispanic / Latino 29% Black 28% Two or more races 18% Asian 4%
- Hispanic origin (detail)
- Mexican 2% Puerto Rican 7% Cuban 3% Dominican 3%
- Common ancestry
- Hispanic 6% Romanian 2% Estonian 2%
- Foreign-born
- 36% · Canada, Jamaica, Vietnam
- Languages at home
- 61% English-only · Spanish 24% French/Haitian/Cajun 7% Other Indo-European 4%
Political lean MEDSL · Broward
- 2024 margin
- D (+17.0) · D 58.0% · R 41.0%
- 2008→2024 swing
- -17.8pp toward R · 2008: 34.7pp · 2024: 17.0pp
- All cycles
- 2024: D+17.0 2020: D+29.8 2016: D+35.0 2012: D+34.9 2008: D+34.7
Not yet ingested
- Civics
- —
Market trends
- HPI YoY
- ▼ -87.17%
- Current HPI
- 393.9225
- Rent YoY
- ▲ 1.94%
- Metro
- Miami-Fort Lauderdale-Pompano Beach, FL
- State GDP YoY
- ▲ 3.28%
- F500 in state
- 36
Industry mix (Fortune 500 HQ in FL)
| Industry | F500 HQs | Revenue |
|---|---|---|
| Industrial Technology | 2 | $29B |
|
||
| Insurance | 2 | $17B |
|
||
| Retail | 1 | $60B |
|
||
| Technology Distribution | 1 | $58B |
|
||
| Homebuilding | 1 | $35B |
|
||
| Technology Manufacturing | 1 | $35B |
|
||
Price history
-16.7% since first listed2 events — show timeline
- 2026-03-21 Price Changed $124,900 Beaches MLS
- 2026-01-10 Listed $150,000 Beaches MLS
Cash-flow waterfall
monthlySold comps — $/sqft
last 12 mo · ≤1 miLoading sold comps…